

👋Welcome back to The Market Mosaic, where I gauge the stock market’s next move by looking at macro, technicals, and market internals. I’ll also highlight trade ideas using this analysis.
If you find this report helpful please hit that “like” button, share this post, and become a subscriber if you haven’t already done so!
🚨And be sure to check out Mosaic Traders Hub. It’s a members-only platform to alert trade ideas, track a model portfolio of open positions, and further analyze the message coming from the capital markets.
Now for this week’s issue…
A turbulent week for equities featured evidence of a strengthening economy coupled with efforts by the U.S. Treasury to stem the jump in longer-dated yields.
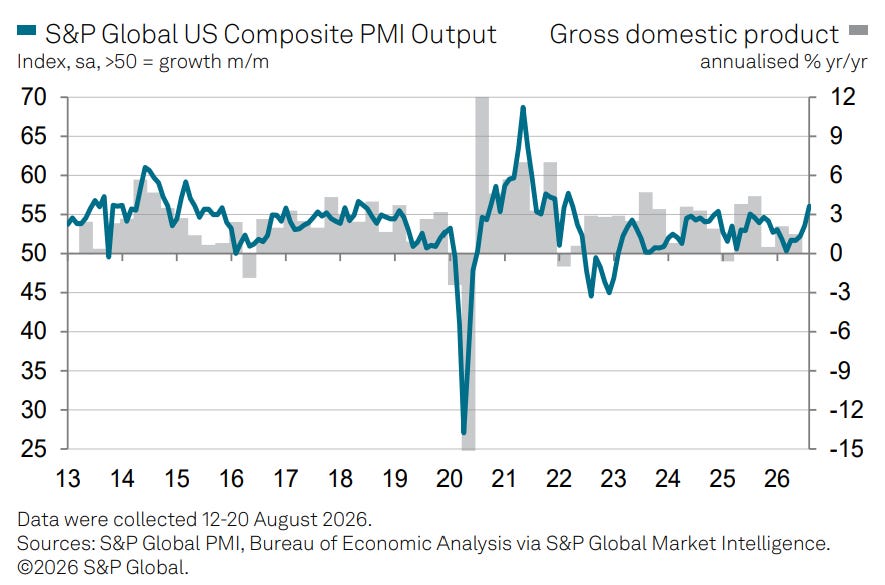
A report from S&P Global showed their U.S. Flash PMI jumping to 56.0 compared to 54.5 last month. A reading over 50 indicates expansion, with the monthly gains concentrated in the service sector of the economy.
That was the highest reading in over four years and adds to recent reports showing economic activity holding up. At the same time, no resolution to the conflict in the Middle East is keeping pressure on oil prices.
The inflationary implications of an accelerating economy and high oil prices is pushing long-term interest rates higher. The rate on the 30-year U.S. Treasury hit 5.31% last week…the highest level in 19 years.
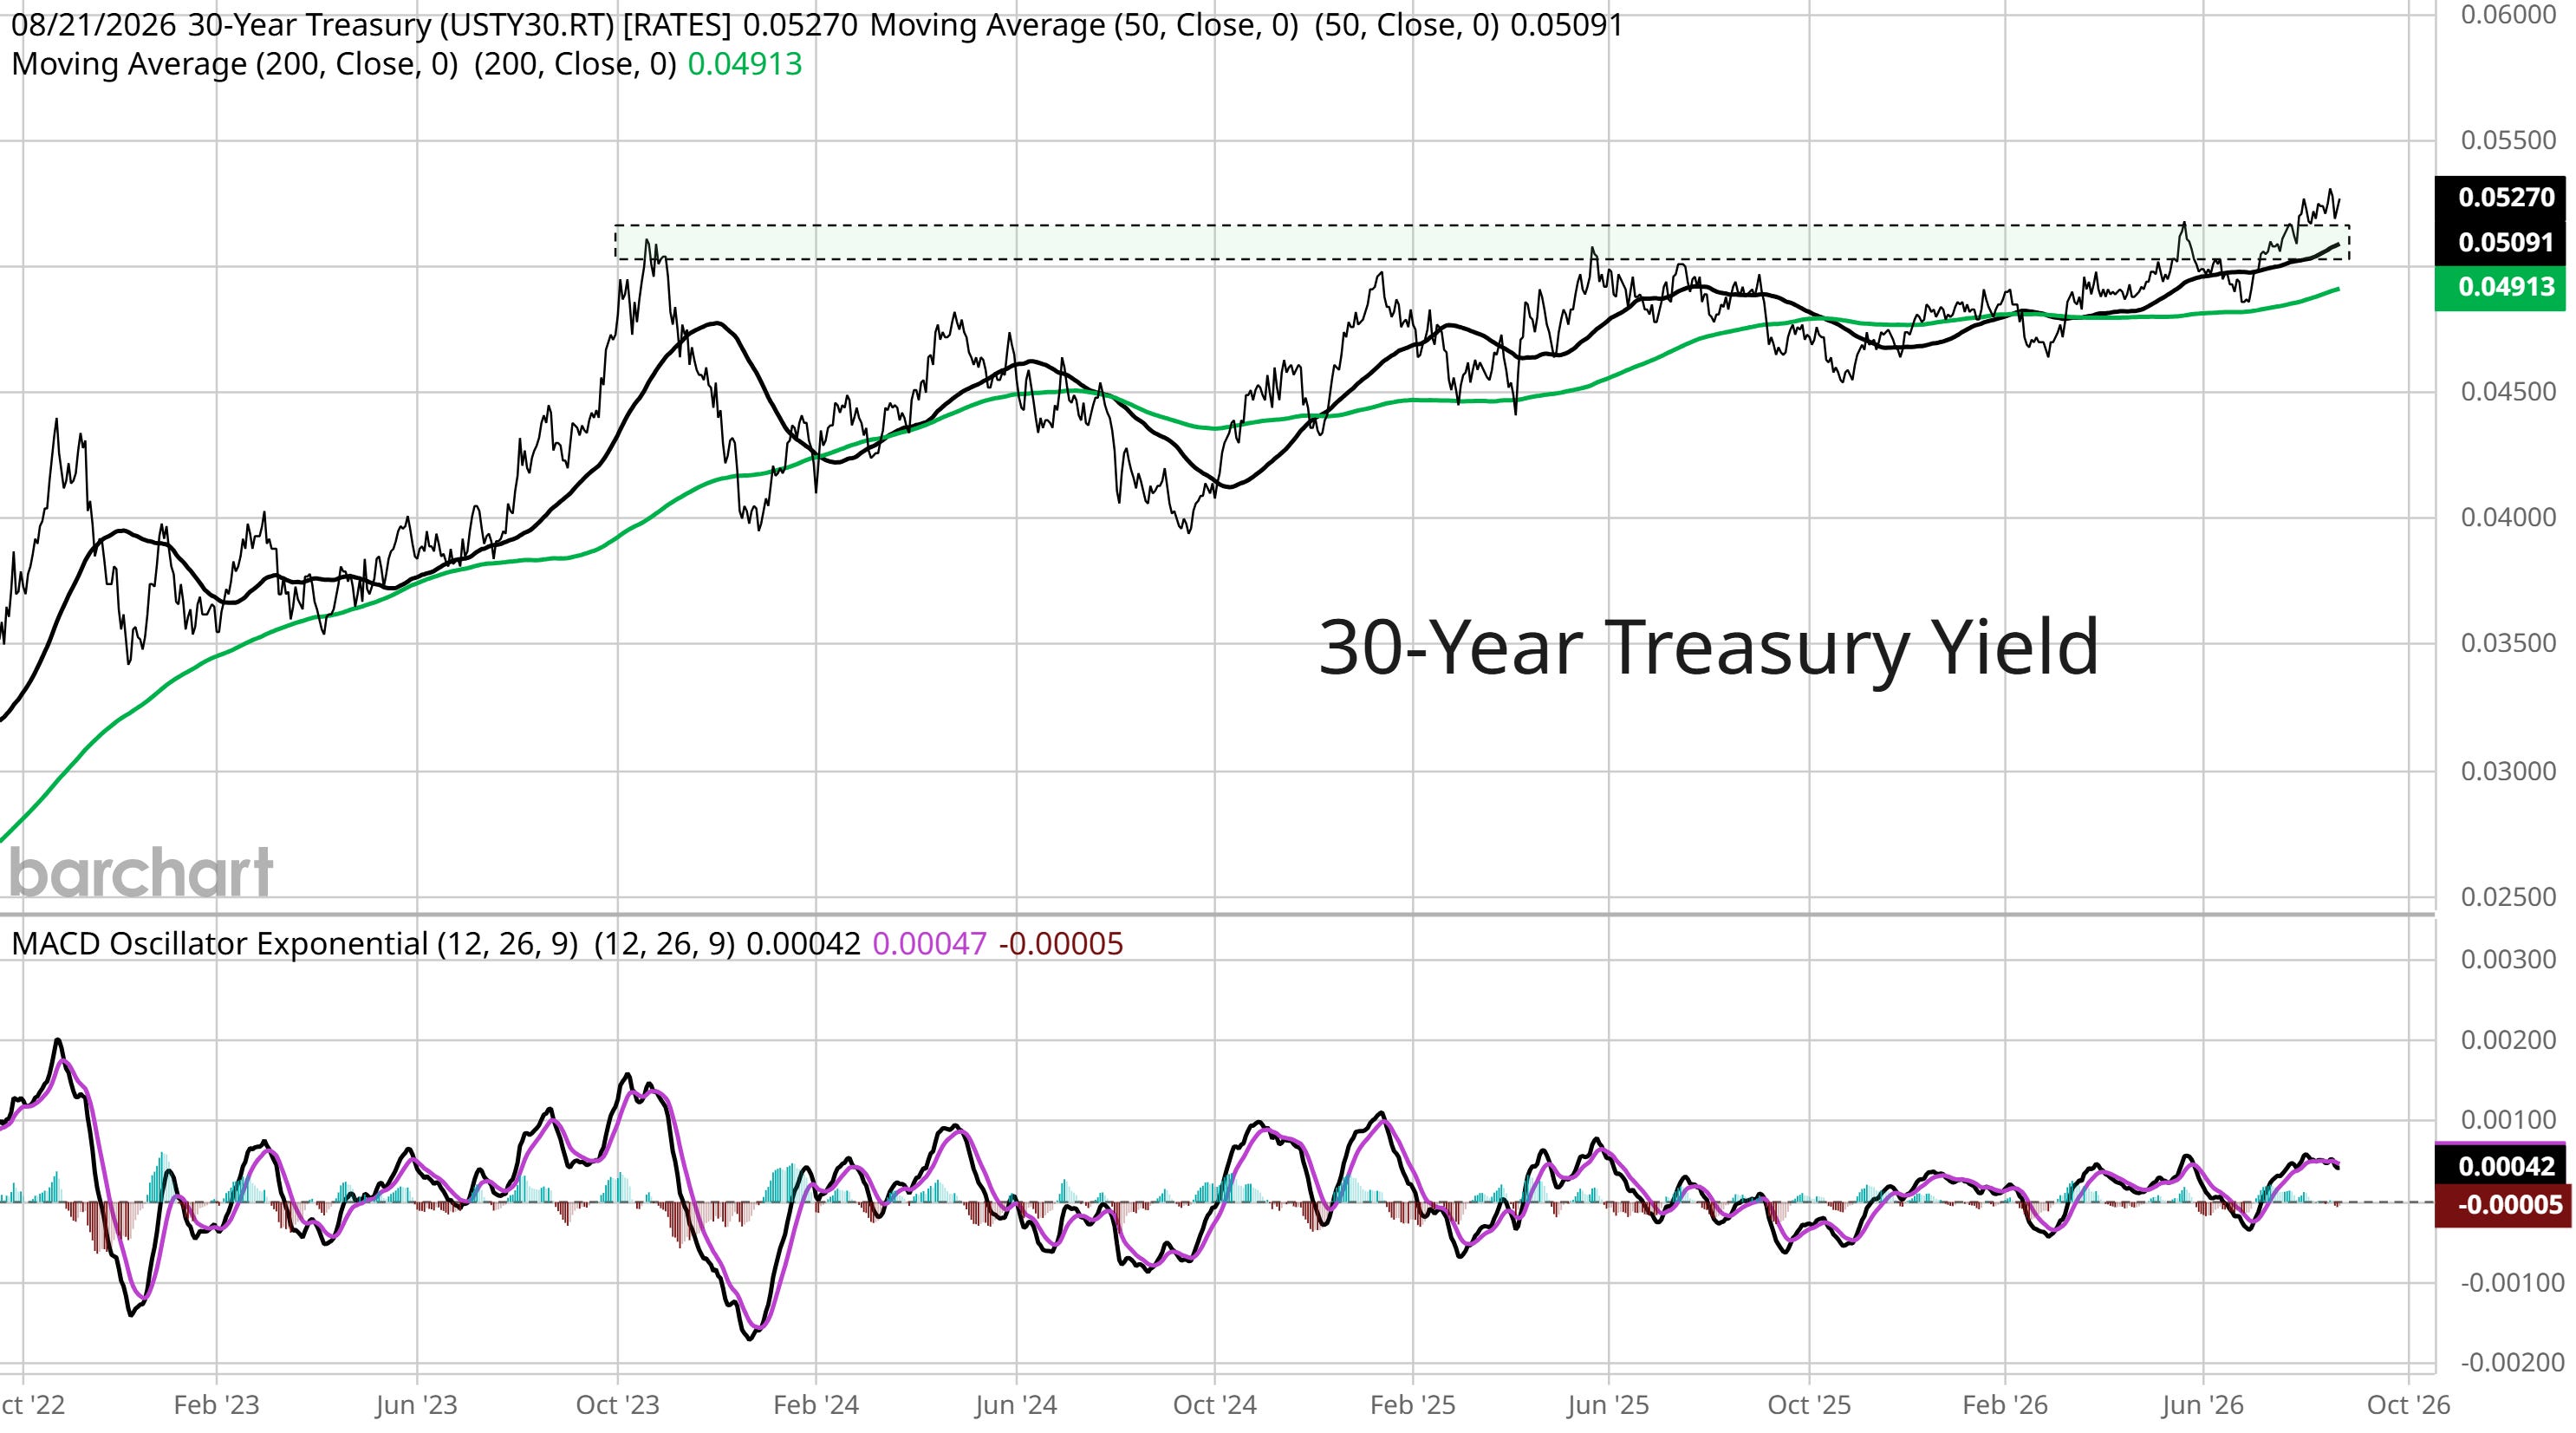
A day later, U.S. Treasury Secretary Scott Bessent announced that a buyback program targeting long-term bonds would at least double in size to $4 billion. While the move is being described as providing liquidity, the real reason is a form of yield curve control.
Short-term bonds will be issued to fund proceeds for the buyback program, meaning there should not be a net change in money supply as a result. It’s also worth noting the program size is nothing compared to the amount of Treasuries outstanding that’s now crossing above $40 trillion.
But the intervention shows that officials are watching rates with concern and are willing to take action to stem the rise in yields…potentially hinting at more action ahead should rates not respond.
The intervention ignited a move in assets sensitive to the outlook for liquidity, including gold and Bitcoin. That hints at market concerns over currency debasement should measures like quantitative easing make a return to contain interest rates.
This week, let’s look at evidence that the economy is holding up much better than feared against geopolitical uncertainty and how that’s benefiting the average stock. We’ll also look at the jump in bond yields around the world that’s prompting intervention.
The Chart Report
Against geopolitical uncertainties and elevated energy prices, economic data is holding up rather well. The Atlanta Fed’s GDPNow model is estimating third quarter growth at 4% while another report shows accelerating activity in the domestic manufacturing and service sector of the economy. S&P Global’s Flash U.S. PMI came in at 56.0 compared to 54.5 last month where reading over 50 indicates expansion. The monthly gains were concentrated in the service sector of the economy. The chart below overlays the U.S. composite PMI with annualized GDP growth, with the PMI hitting the highest level in over four years.
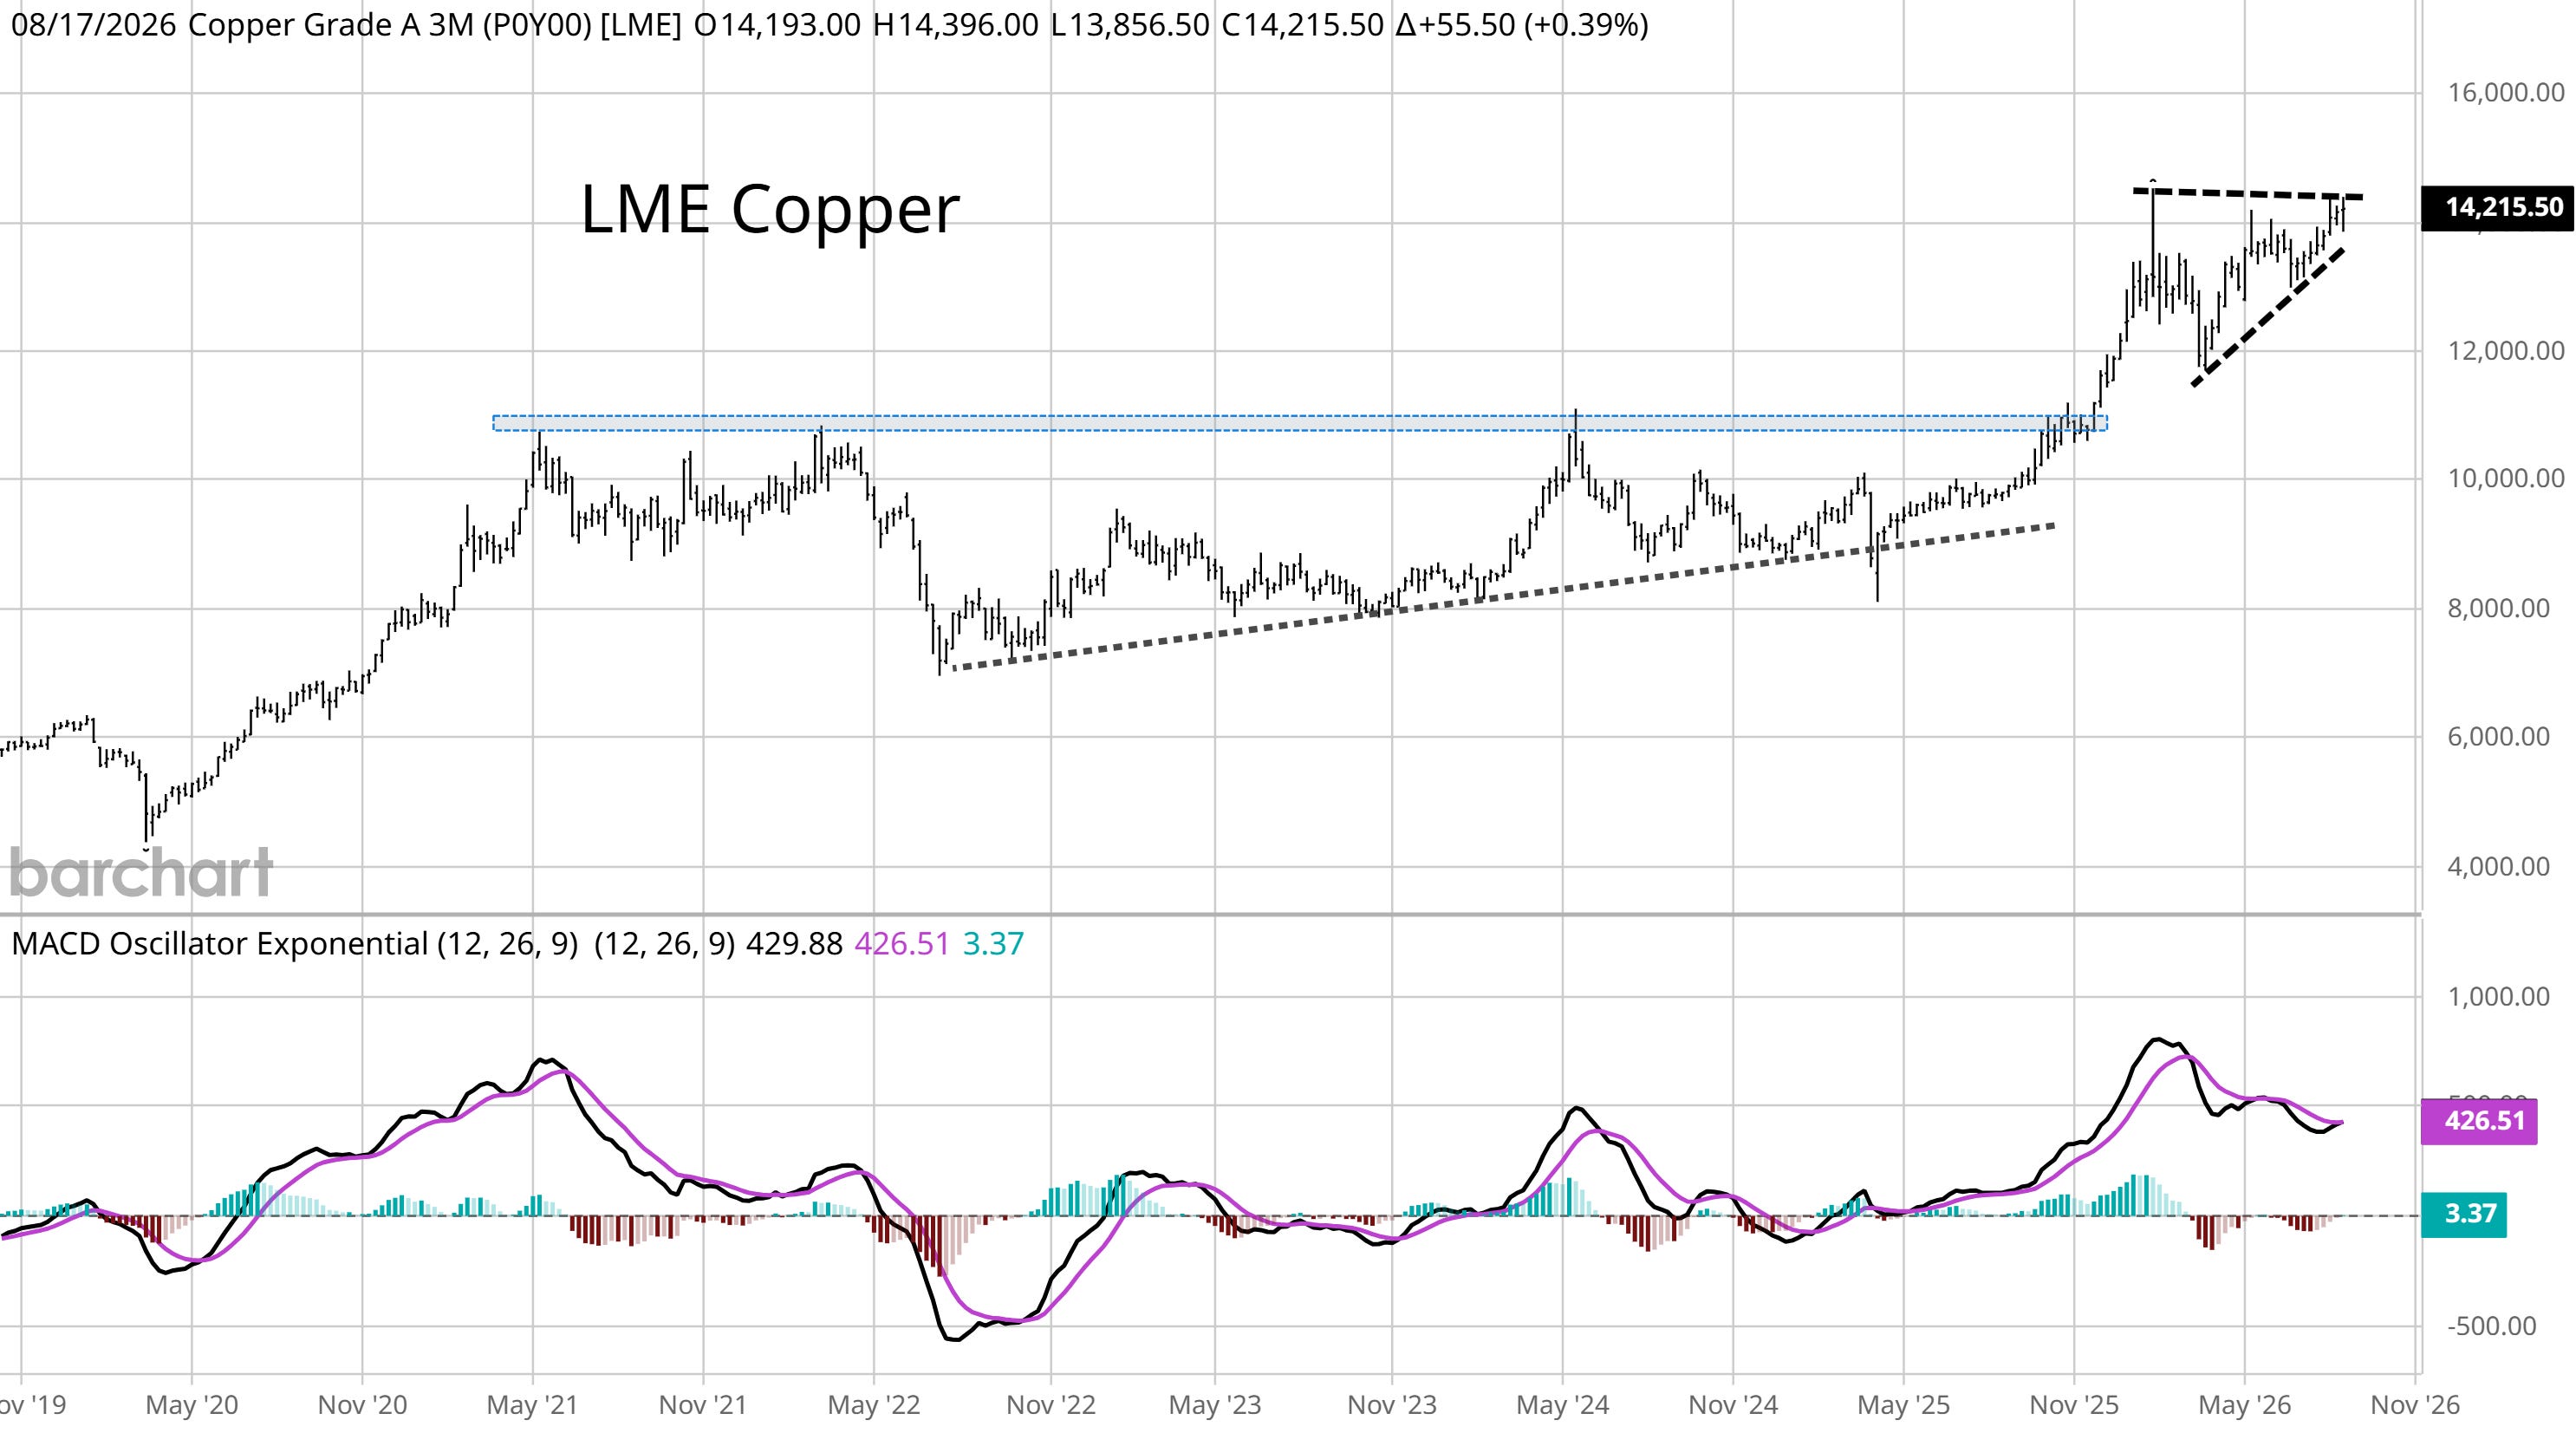
Commodity prices sensitive to economic activity are holding near record levels and are setting up to potentially breakout. Copper is used in a variety of construction end markets and is also seeing a boost from AI capex pouring into data centers. Copper prices traded on the LME (which is a better global benchmark) broke to record highs from a large ascending triangle pattern that formed over several years. In the near-term, copper is forming another ascending triangle continuation pattern which could see copper prices make another run higher. That would confirm recent strong economic data but also be a warning on the outlook for inflation.
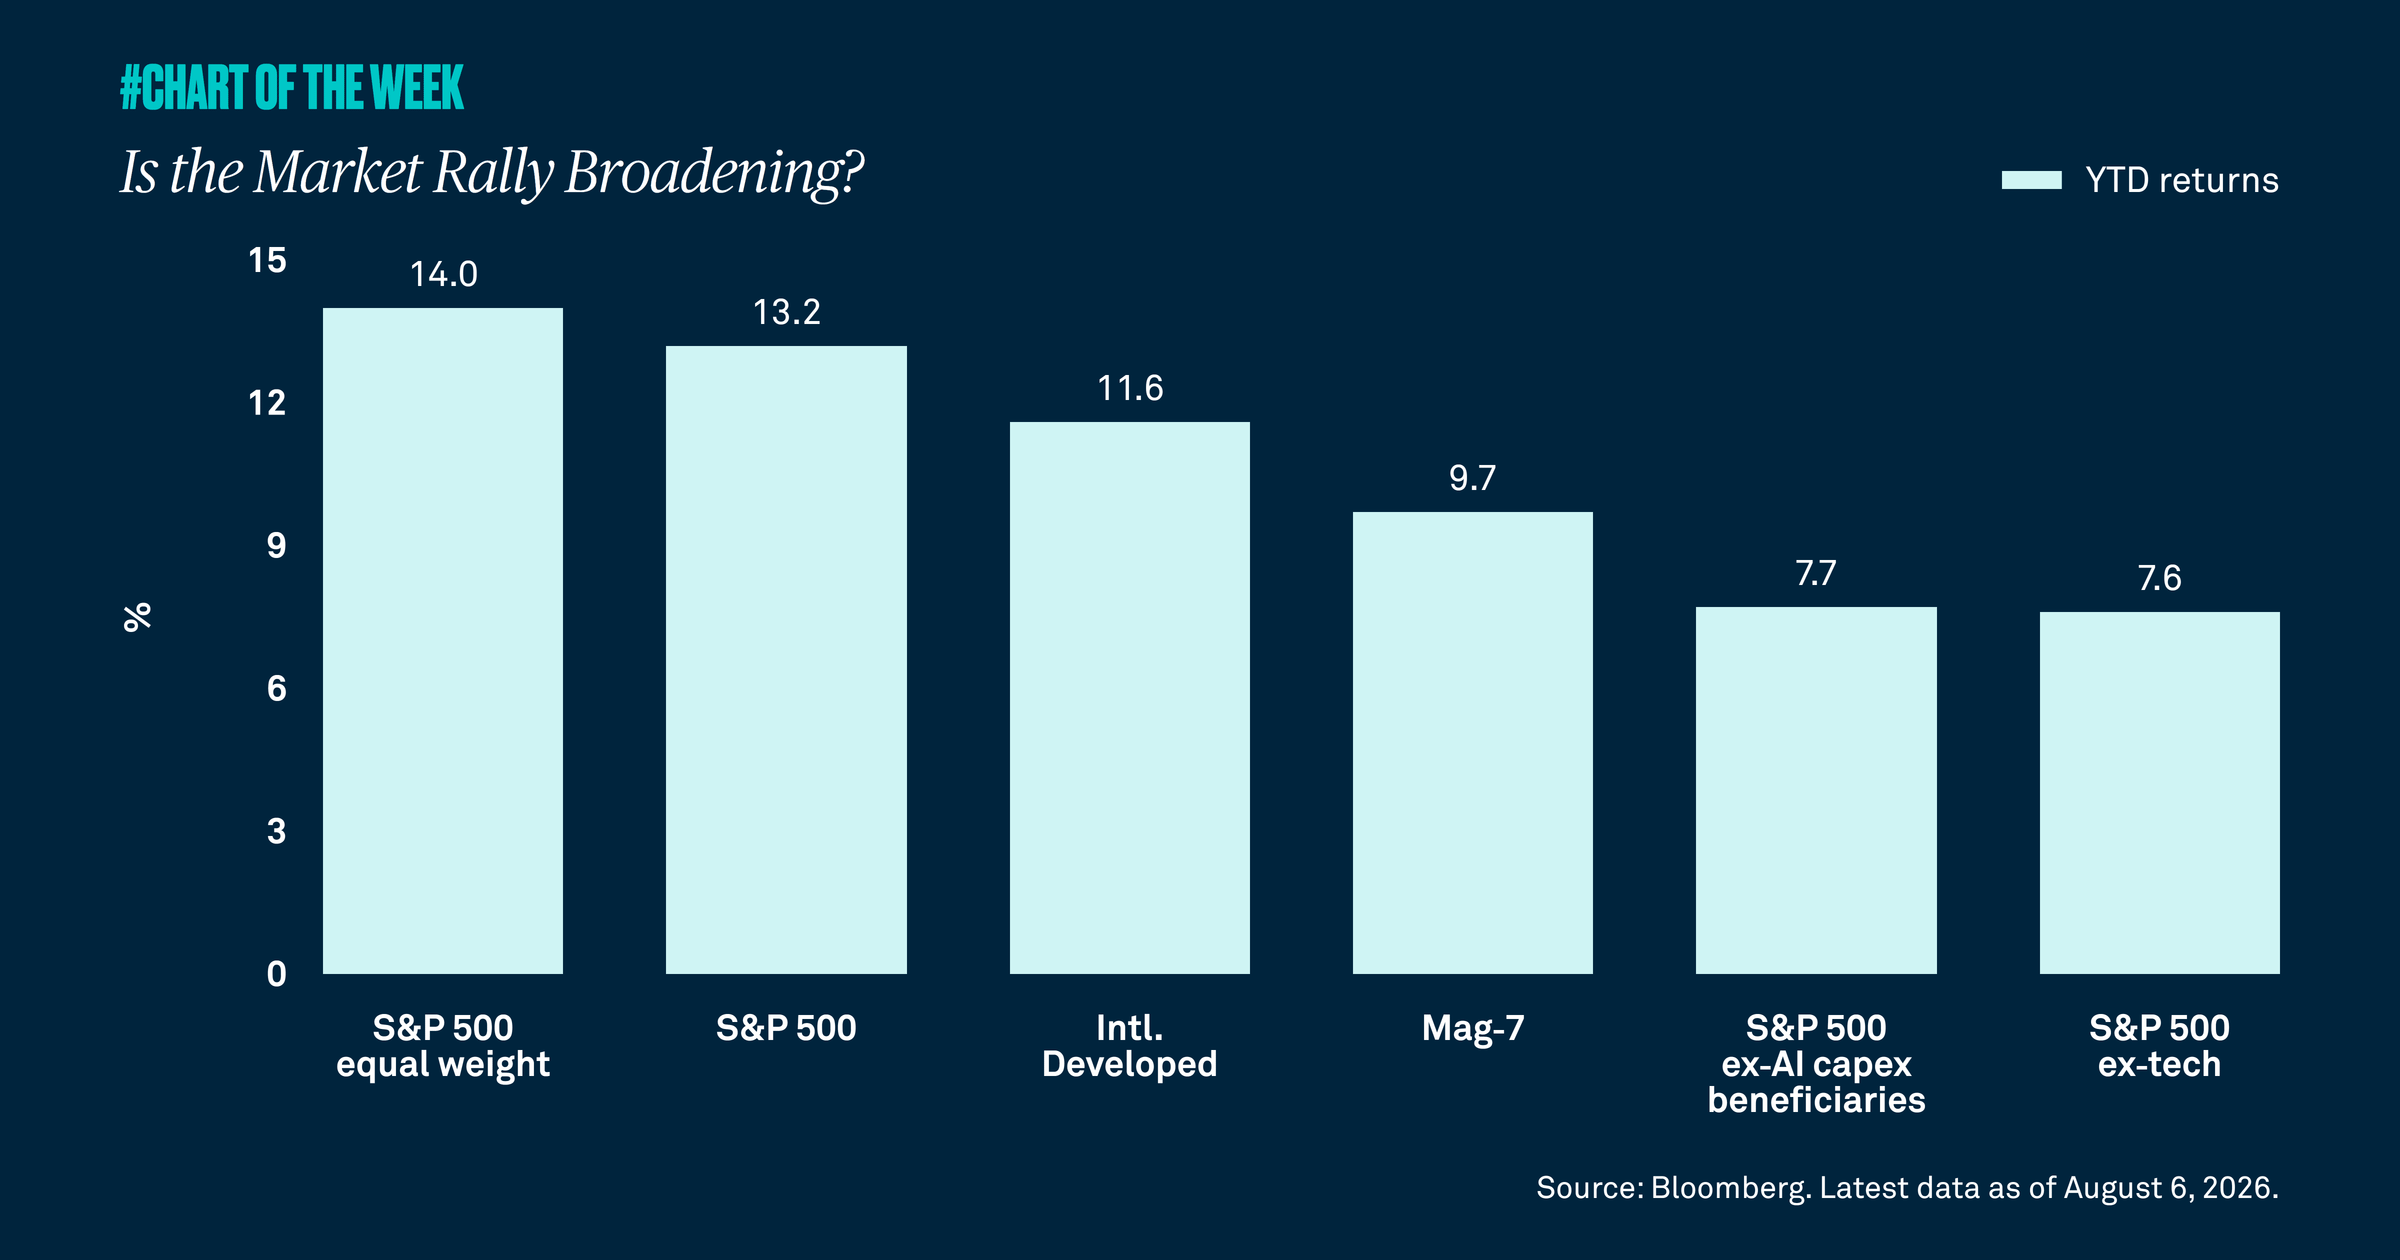
With the underlying economy holding up, that should benefit the earnings outlook for the average stock. So far in 2026, stock market leadership is rotating away from companies leveraged to AI like the Mag 7 and into the the average stock. You can see in the chart below that the equal-weight S&P 500 is outpacing the capitalization weight index and is well ahead of the Mag 7 year-to-date. That also speaks to broadening participation in the bull market and runs counter to concerns that gains are being narrowly concentrated in stocks most geared to AI infrastructure spending like semiconductors.
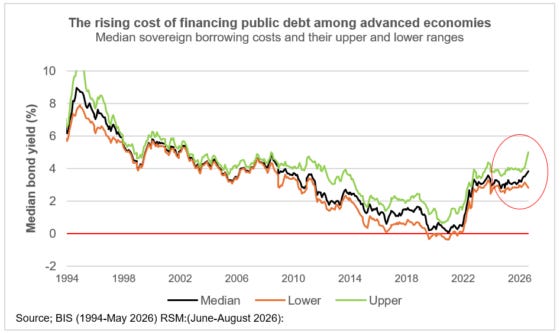
Interest rates around the world are on the rise as inflation pressures collide with concerns over rising debt levels and persistently high government budget deficits. The black line in the chart below shows the median bond yield for advanced economies. Rising rates prompted the U.S. Treasury to intervene in rate markets by doubling a buyback program to purchase long-term bonds. While the move is being described as providing liquidity, the real reason is a form of yield curve control where short-term bonds will be issued to fund proceeds for the buyback program. The intervention shows that officials are watching rates with concern and are willing to take action to stem the rise in yields.
Heard in the Hub
The Traders Hub features live trade alerts, market update videos, and other educational content for members.
Here’s a quick recap of recent alerts, market updates, and educational posts:
When will rising rates impact stocks.
The surprising trend in recent investor sentiment views.
The S&P 500’s next move based on this cycle composite.
How I’m using weekly charts to determine the state of the trend.
Loose financial conditions remain a massive tailwind for stocks.
You can follow everything we’re trading and tracking by becoming a member of the Traders Hub.
By becoming a member, you will unlock all market updates and trade alerts reserved exclusively for members.
Trade Idea
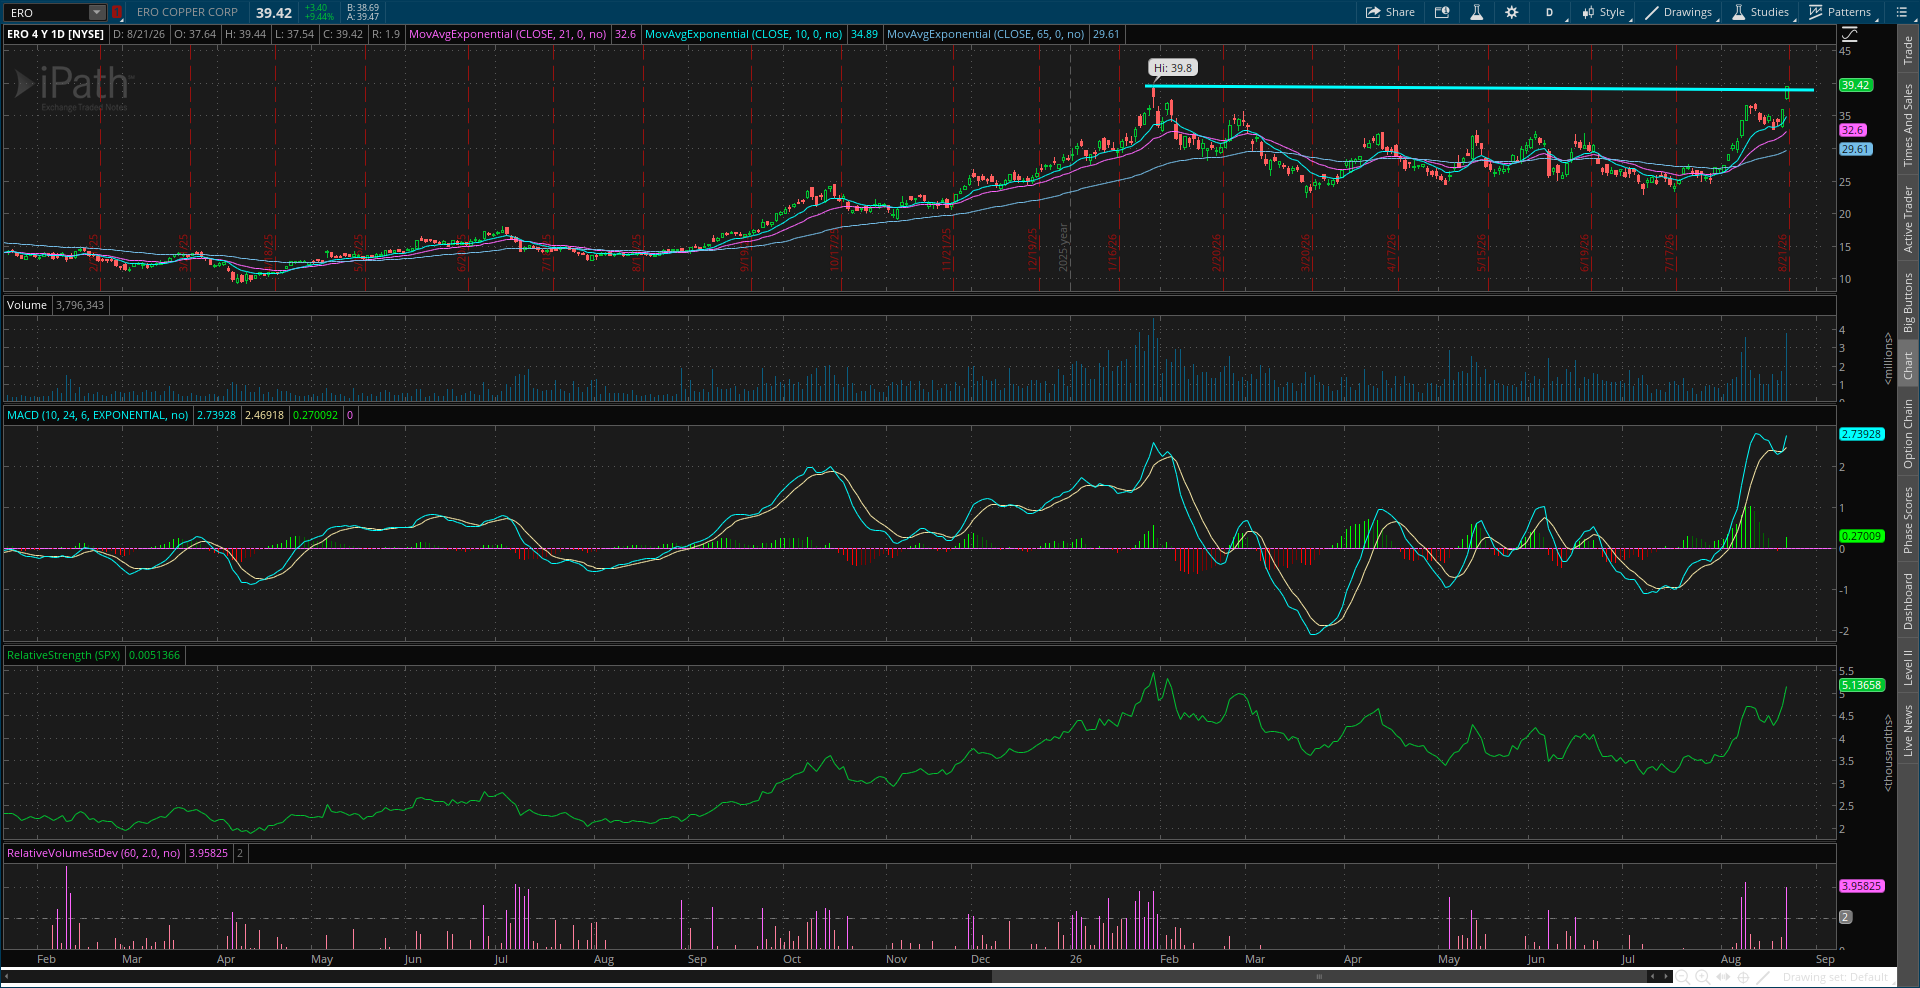
Ero Copper (ERO)
Copper mining stock that ran up to the $40 level in January and trading in a sideways basing pattern. The stock is recently testing resistance but with the MACD extended. Need a smaller pullback and MACD reset before breaking out to new highs.
Key Upcoming Data
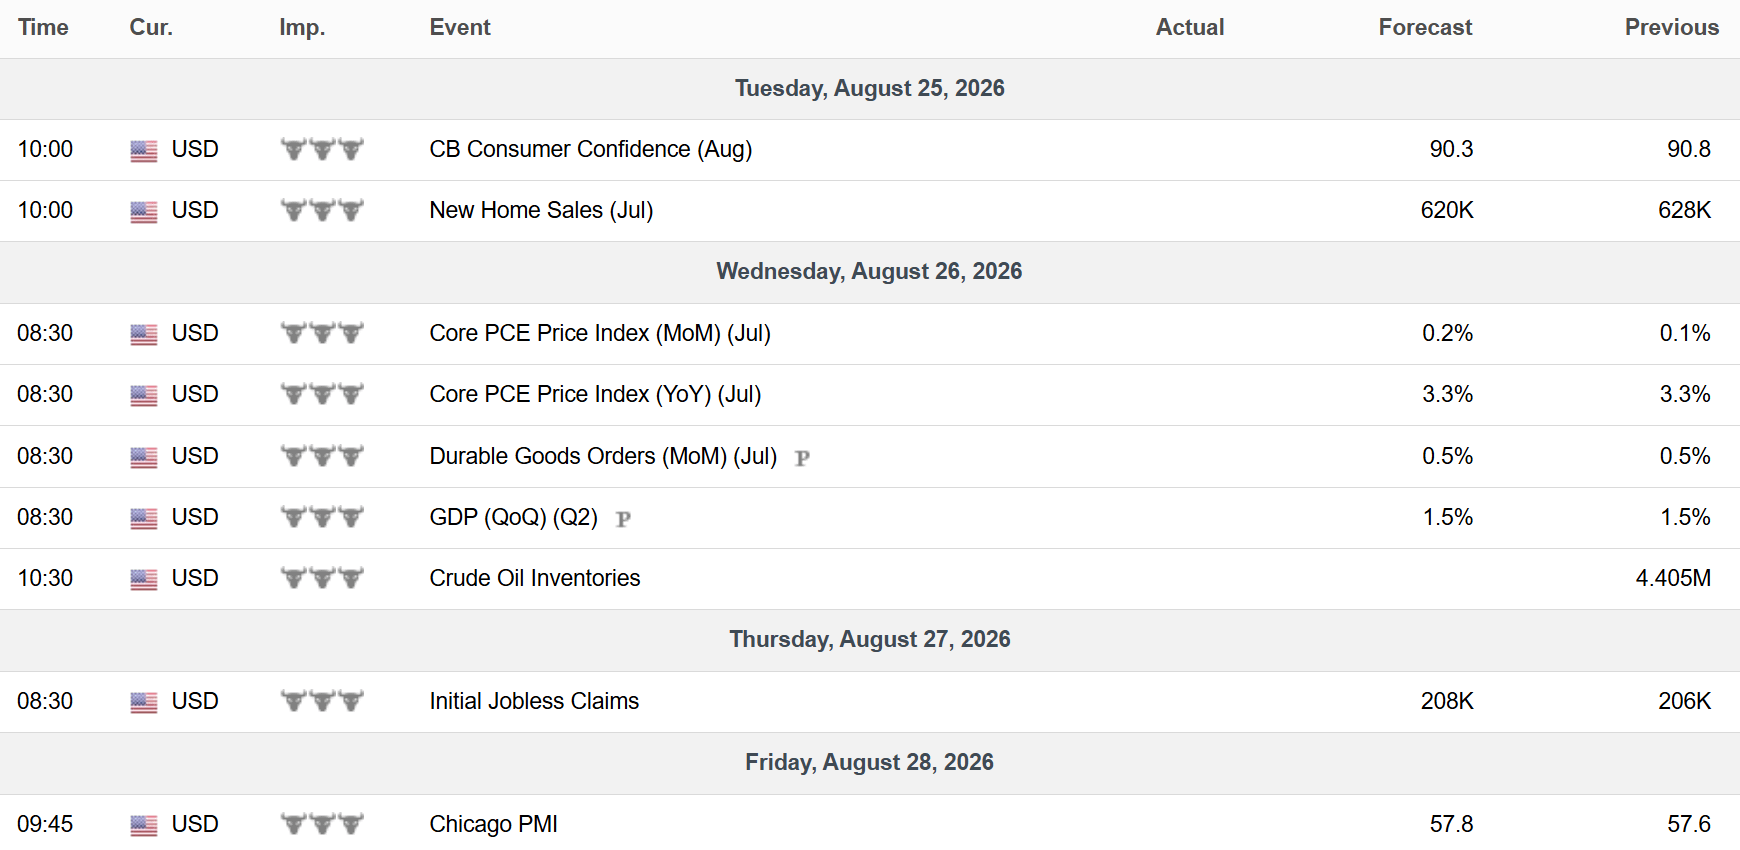
Economic Reports
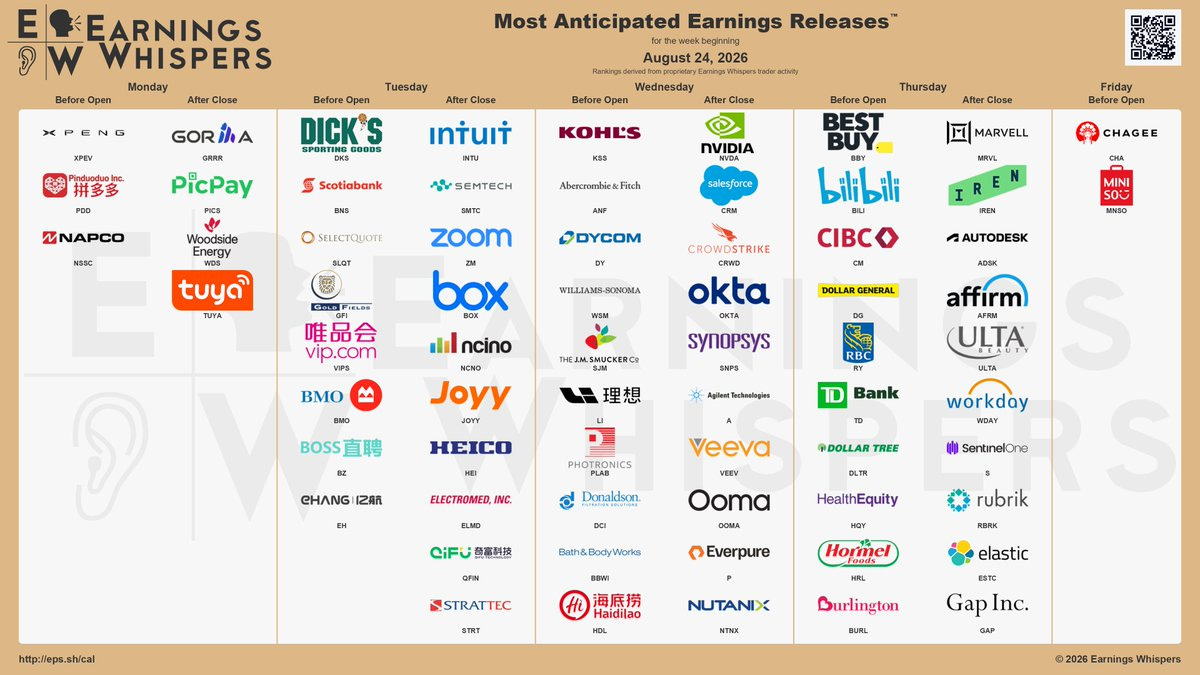
Earnings Reports
I hope you’ve enjoyed The Market Mosaic, and please share this report with your family, friends, coworkers…or anyone that would benefit from an objective look at the stock market.
Become a member of the Traders Hub to unlock access to:
✅Model Portfolio
✅Members Only Chat
✅Trade Ideas & Live Alerts
✅Mosaic Vision Market Updates + More
Our model portfolio is built using a “core and explore” approach, including a Stock Trading Portfolio and ETF Investment Portfolio.
Come join us over at the Hub as we seek to capitalize on stocks and ETFs that are breaking out!
And if you have any questions or feedback, feel free to shoot me an email at mosaicassetco@gmail.com
Disclaimer: these are not recommendations and just my thoughts and opinions…do your own due diligence! I may hold a position in the securities mentioned in this report.
Government intervention in bond markets can create liquidity driven moves, but the key question is whether those moves transmit into broader financial conditions.