

👋Welcome back to The Market Mosaic, where I gauge the stock market’s next move by looking at macro, technicals, and market internals. I’ll also highlight trade ideas using this analysis.
If you find this report helpful please hit that “like” button, share this post, and become a subscriber if you haven’t already done so!
🚨And be sure to check out Mosaic Traders Hub. It’s a members-only platform to alert trade ideas, track a model portfolio of open positions, and further analyze the message coming from the capital markets.
Now for this week’s issue…
Surging volatility in the semiconductor sector is colliding with uncertainty over the next move in interest rates.
Chip stocks have collectively fallen into bear market territory after leading the AI bull market higher into late June. Optimism over data center infrastructure spending is being met with extended stock prices.
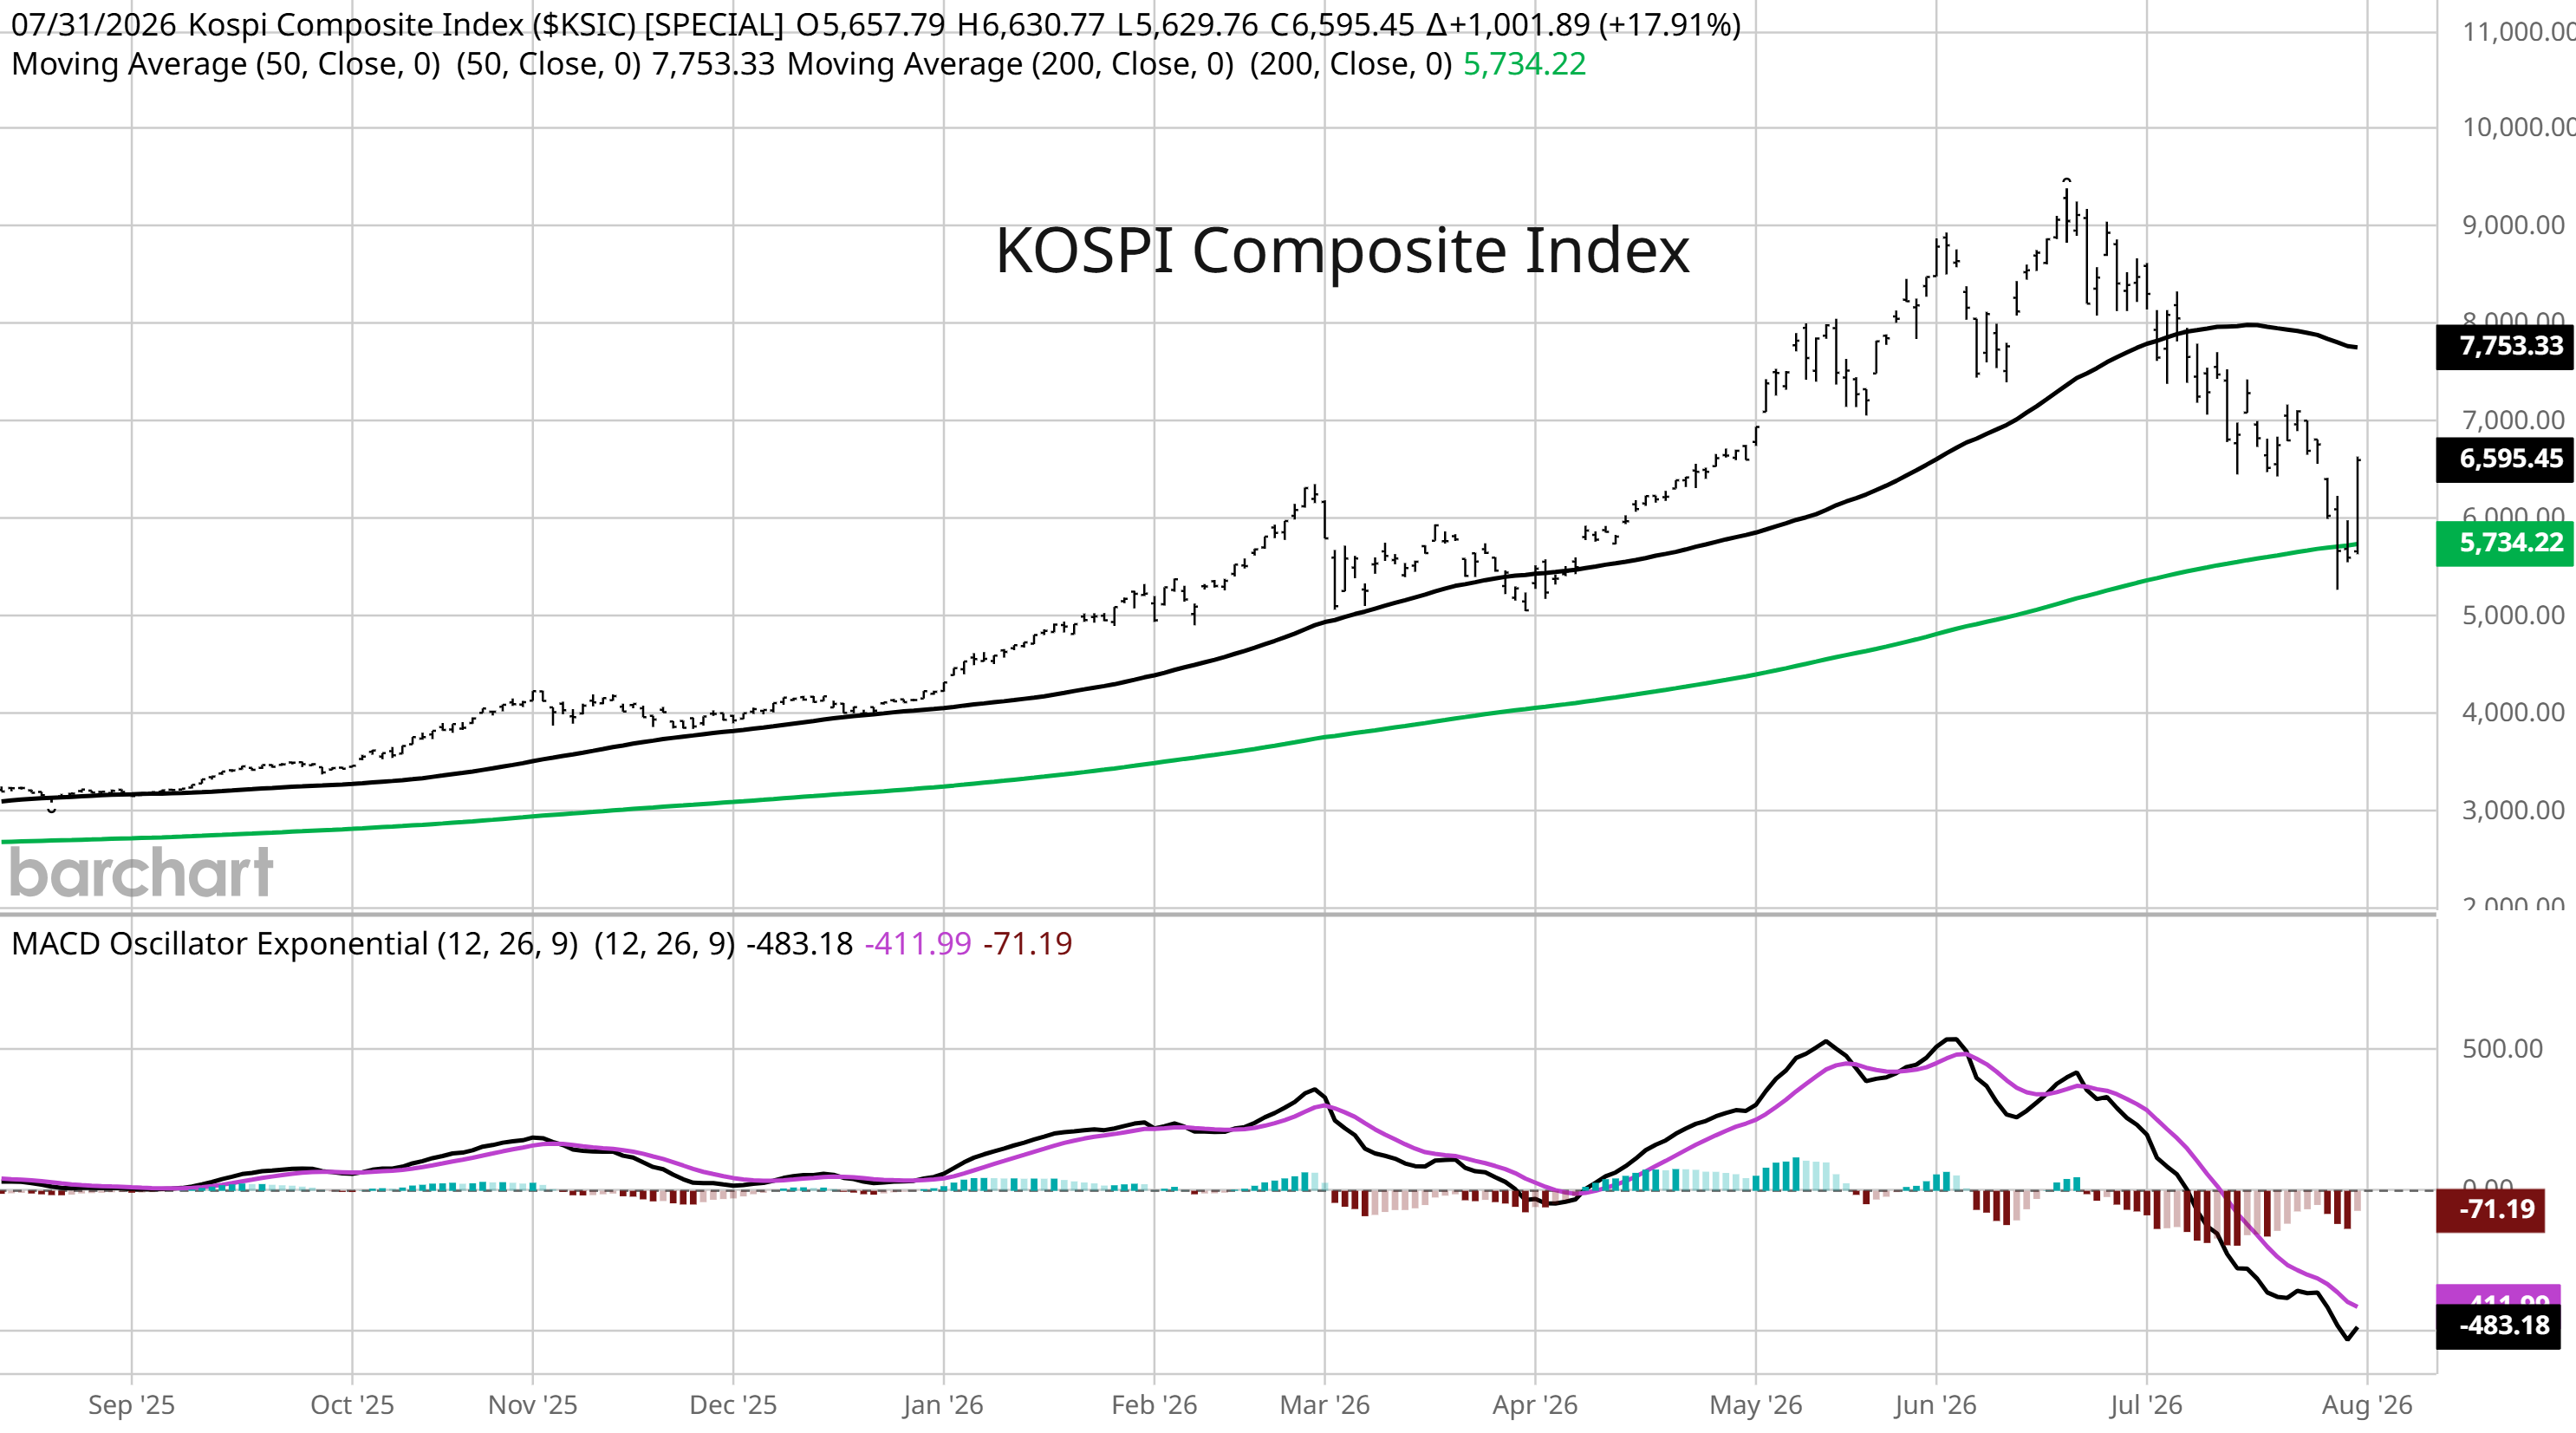
South Korea’s KOSPI Index has become a key barometer for the AI trade, with the Index price action being driven by Samsung and SK Hynix. You can see in the chart below that the KOSPI has fallen by over 35% from the high and is finding support at the 200-day moving average (green line).
At the same time, growth stocks in general are susceptible to the evolving rate outlook following the Federal Reserve’s latest meeting. While the Fed held rates steady as expected, a lack of forward guidance is leaving investors in the dark on the path for monetary policy.
New Fed chair Kevin Warsh saw three dissenting votes against the decision to keep rates unchanged, with several officials preferring to increase rates as inflation pressures build.
That’s the most dissent for a new Fed chair since the early 1970s, while Warsh refused to provide forward guidance on rates while sounding hawkish on developments with inflation.
The lack of direction led to a jump in volatility across asset classes. In the aftermath of the Fed meeting, longer-dated yields jumped while stocks and the U.S. Dollar Index sold off. Warsh’s commitment to revamping how the Fed communicates is leaving investors in the dark.
This week, let’s look at big moves underway in interest rate and currency markets following the Fed meeting, and how that could be playing a role in driving speculative growth stocks lower. We’ll also look at seasonality and the return of bearish headwinds over the next couple of months.
The Chart Report
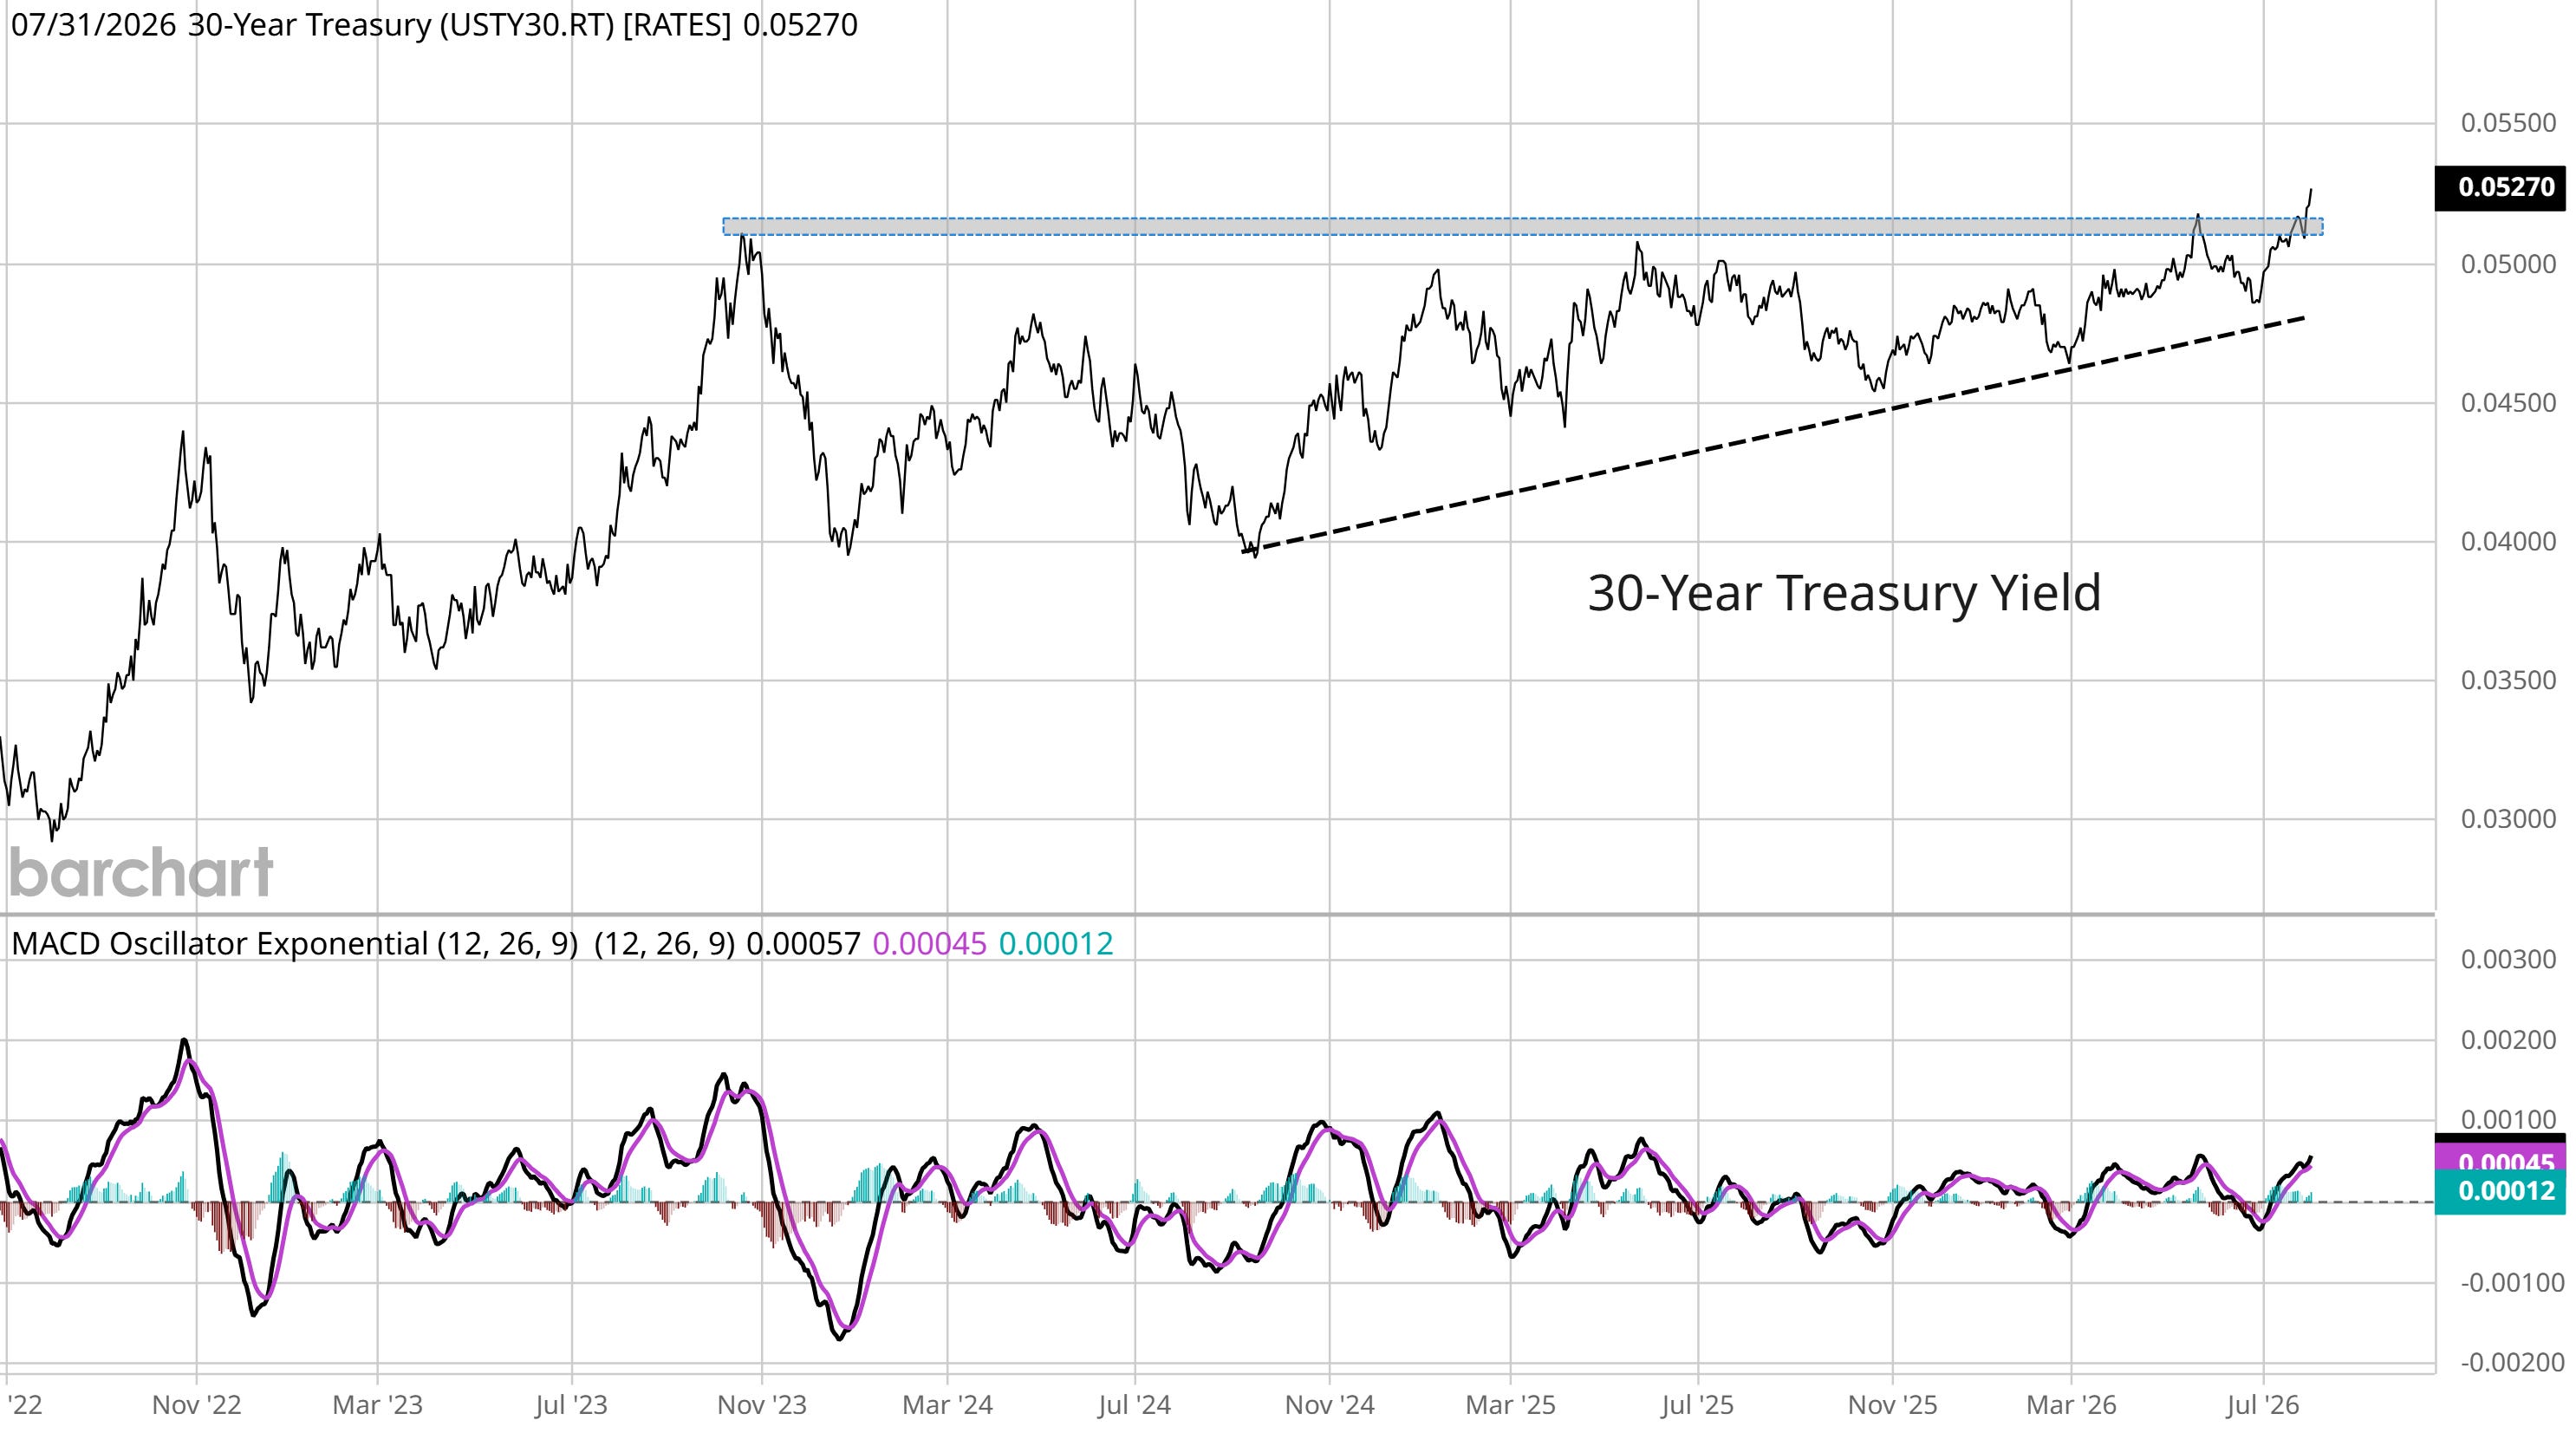
Massive moves are underway across key segments of the capital markets following the latest Fed rate-setting meeting. One of the most impactful moves could be unfolding in Treasury yields. Leading indicators of short-term interest rates continue pointing to rate hikes on the short-end, like with the 2-year Treasury yield that sits at 4.28%. Market-implied odds also point to two quarter-point rate hikes in the next six months. On the long-end, the 30-year Treasury yield is attempting another breakout over the 5% level. Following a failed move above 5% back in May, this time the 30-year rate is holding its move higher and sits at the highest level since 2007.
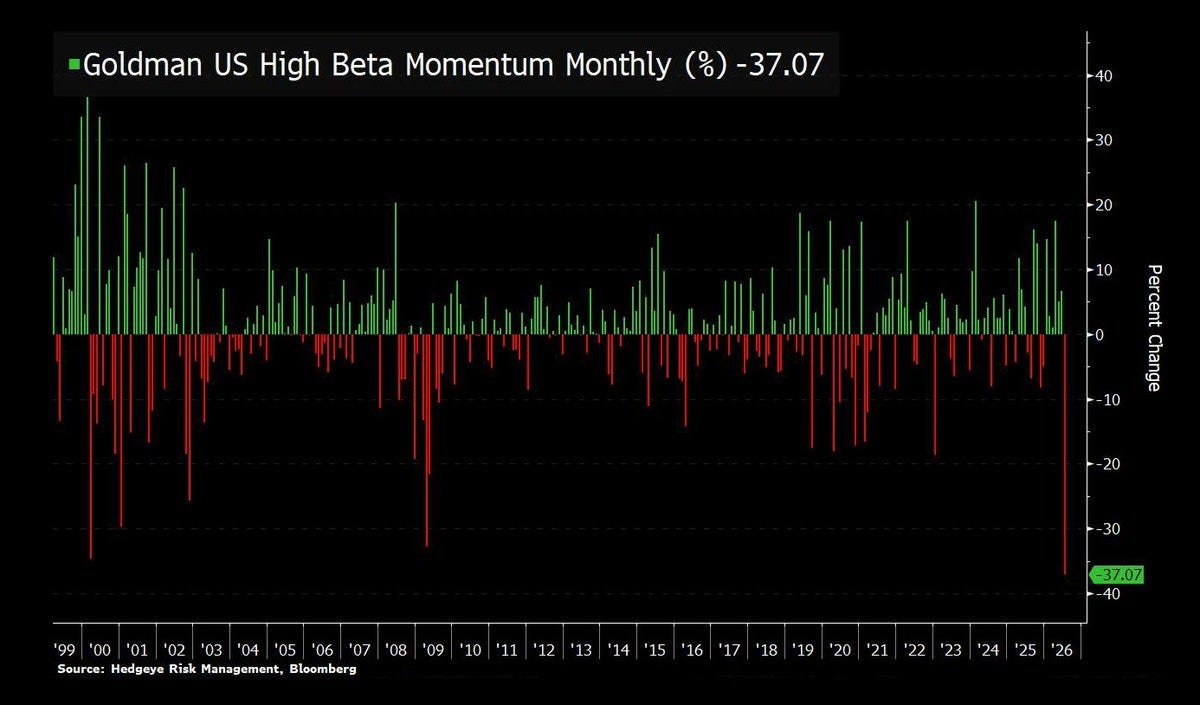
Volatility in the semiconductor sector is sending high beta momentum stocks to one of their worst monthly returns ever. Optimism over AI infrastructure spending helped boost earnings forecasts particularly in the semiconductor sector. That sparked surging share prices across the sector into late June, where a combination of mean-reversion and rate fears are now driving a massive reversal lower. Collectively, a basket of high beta momentum stocks tracked by Goldman Sachs posted its worst monthly performance in history during July (chart below)
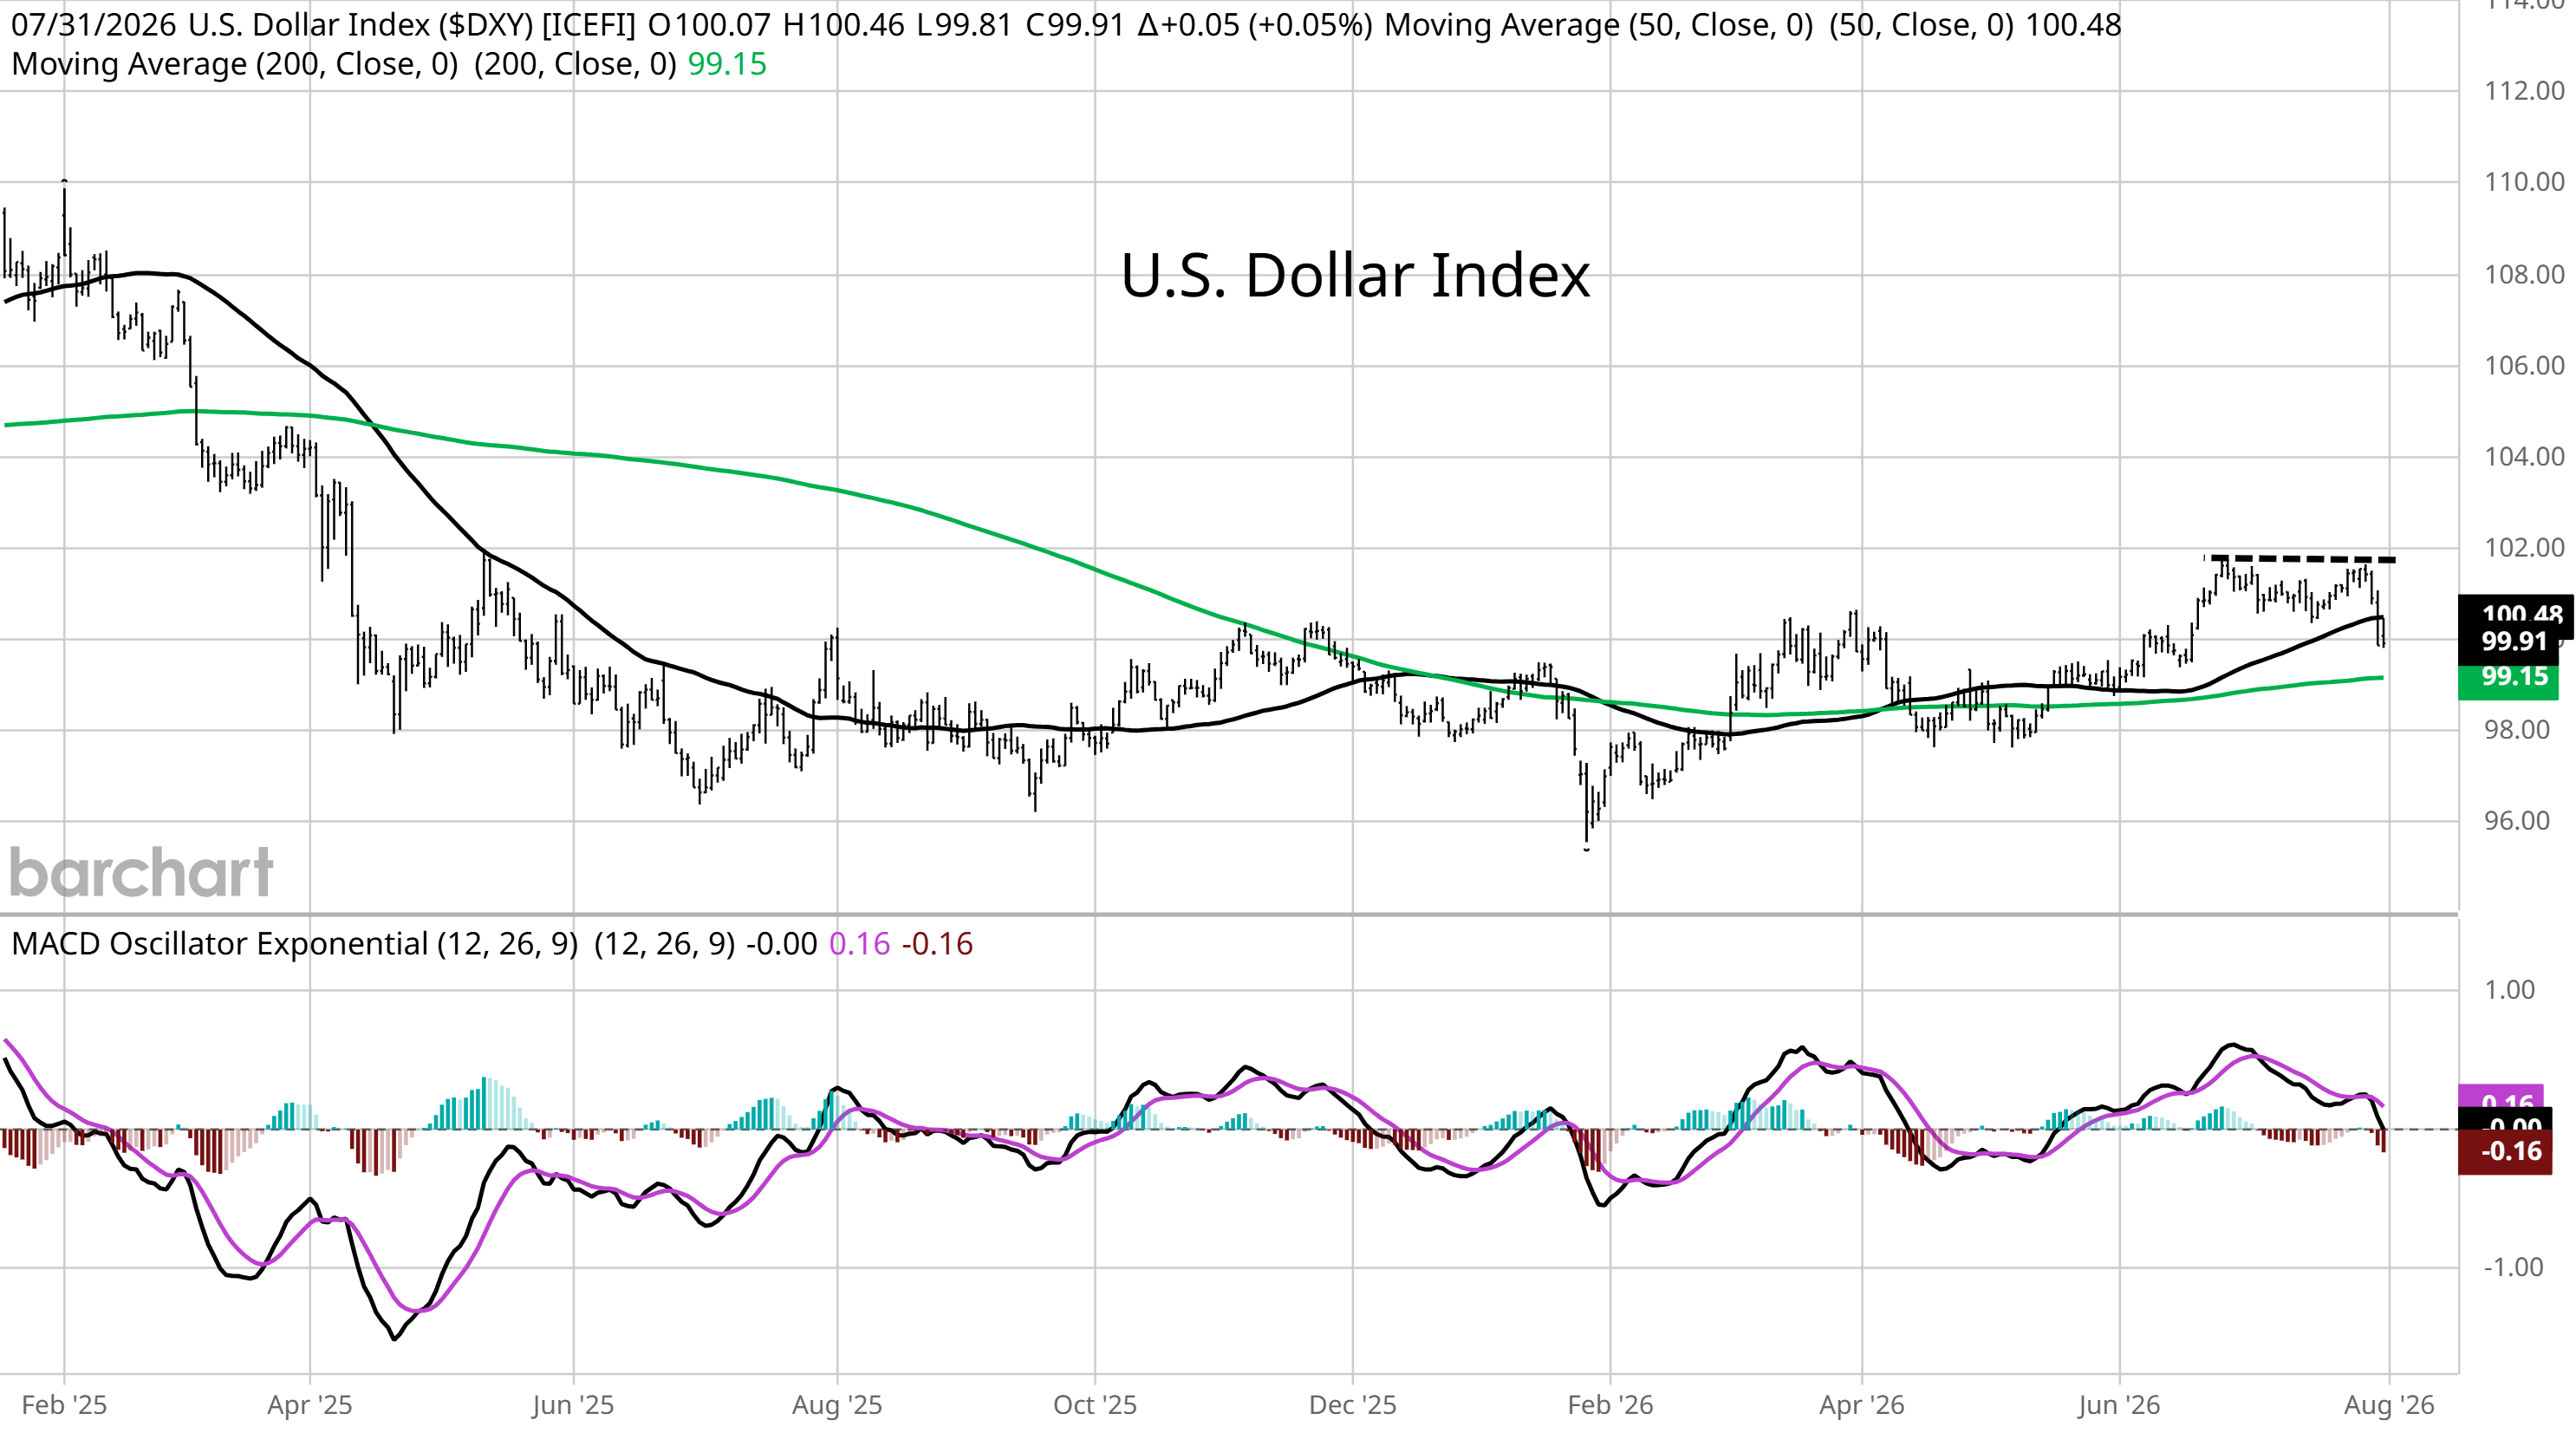
The U.S. Dollar Index is seeing a sharp reversal lower from a double-top pattern after testing resistance near the 102 level in the chart below, and is now losing support at the 50-day moving average (black line). While part of the move is being driven by speculation over intervention to support the yen, the pullback in the dollar has implications for other market sectors. The broader commodities trade is heating up once again, while developed international equities are nearing a breakout from a multi-month basing pattern. Both asset classes could receive a boost from a weaker dollar.
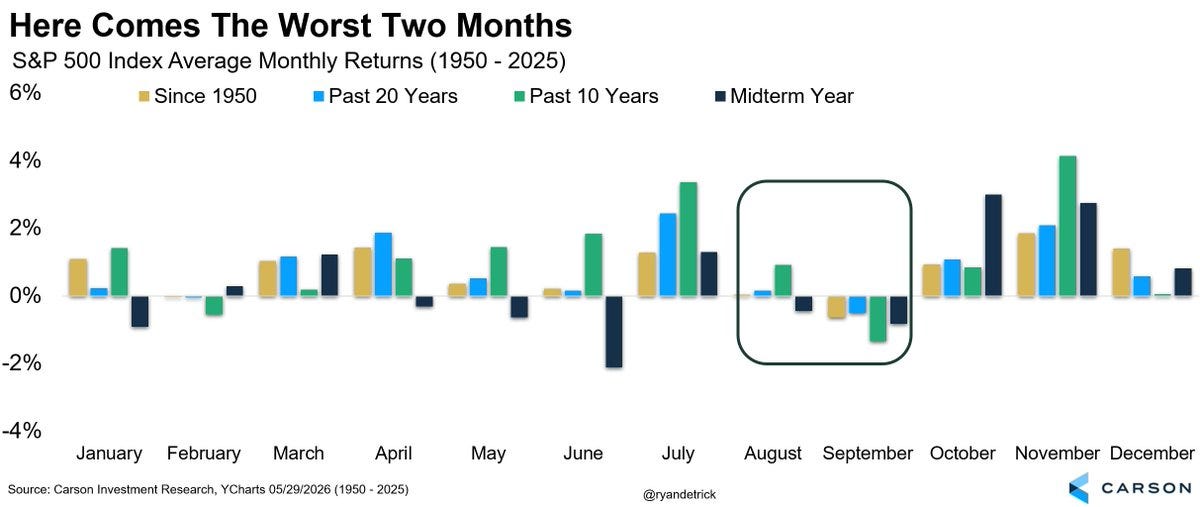
The S&P 500 bucked the historical tendency for the stock market to post strong returns during July, with the index finishing down slightly for the month. Based on multiple lookback periods, seasonality becomes a much stronger headwind over the next couple months. You can see in the chart below that August and September are consistently one of the worst months for average returns over various lookback periods including midterm election years. Seasonal tailwinds pick back up at the start of the fourth quarter.
Heard in the Hub
The Traders Hub features live trade alerts, market update videos, and other educational content for members.
Here’s a quick recap of recent alerts, market updates, and educational posts:
A pattern to tip the S&P 500’s next move.
How we’re surviving the momentum massacre.
Why return dispersion is signaling a major transition.
How to use relative strength to find new momentum leaders.
Breaking down two chart patterns emerging in new trade ideas.
You can follow everything we’re trading and tracking by becoming a member of the Traders Hub.
By becoming a member, you will unlock all market updates and trade alerts reserved exclusively for members.
Trade Idea
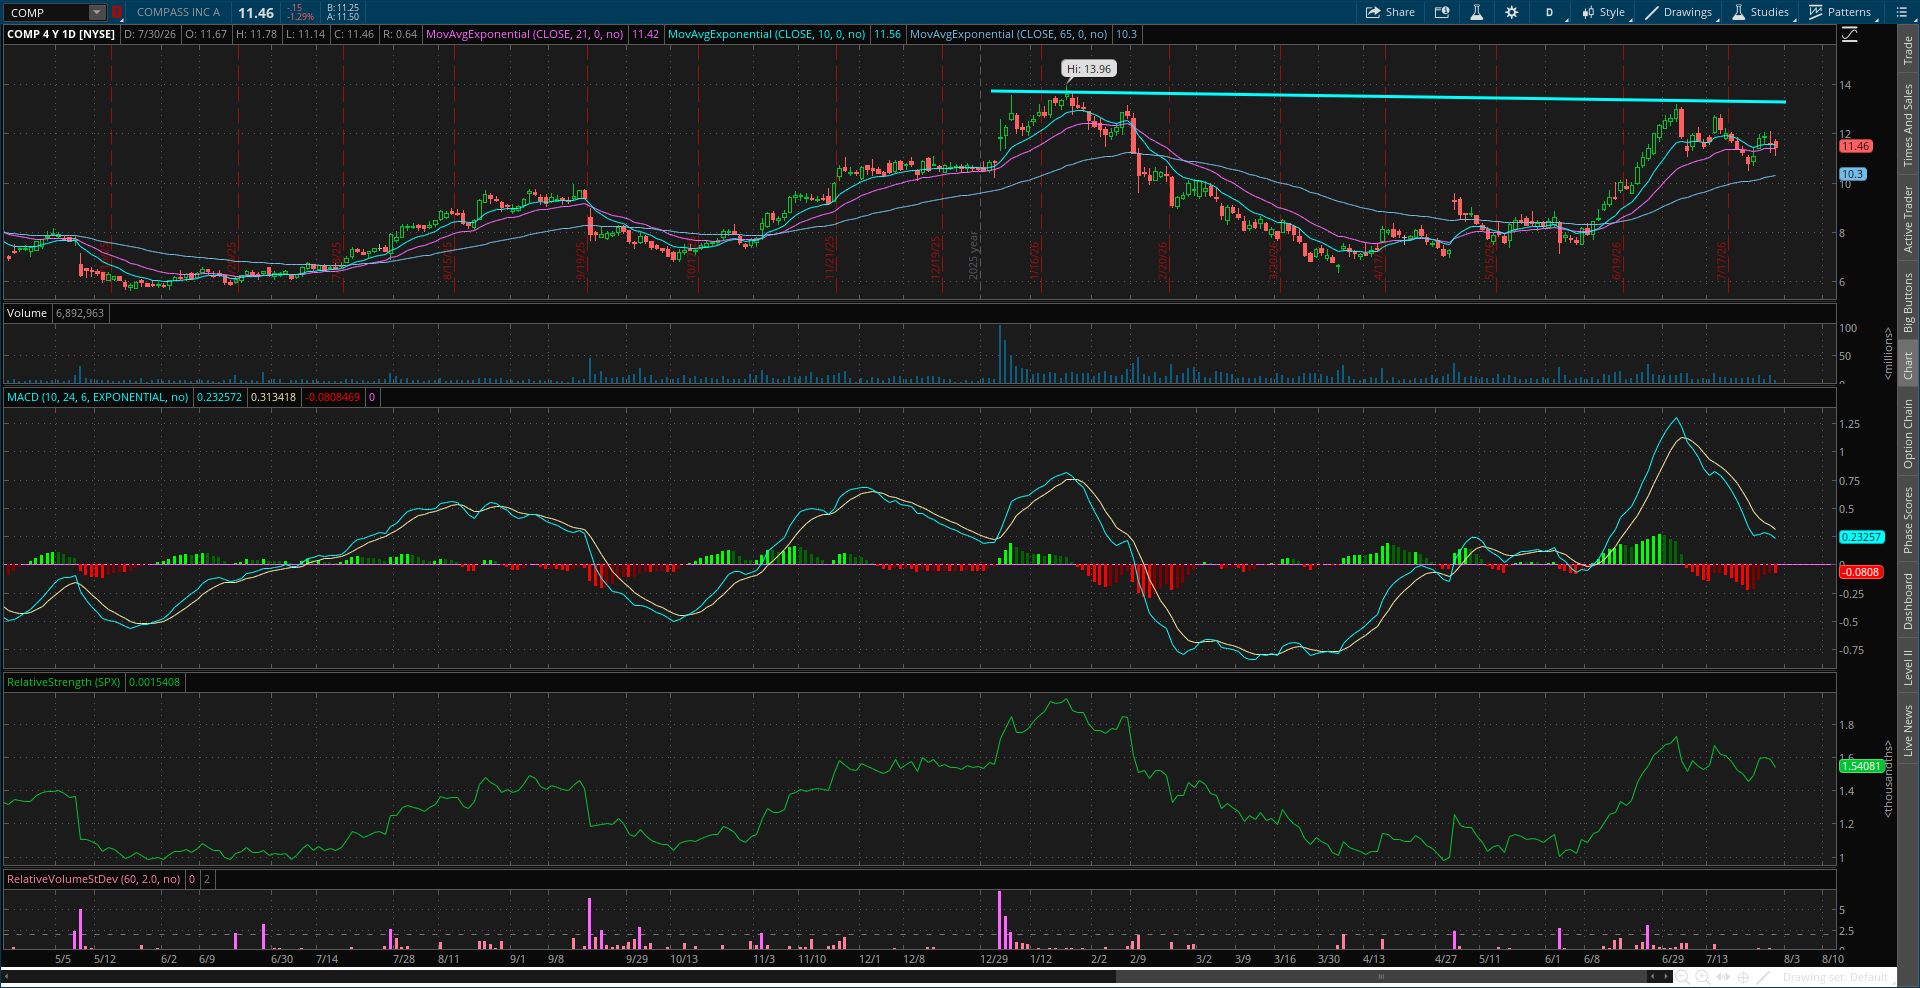
Compass Inc (COMP)
The stock is forming a cup with handle basing pattern since February. The handle area is resetting the MACD above the zero line. I’m watching for a move to new highs above the $14 level.
Key Upcoming Data
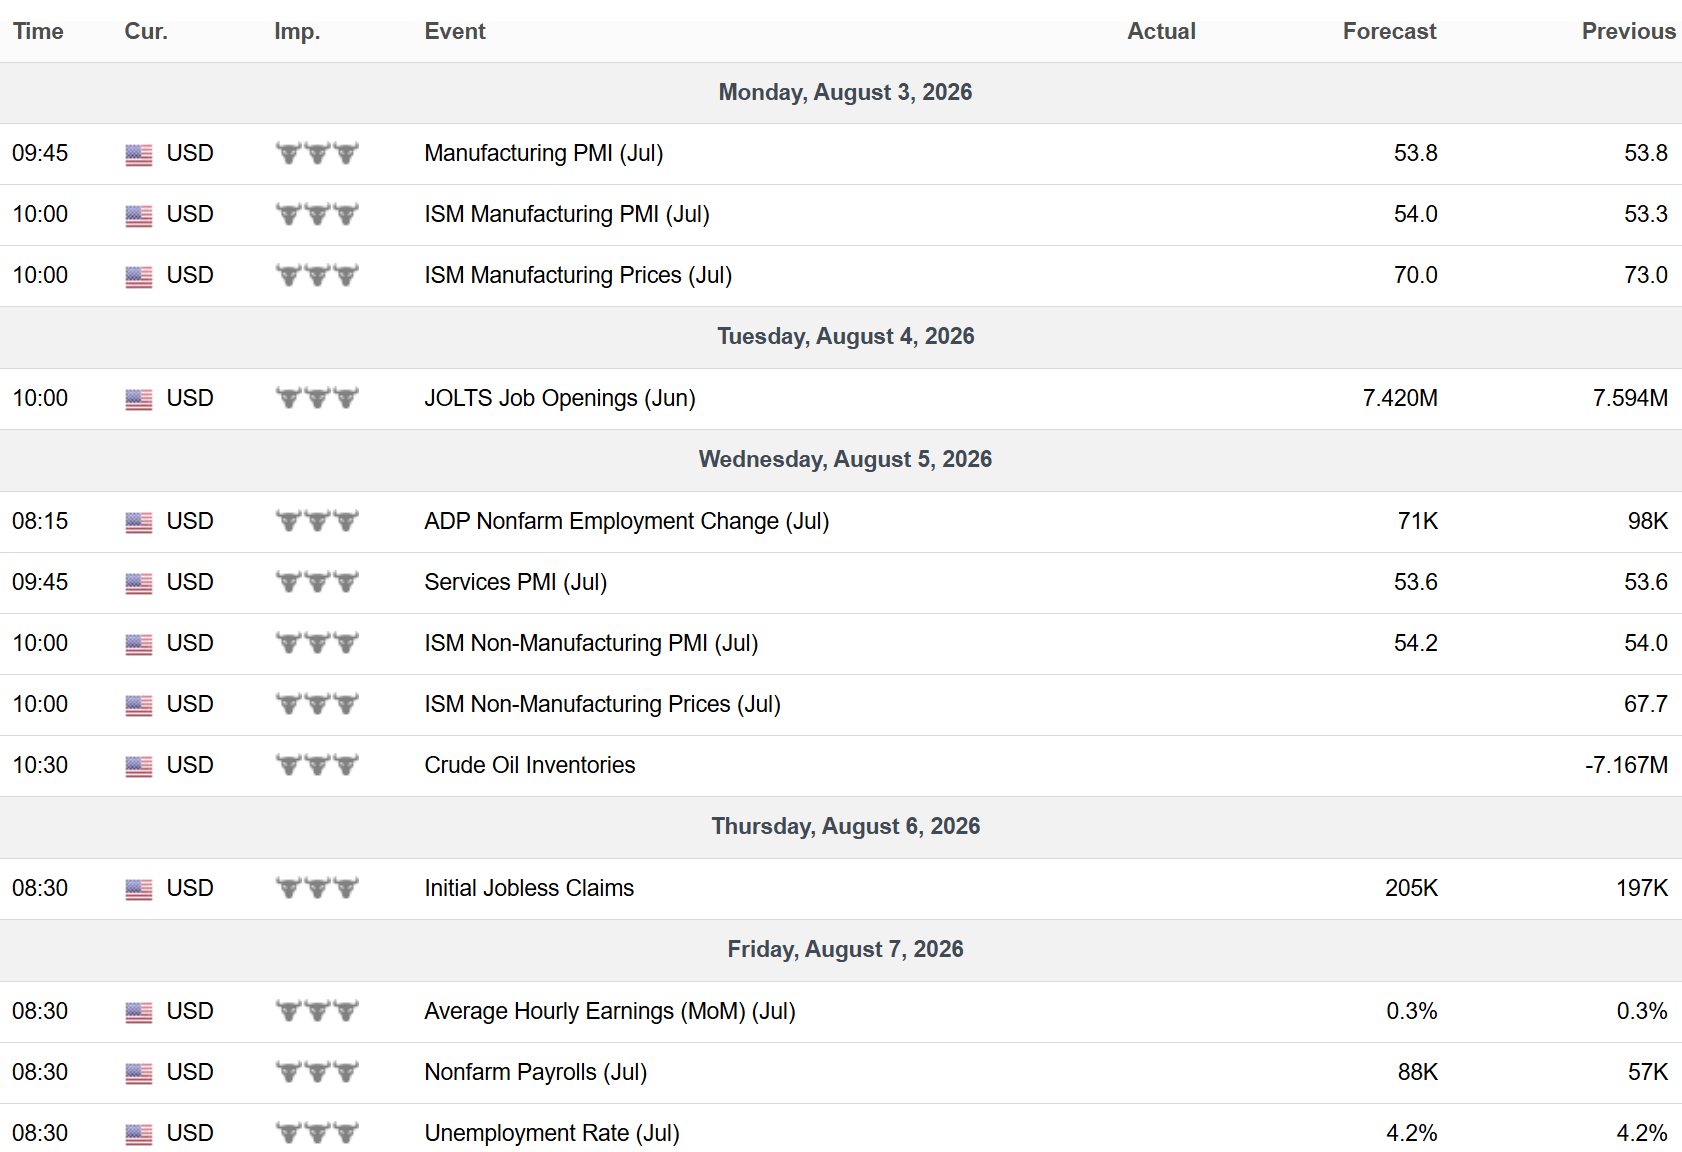
Economic Reports
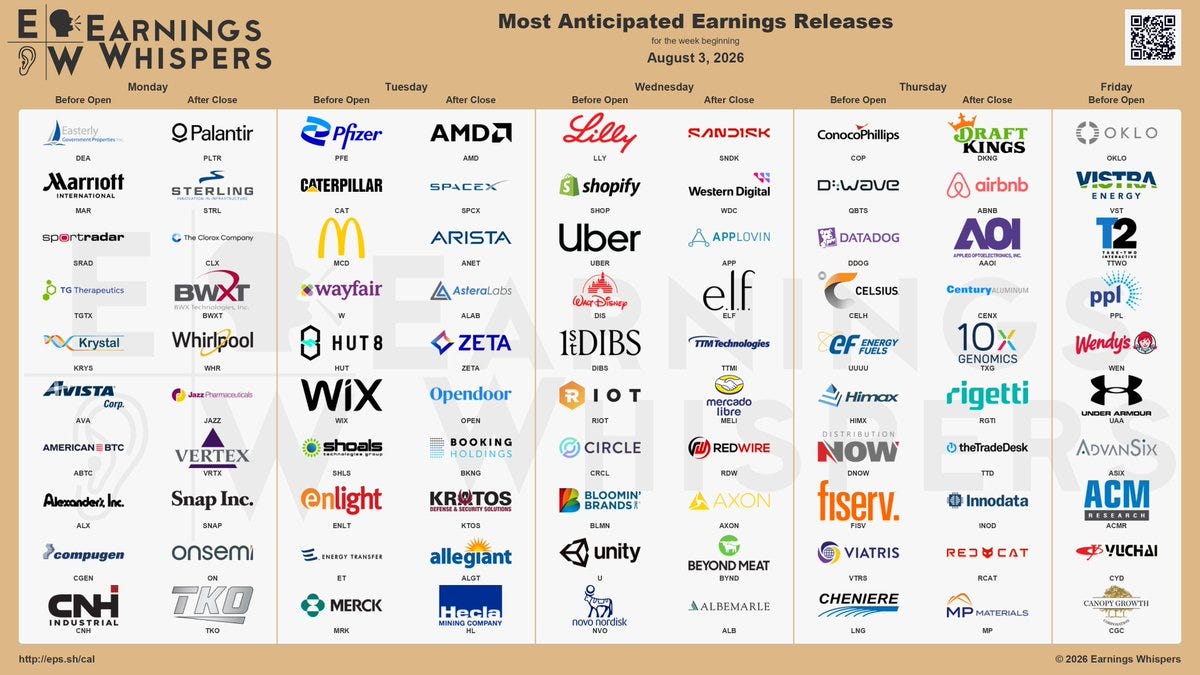
Earnings Reports
I hope you’ve enjoyed The Market Mosaic, and please share this report with your family, friends, coworkers…or anyone that would benefit from an objective look at the stock market.
Become a member of the Traders Hub to unlock access to:
✅Model Portfolio
✅Members Only Chat
✅Trade Ideas & Live Alerts
✅Mosaic Vision Market Updates + More
Our model portfolio is built using a “core and explore” approach, including a Stock Trading Portfolio and ETF Investment Portfolio.
Come join us over at the Hub as we seek to capitalize on stocks and ETFs that are breaking out!
And if you have any questions or feedback, feel free to shoot me an email at mosaicassetco@gmail.com
Disclaimer: these are not recommendations and just my thoughts and opinions…do your own due diligence! I may hold a position in the securities mentioned in this report.