The Market Mosaic 8.20.23
S&P 500: Ready to rally?
Welcome back to The Market Mosaic, where I gauge the stock market’s next move by looking at macro, technicals, and market internals. I’ll also highlight trade ideas using this analysis.
If you find this content helpful please hit that “like” button, share this post, and become a subscriber to this always free report if you haven’t already done so!
And be sure to check out Mosaic Chart Alerts. It’s a midweek update covering chart setups among long and short trade ideas in the stock market, along with levels I’m watching.
Now for this week’s issue…
Despite featuring little by way of key economic releases, news on the macro front was awfully gloomy this week.
Issues surrounding China’s construction and commercial real estate industry are emerging once again with property-giant Evergrande filing for bankruptcy protection. Another large China-based investment firm missed payments to investors.
Those events are leading to fears that a Chinese property market bust could cascade through the global financial markets. One headline even described it as China’s “Lehman moment”.
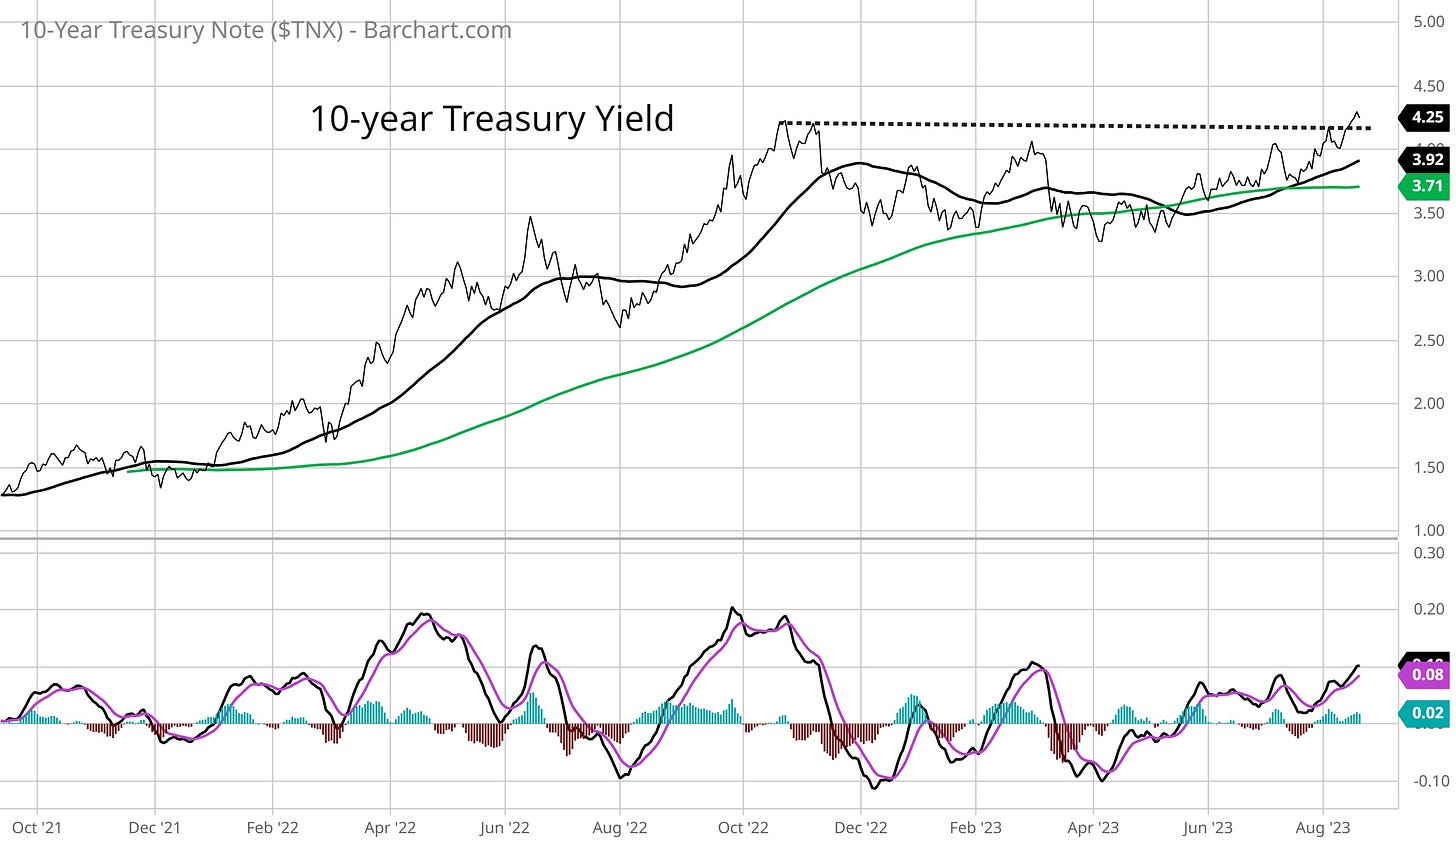
But perhaps the biggest variable impacting domestic stock prices is the relentless march higher in longer-dated interest rates. The 10-year Treasury yield is breaking over a key resistance level around 4.2% that has held since last October as you can see in the chart below.
The 10-year yield has gained for five weeks straight, which helped send the S&P 500 lower by 2.1% for its third consecutive weekly loss. That move now has the S&P over 5% below this year’s peak made in late July while also cutting through support at the 50-day moving average (MA - black line) as you can see below.
And as rising rates pressure stock valuations, it’s the speculative growth space that’s getting hit especially hard. The IWO small-cap growth ETF was showing a positive change in risk sentiment with a breakout from the triangle pattern below. But that failed with price falling back into the pattern and testing the 200-day MA as you can see below.
But amidst the gloomy headlines and poor price action, positive signs are aligning that the selloff could be nearing its conclusion. And at the same time, a new group of stock market leaders are emerging.
Signs of Selling Exhaustion
I argued last week that this remains a bull market. But even in the strongest uptrends, stocks need to catch their breath by pulling back and consolidating gains.
In fact, the S&P 500 has averaged three 5% pullbacks every year since 1950. So don’t read too much into the recent drop just yet.
If anything, positive signs are emerging that the selloff could be nearing its end, especially as the intersection of breadth and sentiment shows oversold readings along with a sharp drop in bullishness.
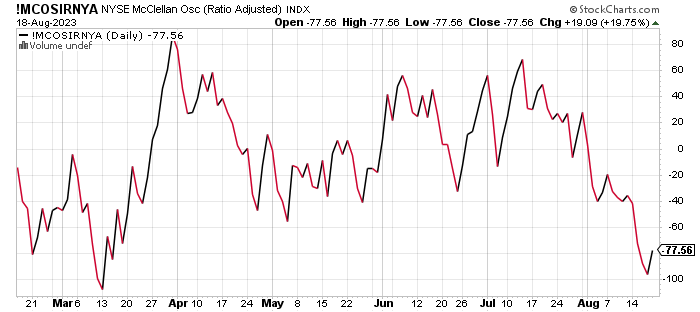
On the breadth side, I recently highlighted three variables to monitor for oversold conditions. One of those metrics is with the McClellan Oscillator. This gauge looks at the number of advancing versus declining issues on the NYSE over a trailing period. You want to monitor for extreme readings and divergences at those extremes.
Last week, the oscillator hit a level near historical lows while also possibly developing a positive divergence. On Friday, the oscillator improved from an extremely negative level while the S&P 500 went on to make a new low. That shows some improvement under the stock market’s hood.
The percent of stocks trading above their 20-day MA is also nearing extremely oversold levels, which is now at 22% as shown with the arrow in the chart below. This metric has declined further than I anticipated, but is nearing levels that have marked the end of prior pullbacks off the October lows.
And with the drop in stocks, excessive bullish investor sentiment is clearing out quickly. I posted here about the sharp drop in bulls from the AAII’s most recent survey on retail investors. CNN’s Fear and Greed Index also shows bullish sentiment quickly retreating, with the index now nearing “fear” territory in the chart below.
Finally, I also want to note that the late July to late August period features weak seasonality based on 20-year trends in the S&P 500. But as you can see in the chart below, we’re now coming up on a period of positive seasonality that has historically persisted over the coming month.
I would never make trading decisions based solely on seasonal data. But the combination of oversold breadth, increasingly bearish sentiment, and upcoming positive historical trends should have your attention. Now’s the time to be updating your watchlist with stocks showing relative strength and creating breakout setups with their chart patterns.
Now What…
While the conditions discussed above are aligning to support a rally, I will ultimately let price be my guide. To that end, I’m watching a new batch of stocks showing relative strength and creating breakout patterns.
And many of my setups share a similar characteristic: they belong to cyclical industries. Perhaps the cumulative impact of various fiscal spending packages that I previously outlined is now showing up in measures of economic activity.
After all, you’ve seen the Atlanta Fed’s estimate of Q3 GDP starting to jump through the roof. Take it with a grain of salt since there are more data points to be collected into the estimate, but the trend is worth noting as you can see below.
If an improving growth outlook is driving an increase in longer-dated yields like the 10-year Treasury, then that could be a good thing for the earnings outlook and cyclical stock prices.
That’s what makes the setup in sectors like energy and steel so compelling at the moment. Broadly speaking, many stocks in these sectors had a great run in 2022 but have been laggards during the first half of this year while growth and technology stocks led the way.
That could be changing for the second half of 2023 if chart patterns play out. The SLX steel ETF below is an example of the type of pattern playing out across numerous cyclical stocks. Price recently tested the prior high and is making a smaller pullback just under resistance. A breakout to new highs could point to new leadership in the stock market during the second half of 2023.
That’s all for this week. Next week’s main event will feature Federal Reserve chair Jerome Powell’s speech at the Jackson Hole symposium, which could provide clues on Fed policy shifts going forward. Regardless of any surprises in his speech, I’ll still be watching for signs of improving breadth under the stock market’s hood to signal the rally can resume.
I hope you’ve enjoyed The Market Mosaic, and please share this report with your family, friends, coworkers…or anyone that would benefit from an objective look at the stock market.
And make sure you never miss an edition by subscribing here:
For updated charts, market analysis, and other trade ideas, give me a follow on Twitter: @mosaicassetco
And if you have any questions or feedback, feel free to shoot me an email at mosaicassetco@gmail.com
Disclaimer: these are not recommendations and just my thoughts and opinions…do your own due diligence! I may hold a position in the securities mentioned in this report.


