The Market Mosaic 8.18.24
S&P 500: Will stocks retest the lows?
Welcome back to The Market Mosaic, where I gauge the stock market’s next move by looking at macro, technicals, and market internals. I’ll also highlight trade ideas using this analysis.
If you find this content helpful please hit that “like” button, share this post, and become a subscriber if you haven’t already done so!
And be sure to check out Mosaic Chart Alerts. It’s a midweek update covering chart setups among long and short trade ideas in the stock market, along with levels I’m watching.
Now for this week’s issue…
Just as quickly as volatility and unraveling stock prices arrived, a sense of calm is permeating through global capital markets.
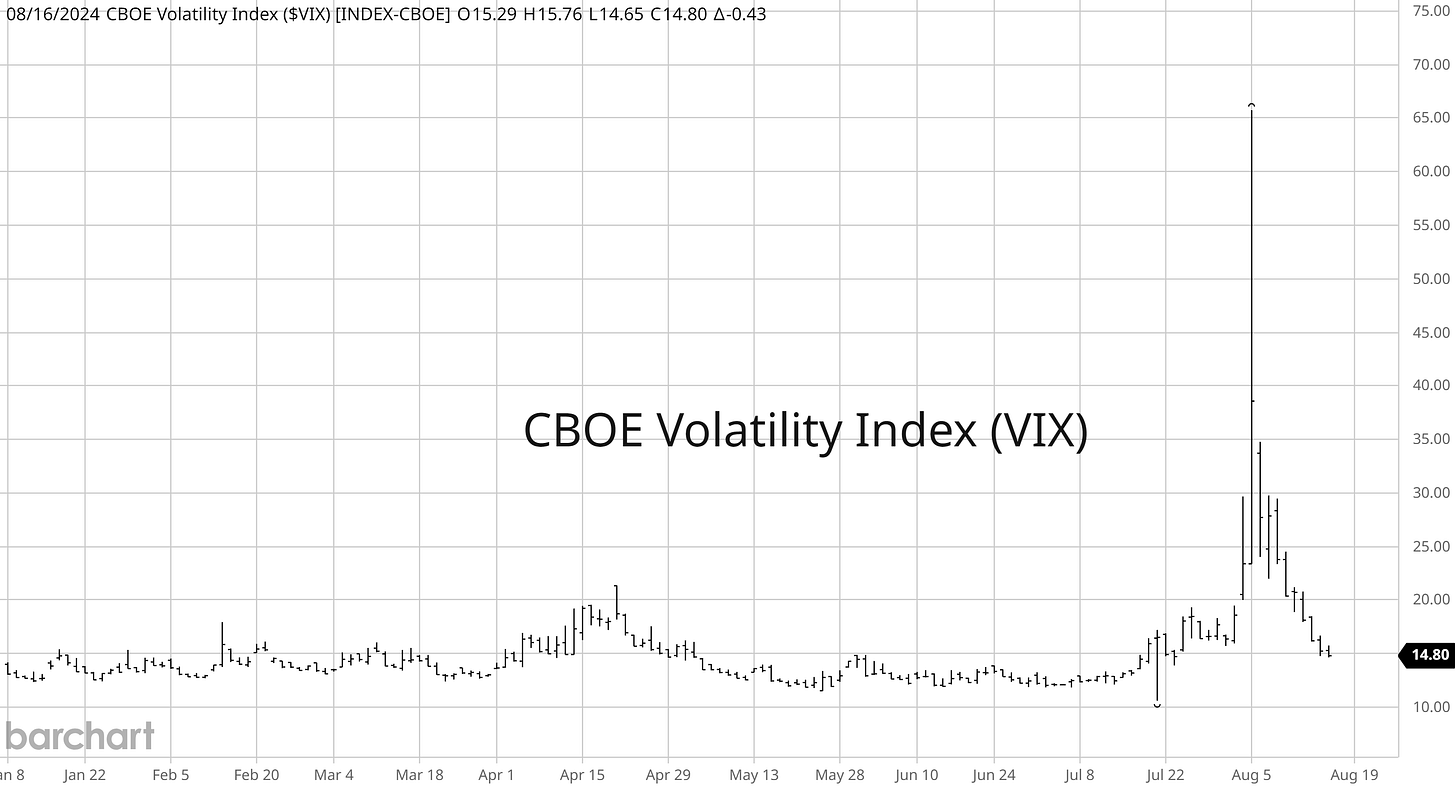
The CBOE Volatility Index (VIX) jumped to its third highest level in history on August 5, with an 172% gain in just three days.
But the subsequent unwind of volatility levels has been even more historic. After hitting an intraday high of 66 on August 5, the VIX is collapsing and went on to post the largest four-day decline in history (VIX chart below).
Fears over an unwinding Japanese yen carry trade and forced selling by volatility-targeting strategies served as the catalyst for the selloff and vol spike. But those fears are fading as a pair of inflation reports solidifies expectations for a new rate-cutting cycle.
The Producer Price Index (PPI) rose 2.2% in July compared to last year. That came in below expectations, and was a sharp drop from June’s 2.7% pace. The more closely watched Consumer Price Index (CPI) increased by 2.9% compared to last year, which matched economist estimates for July’s figure.
While the core CPI that strips out food and energy rose by 3.2%, it’s the smallest increase since May 2021 and continues a trend of disinflation in the core CPI. The chart below shows the year-over-year change in core measures for both PPI (blue line) and CPI (red line).
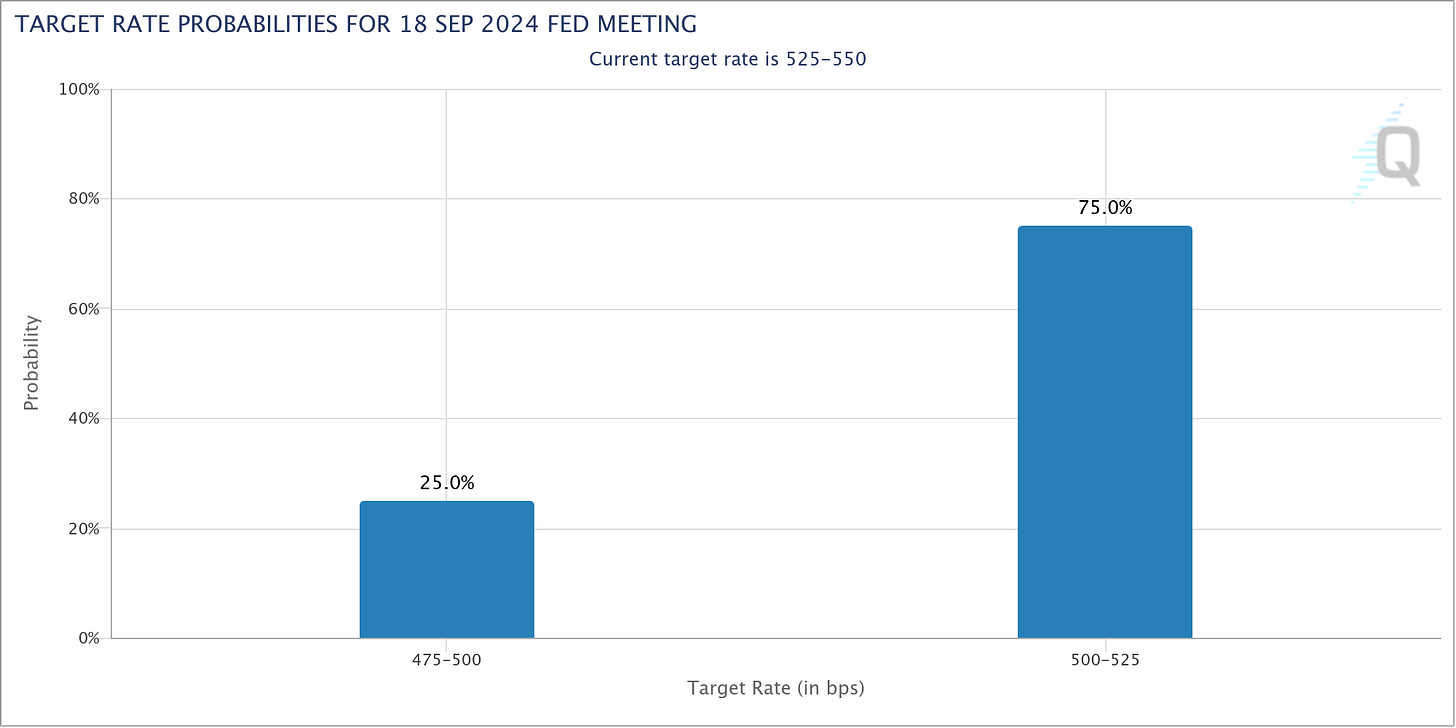
Following those inflation reports, markets are pricing a 100% chance of a rate cut at the Federal Reserve’s September meeting. The only question now is if the Fed will cut by 0.25% or target a larger reduction of 0.50%. Odds point to a 25% chance of a larger half-point cut as you can see below.
Stocks surged as vol levels plummeted and inflation reports didn’t derail hopes for a rate cut. As of Friday, the S&P 500 has been higher six days in a row and posted its best week of 2024 with a 3.9% gain.
But is the stock market truly out of the woods yet? After all, history shows that “dead cat bounces” are common following a dramatic and emotional selloff like we had into early August.
There are reasons to view the recent rally with suspicion. Here are three catalysts why the S&P 500 could come back to test the August 5 lows before the bull market trend can resume.
S&P 500: Retest of the Lows Likely
I’ve argued in recent reports that the surge in volatility levels and sharp pullback in stock indexes around the world was more technical and driven by positioning unwinds (like the yen carry trade and risk-targeting funds). That ran counter to other views that an impending economic crisis was in the works.
I also highlighted conditions that could support a rally off the August 5 lows. Along with signs of capitulation, I discussed last week how extremely oversold breadth metrics were supportive of a rally.
It’s tempting to view the recent rally as an “all clear” signal that the uptrend is ready to resume. But for right now, my base case scenario is that a retest of the August 5 lows is the most likely near-term path for the S&P 500.
One reason comes down to precedent. Over the past decade, volatility markets have seen similar expansion on two other occasions in a non-recessionary environment.
That includes a selloff into August 2015 and February 2018. In both instances, the S&P 500 rallied as conditions among breadth indicators supported a bounce. But eventually, the index rolled over to retest the lows. Last week, I shared a chart of the 2018 retest of the lows that you can view here.
The S&P 500 also saw something similar in 2015. That episode even features a July top in the market with a decline into August that sent VIX higher by 249% in just three days. After the initial low, the S&P 500 rallied over the next several weeks before declining to test the lows in late September (circles in the chart below).
Upcoming seasonality also supports weak equity markets and a retest of the lows. The stock market has a long history of experiencing weak seasonality during the month of September.
That’s especially been the case over the past decade as you can see in the table below. September is a clear standout as being the worst month based on average and median returns over the past 10 years, while the S&P 500 is currently on a stretch of four consecutive years with a negative September return as you can see below.
Uncertainty heading into November’s election also supports a volatile trading environment over the next couple months, while several measures of investor sentiment are not yet pointing to extreme bearishness that tends to support a bottom.
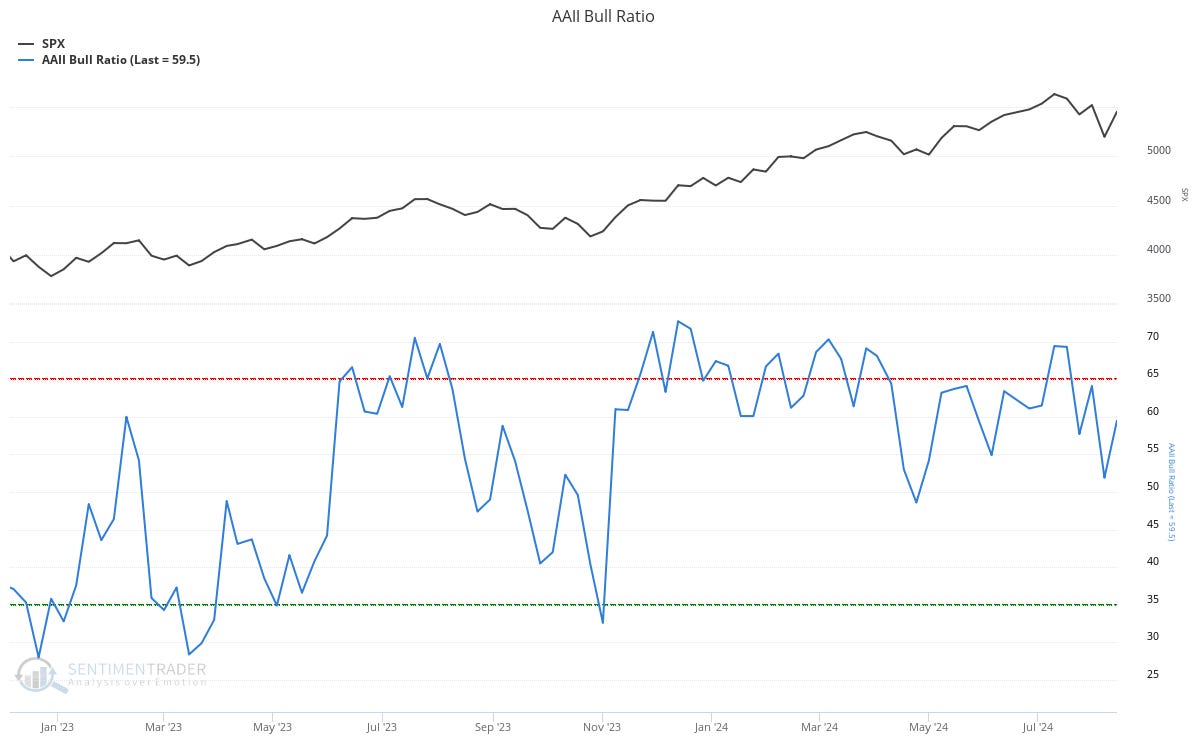
I shared last week how CNN’s Fear & Greed Index was showing “extreme fear”. But you’re not seeing that echoed in other measures of investor sentiment. In the AAII survey of retail investors, the ratio of bullish investors among bulls and bears combined is still running at elevated levels (chart below).
During bottoms on pullbacks going back to the start of 2023, you can see the ratio of bulls is much lower (green dashed line) than current levels.
Based on historic precedents of past VIX spikes, incoming poor seasonality, and evidence that the selloff hasn’t turned enough investors bearish, I believe a retest of the August 5 low is a real possibility. But even if that scenario does play out, I’m still ultimately expecting new highs for the S&P 500 looking later into the year.
Now What…
While my base case scenario is for a retest of the August 5 lows, that doesn’t mean I’m turning bearish on the overall outlook for the economy and stock market.
Longer-term, I still believe there are three major catalysts in place to drive the bull market over the next 12 to 18 months. That includes a strong economy supporting earnings growth, an accelerating liquidity cycle, and positive decade seasonal patterns which I outlined in a report here.
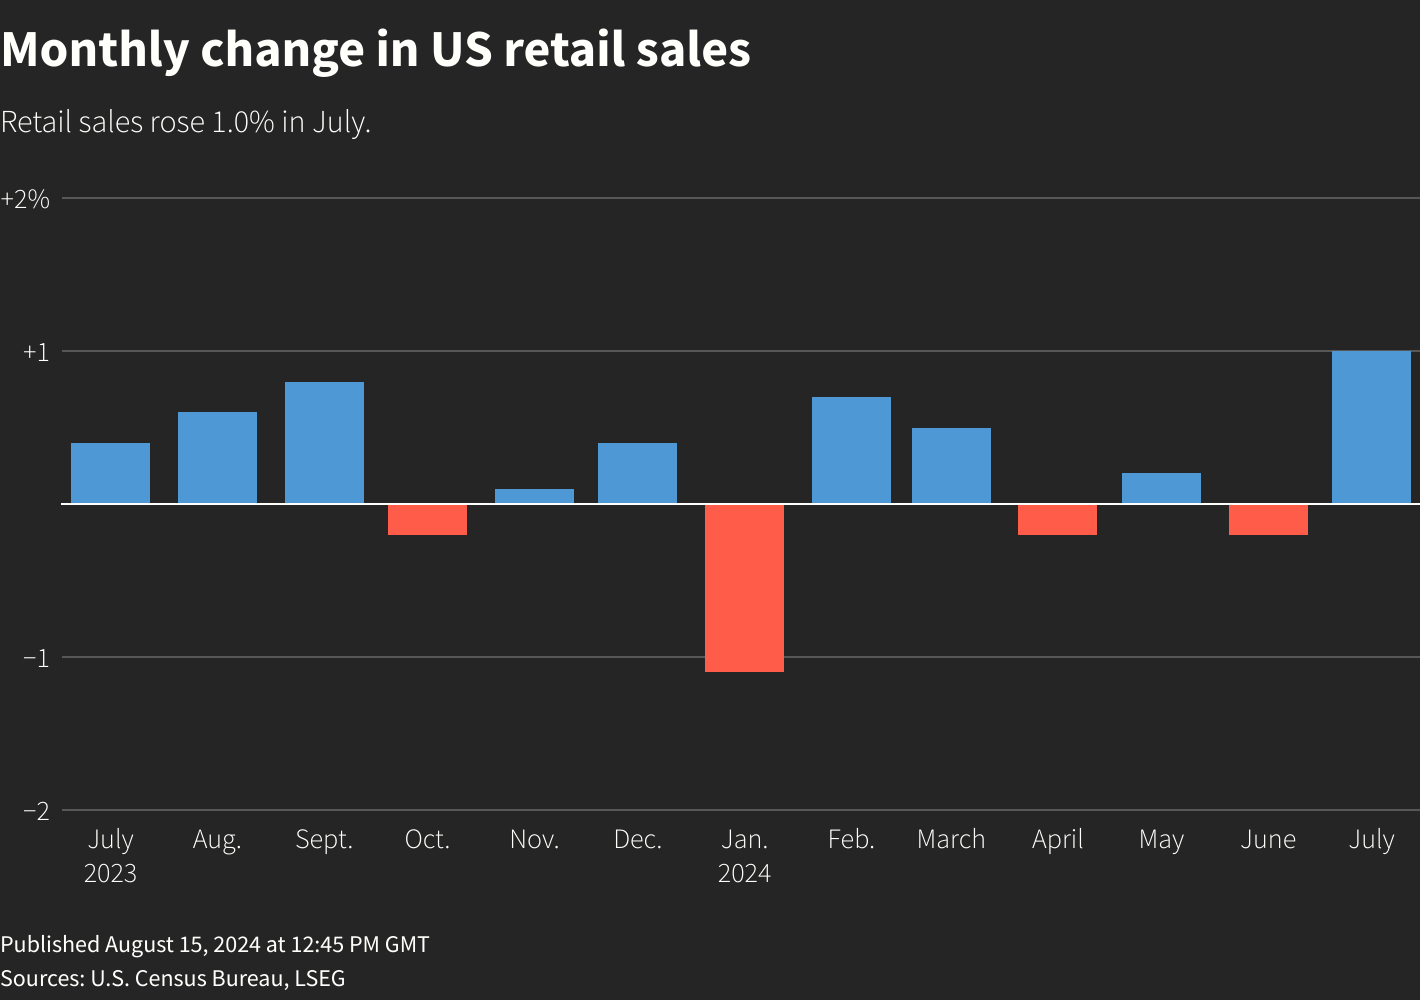
And for all the fuss around the move higher in the unemployment rate, recent economic data is holding up well. Jobless claims have fallen for two weeks in a row, while last week’s retail sales report for the month of July showed a gain of 1.0% (chart below). That was the largest monthly gain in over a year.
Retail giant Walmart (WMT) is also confirming that everything is okay with the consumer, stating in last week’s earnings release that “importantly, we don't see any additional fraying of consumer health.”
I’m also encouraged by the recent price action in cyclical sectors. I’m a firm believer that the stock market is a discounting mechanism for future corporate earnings and business conditions, and that cyclical sectors most leveraged to the economy will provide an early warning signal if the outlook is deteriorating.
The good news is that key cyclical sectors are bouncing off price support or trendline levels, with uptrends staying intact. That includes stocks in the housing sector. Just take a look at the chart of PulteGroup (PHM). The stock is back testing the most recent breakout shown with the dashed trendline, maintaining the overall uptrend (chart below).
Other areas like banks, small-caps, high yield bonds, and industrials are all holding up against the selloff in the major indexes. And even though I expect a choppy trading environment over the next couple of months, I’m still taking long trade setups that meet my criteria for sound basing patterns coupled with strong growth fundamentals.
Pullbacks and corrections in the stock market are a gift in one sense. That’s because you can quickly find relative strength and leadership with stocks breaking out to new 52-week highs (or to new all-time highs are even better).
I’ve previously shared strong setups in this report and Mosaic Chart Alerts that are holding their breakouts, including names like MELI and RACE. I’m also watching the action develop in CyberArk Software (CYBR).
The stock is trading sideways since February while testing resistance at the $280 level on three occasions. Price is now back near the $280 level, where I would like to see one more smaller pullback and MACD “hook” to reset at the zero line before breaking out. The relative strength line is also holding near the high.
That’s all for this week. The coming week will be light on economic reports, but the attention will turn to Fed Chair Jerome Powell and his Friday speech at Jackson Hole. Powell could use the opportunity to set the table for a rate cutting cycle. While there will be plenty of headlines around the potential path of monetary policy, I’m keeping an eye for clues that the relief rally is running out of steam.
I hope you’ve enjoyed The Market Mosaic, and please share this report with your family, friends, coworkers…or anyone that would benefit from an objective look at the stock market.
And make sure you never miss an edition by subscribing here:
For updated charts, market analysis, and other trade ideas, give me a follow on X: @mosaicassetco
And if you have any questions or feedback, feel free to shoot me an email at mosaicassetco@gmail.com
Disclaimer: these are not recommendations and just my thoughts and opinions…do your own due diligence! I may hold a position in the securities mentioned in this report.


Your writing not only has depth, but clarity.
I haven't read anyone else mention a possible second leg down. I'm also bullish but will set my trailing stops in case of fire. Thanks.