
The Market Mosaic 8.17.25
Can the Fed afford to slash interest rates?

👋Welcome back to The Market Mosaic, where I gauge the stock market’s next move by looking at macro, technicals, and market internals. I’ll also highlight trade ideas using this analysis.
If you find this report helpful please hit that “like” button, share this post, and become a subscriber if you haven’t already done so!
🚨And be sure to check out Mosaic Traders Hub. It’s a members-only platform to alert trade ideas, track a model portfolio of open positions, and further analyze the message coming from the capital markets (👇be sure to check out our special offer below).
Now for this week’s issue…
Investors were dealt bad news on the inflation front across both consumer and producer measures.
The Consumer Price Index (CPI) came out first and increased by 2.7% compared to last year, which was in line with estimates and matched June’s pace. But the core figure that excludes food and energy prices rose by 3.1% which was slightly higher than estimates.
That also marks the second consecutive month where the core measure is seeing a faster rate of change. But the Producer Price Index (PPI) is running even hotter.
The PPI gained 3.3% in July compared to last year while the core figure increased by 3.7%. The monthly gain was reported at 0.9%, which was well ahead of estimates for 0.2% and was the largest gain since inflation was surging higher in early 2022.
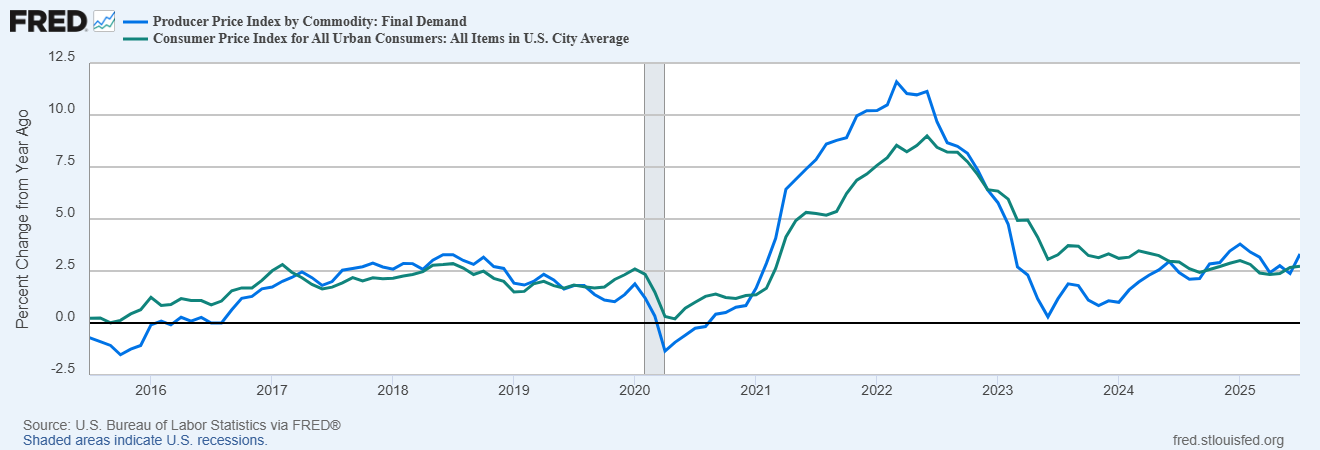
PPI measures the average change over time in the selling prices received by domestic producers for their output. That means it can lead changes in consumer price inflation. The chart below compares the annual change in CPI (green line) versus PPI (blue line), where you should watch for directional changes in inflation when PPI crosses over CPI.
It’s just the latest warning that accelerating inflation could mark the second half of the year. But that’s not the only economic development that could complicate matters for the Federal Reserve.
Despite the weak July payrolls report that saw major downward revisions to the prior two months, it appears that estimates for economic growth are holding up quite well.
Following the latest retail sales report, the Atlanta Fed’s estimate for 3Q GDP growth is holding up at 2.5% annualized. Evidence of a strong economy along with accelerating inflation could put expectations for interest rate cuts on the backburner.
This week, let’s look at leading indicators of inflation and evidence that companies are passing through tariffs in the form of higher prices. We’ll also look at metrics pointing to a resilient economy and why the economic outlook continues to support the rally in the S&P 500.
The Chart Report
The effective tariff rate currently stands at 18.6% which is the highest since 1933. One concern stemming from rising tariffs and the trade war are on the inflation picture, and if companies will pass higher costs to consumers in the form of higher prices. The PPI report is providing more evidence that businesses are increasing prices, which could show up in consumer inflation measures in the months ahead. The chart below shows the trade services component of the PPI report. It measures the margins received by wholesalers and retailers, and suggests producers are rising prices above cost.

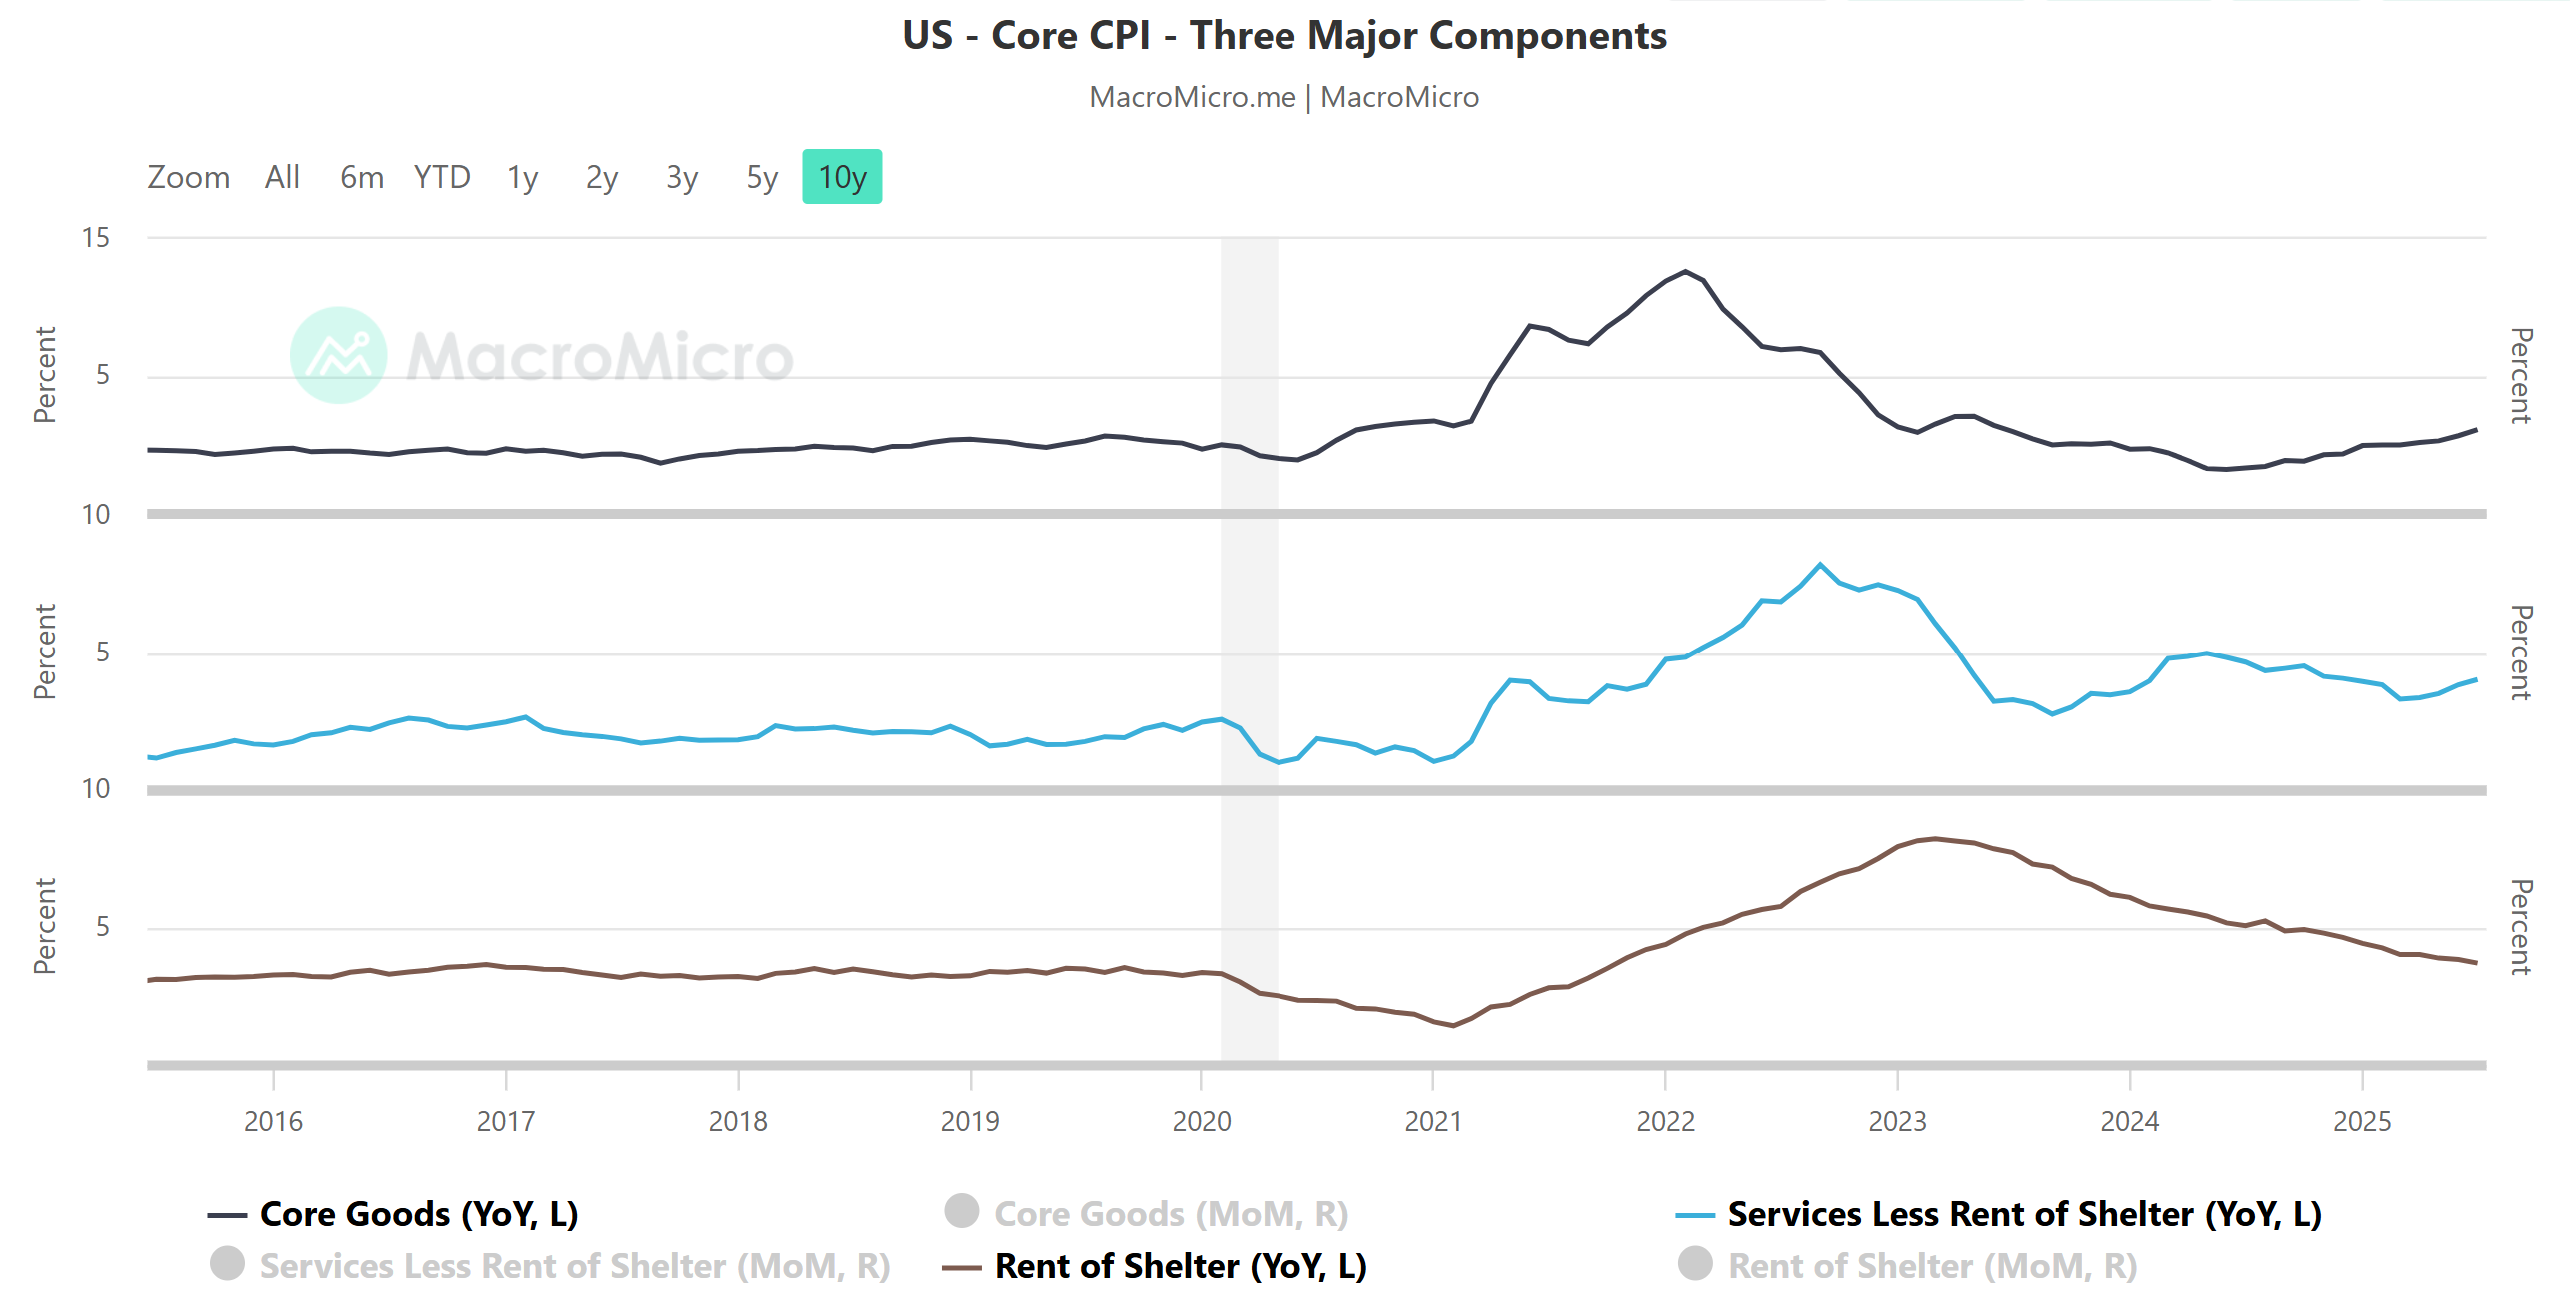
Investor attention will be fixated on Federal Reserve Chair Jerome Powell’s Jackson Hole speech, and how the Fed is viewing the balance of risks between recent weak labor market data and rising inflation. Past speeches by Powell have delivered insights on the metrics that central bank officials are tracking to make policy decisions. That includes comments by Powell in 2022 when he discussed core inflation components to monitor price levels. Those components include core goods, shelter, and core services excluding shelter (i.e. supercore inflation). The annual change in those three components are plotted in the chart below. You can see that core goods tends to move first followed by supercore inflation and then shelter. The recent increases in core goods and supercore inflation warn of rising inflation ahead.
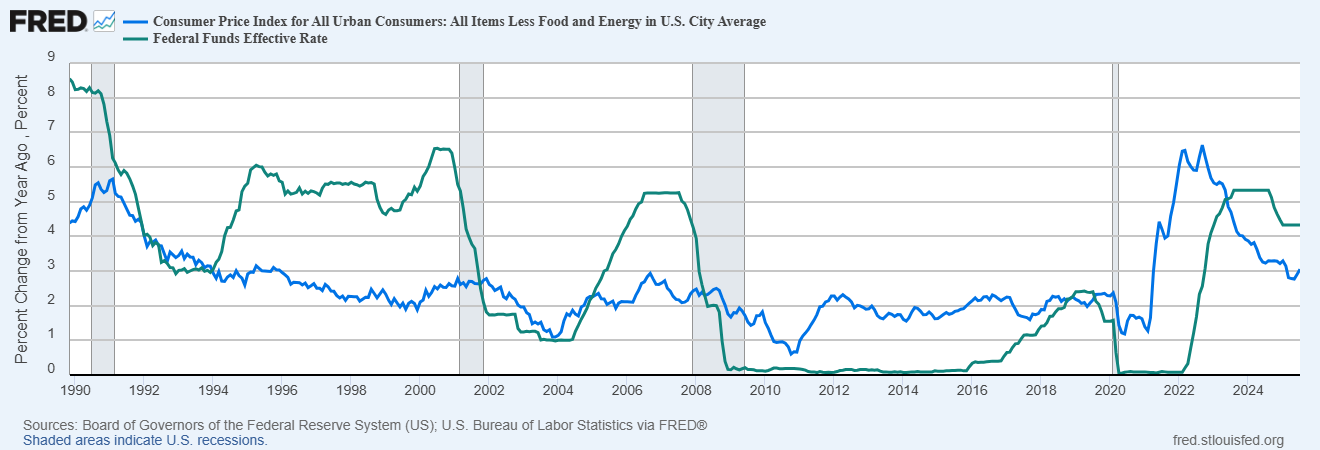
Despite the higher than expected core consumer and producer inflation reports for July, investors have barely tempered expectations for interest rate cuts in the months ahead. Odds for a quarter point rate cut at the next meeting in September stand at 92%, and the 2-year Treasury yield that tends to lead changes in the fed funds rate is hovering near recent levels. But unless there are clear signs of trouble in the economy, the Fed may decide to hold rates higher for longer. The chart below shows the annual change in core CPI (blue line) and the effective fed funds rate (green line). When policy is restrictive above core CPI, the Fed only tends to drop fed funds below CPI following a recession (shaded areas).
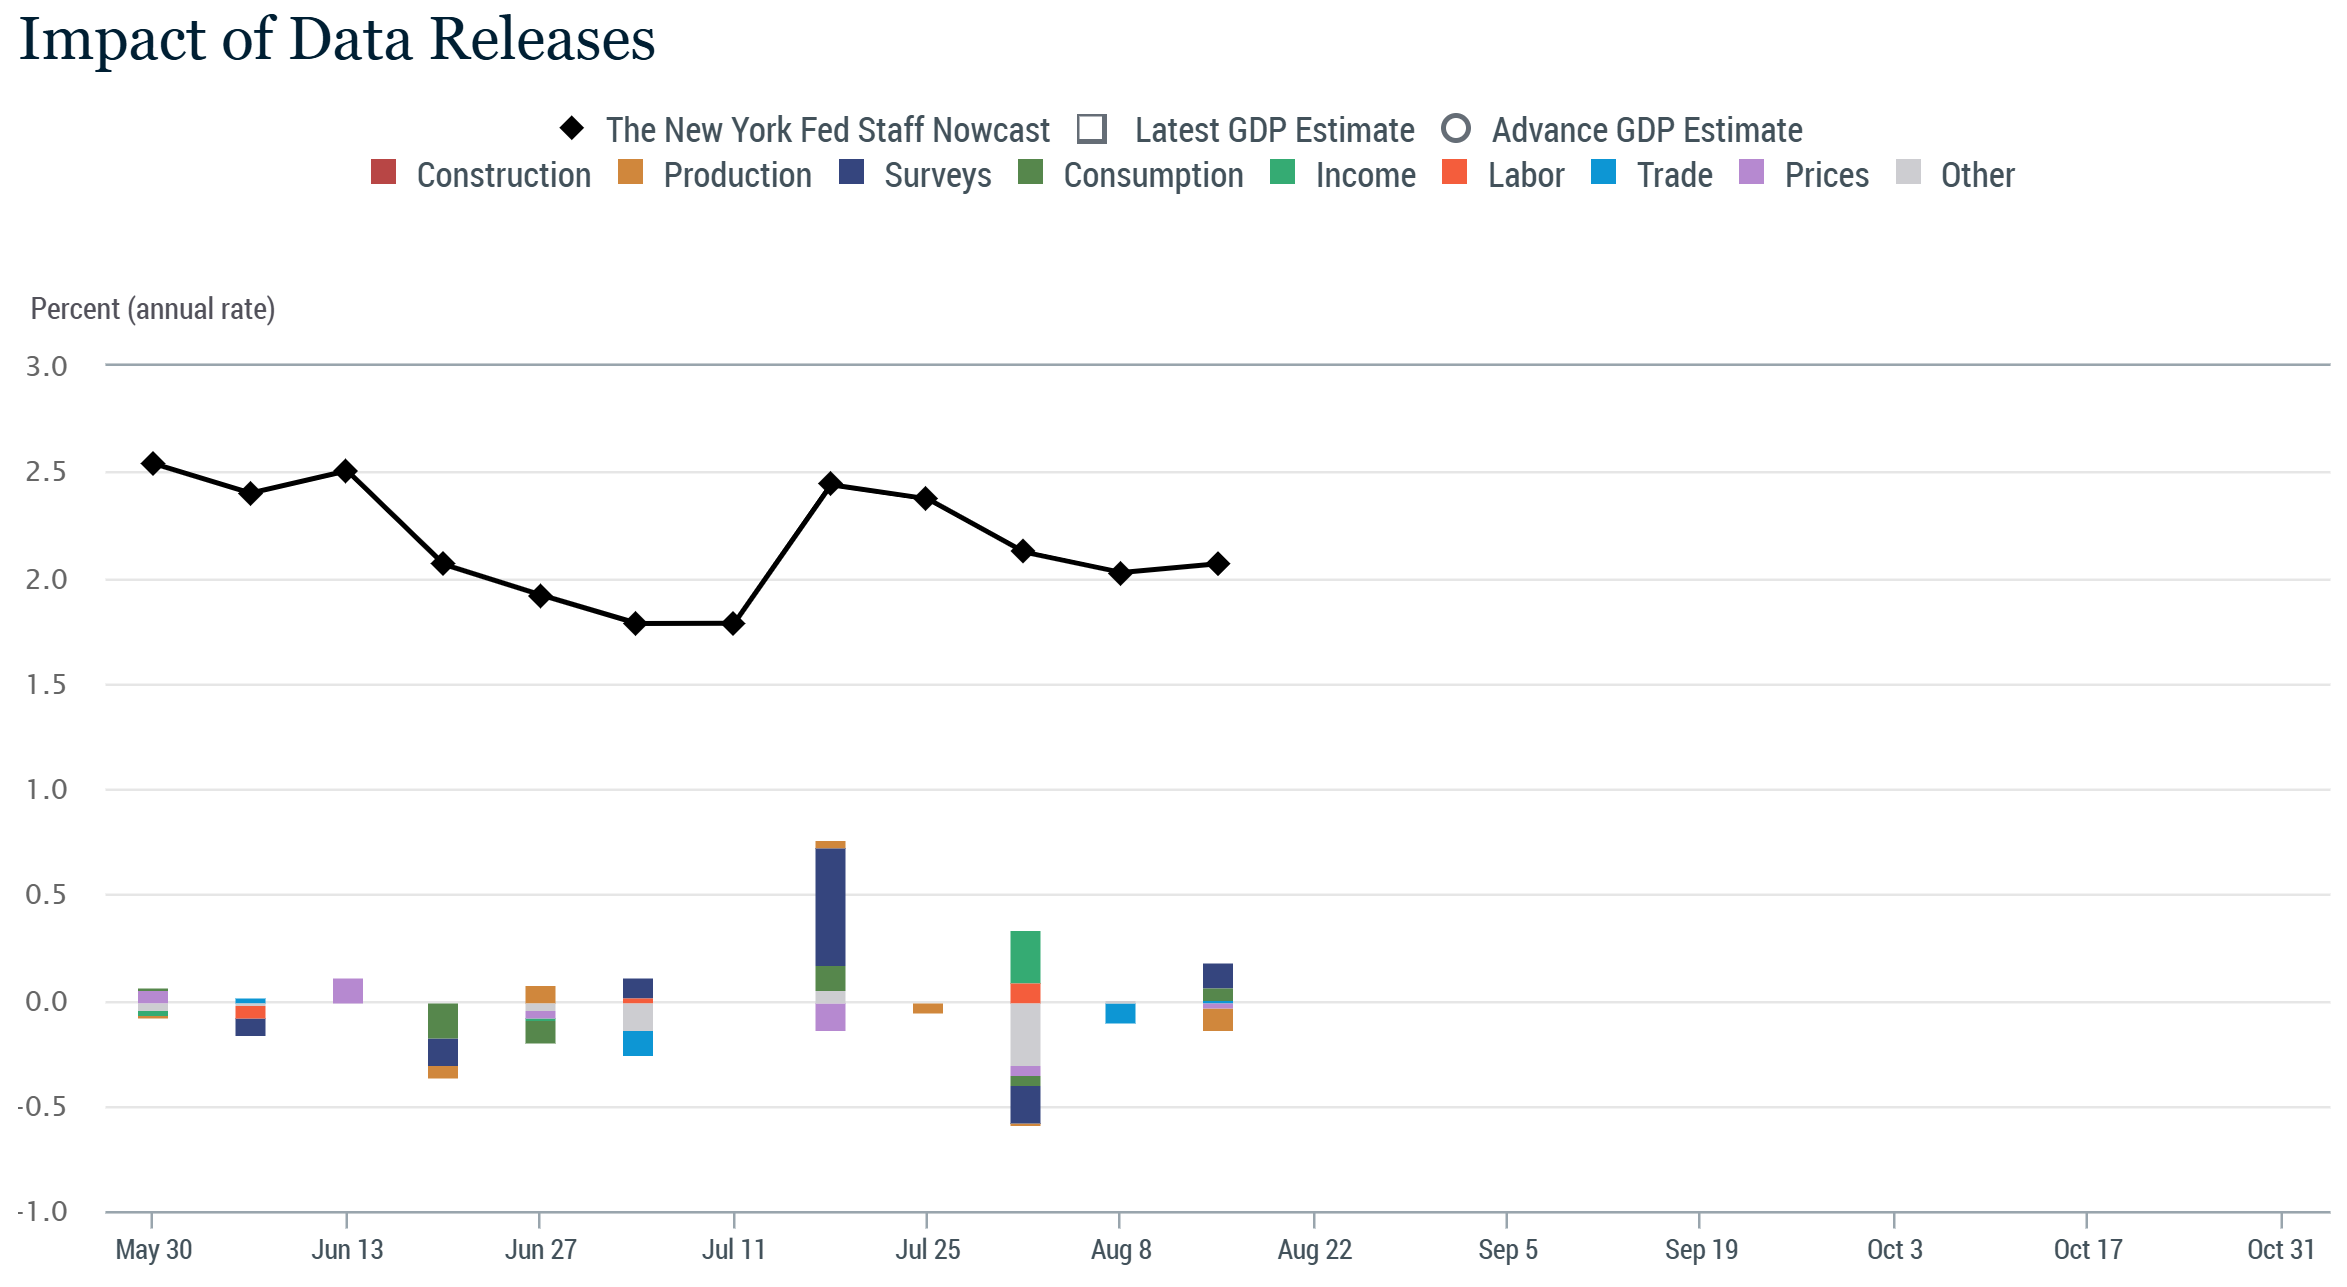
Concerns over the strength of the labor market are growing following the weaker-than-expected July payrolls report and downward revisions to the prior two months. But that weakness is not yet showing up in broader measures of economic activity. With trade war noise around the impact to consumer spending and export/import data now lessening, estimates for current quarter GDP growth are holding up. The widely-followed Atlanta Fed’s GDPNow model is showing 2.5% annualized growth for the third quarter and is being driven by moderate growth in consumer spending. The NY Fed’s GDP Nowcast is echoing something similar, and stands at 2.1% annualized for the third quarter (chart below).
Major stock market indexes like the S&P 500 are hovering near record high levels. A big part of the S&P’s recovery from the early April lows has been driven by mega-cap stocks like Nvidia (NVDA), which now makes up over 8% of the S&P 500 alone with its $4+ trillion market valuation. But recent performance shows that market breadth is expanding, with the NYSE advance/decline ratio hitting nearly 6 to 1 last week and is one of the strongest figures since the April lows. The recovery in the average stock is a key ingredient to keep the rally intact. Since stock prices follow corporate earnings over the long-term, evidence that the economy is holding up is supporting the profit outlook. The chart below shows that positive earnings revisions for the S&P 500 is up sharply and hitting the highest level in over three years.

Heard in the Hub
The Traders Hub features live trade alerts, market update videos, and other educational content for members.
Here’s a quick recap of recent alerts, market updates, and educational posts:
Signs that GDP growth is holding up.
Post-election year S&P 500 seasonality tracking.
Trade war noise in the economic data is clearing.
Breaking down the chart setup in this housing fintech.
A huge model portfolio winner in 2024 that could be setting up again.
You can follow everything we’re trading and tracking by becoming a member of the Traders Hub.
By becoming a member, you will unlock all market updates and trade alerts reserved exclusively for members.
🚨Our recent 142% gain in RKLB would cover a subscription for two years if you apply this discount found in the link below:
👉You can click here to join now👈
Trade Idea
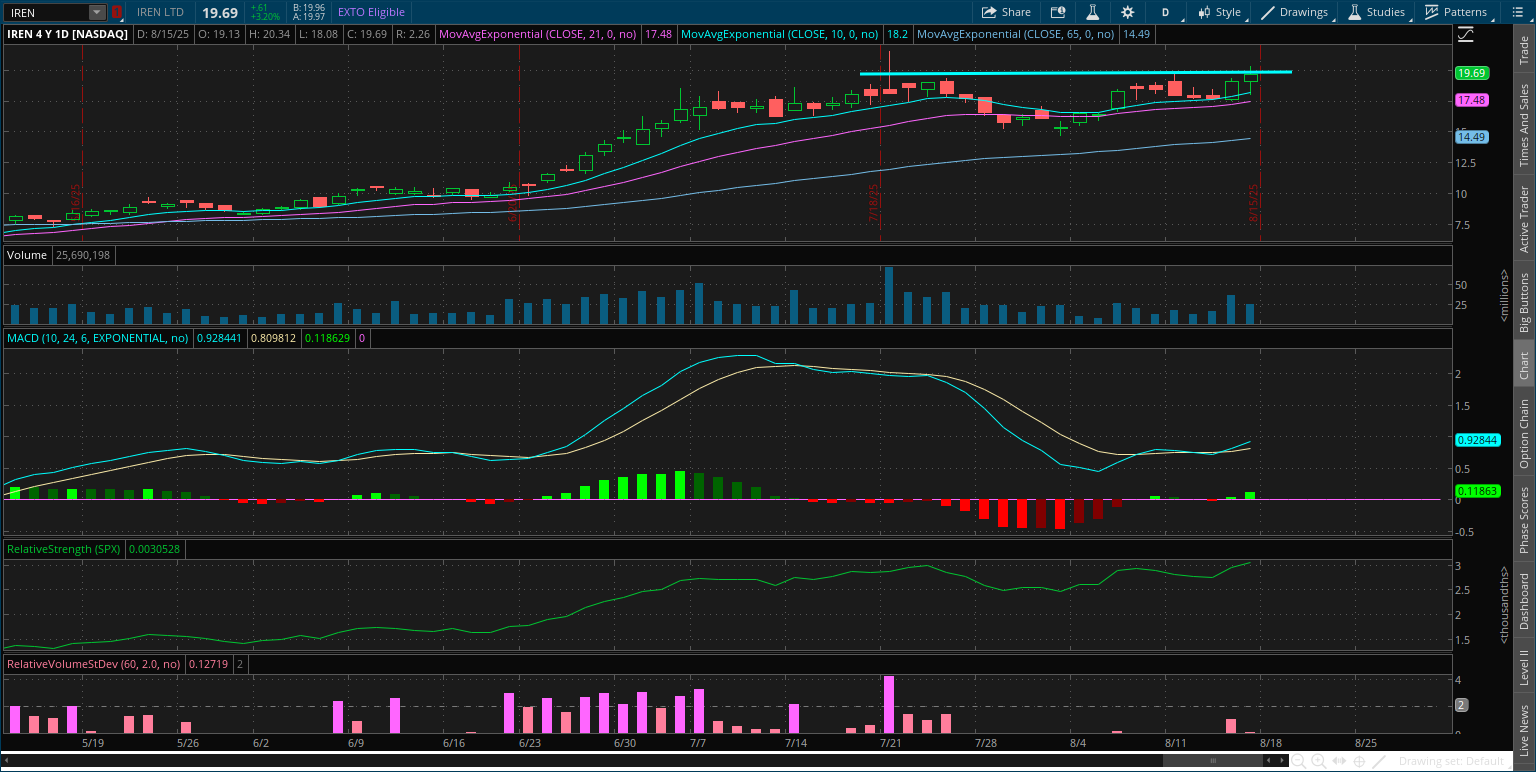
IREN Ltd (IREN)
After breaking out over resistance at the $15.50 level, price is coming back to test that area as support. That’s creating a base-on-base pattern to monitor, with a new resistance level near the $20 area.
Key Upcoming Data
Economic Reports
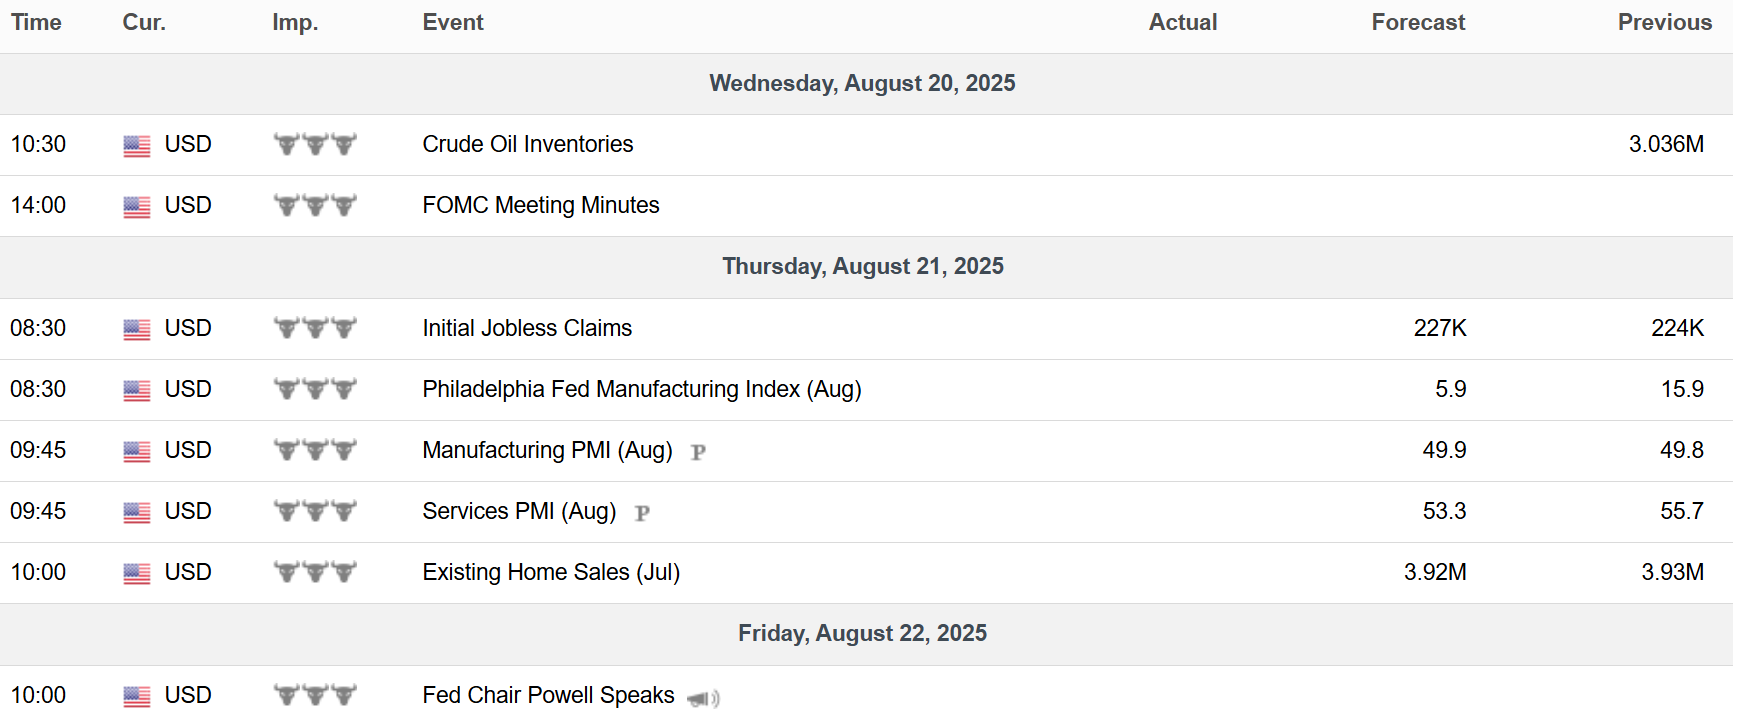
Earnings Reports

I hope you’ve enjoyed The Market Mosaic, and please share this report with your family, friends, coworkers…or anyone that would benefit from an objective look at the stock market.
Become a member of the Traders Hub to unlock access to:
✅Model Portfolio
✅Members Only Chat
✅Trade Ideas & Live Alerts
✅Mosaic Vision Market Updates + More
Our model portfolio is built using a “core and explore” approach, including a Stock Trading Portfolio and ETF Investment Portfolio.
Come join us over at the Hub as we seek to capitalize on stocks and ETFs that are breaking out!
And if you have any questions or feedback, feel free to shoot me an email at mosaicassetco@gmail.com
Disclaimer: these are not recommendations and just my thoughts and opinions…do your own due diligence! I may hold a position in the securities mentioned in this report.