
The Market Mosaic 8.13.23
3 reasons it's still a bull market.

Welcome back to The Market Mosaic, where I gauge the stock market’s next move by looking at macro, technicals, and market internals. I’ll also highlight trade ideas using this analysis.
If you find this content helpful please hit that “like” button, share this post, and become a subscriber to this always free report if you haven’t already done so!
And be sure to check out Mosaic Chart Alerts. It’s a midweek update covering chart setups among long and short trade ideas in the stock market, along with levels I’m watching.
Now for this week’s issue…
When the Nasdaq finished last week 1.9% lower, it marked the first time the index has seen two consecutive weekly declines in all of 2023.
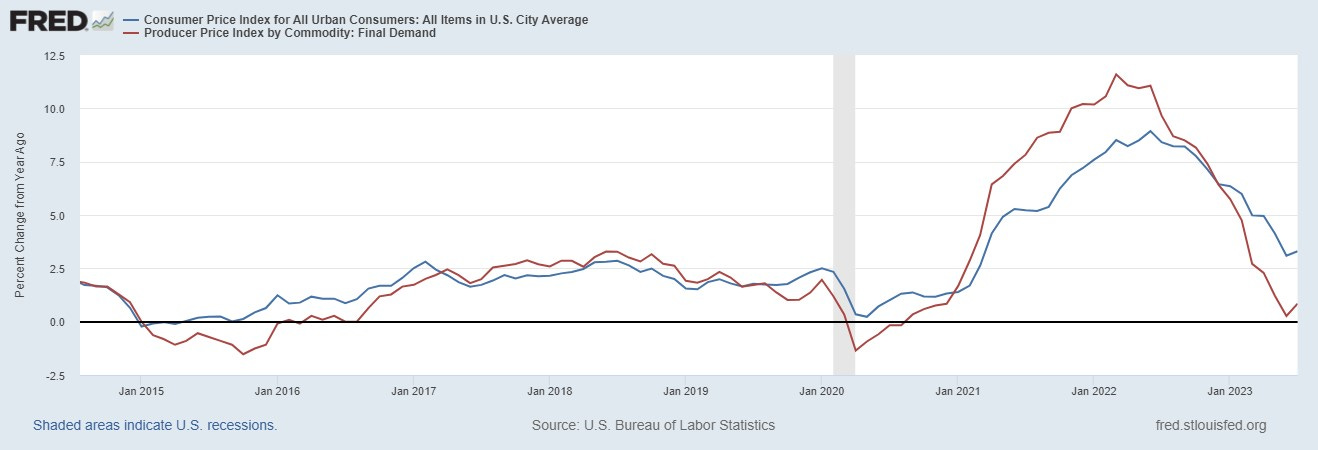
That comes on the heels of updated inflation reports, including both consumer and producer measures. The Consumer Price Index (CPI) sits at 3.2% year-over-year in July while the core measure stripping out food and energy prices is 4.7%. Both measures were less than economist estimates.
But it’s the Producer Price Index (PPI) that has investors a bit more worried. The PPI tends to lead changes in the CPI, with the former plunging to nearly zero in recent months. But the PPI turned higher for the first time in over a year as you can see in the chart below (PPI is the red line in the chart below versus CPI as the blue line). That’s leading to concerns that the CPI measure could accelerate once again.
The prospect of inflation reaccelerating weighed on stocks across the board last week, and it was the tech-heavy Nasdaq and growth shares that sold off the most. They’re the ones most susceptible to rising interest rates with the prospect of higher inflation. The chart below shows the 10-year Treasury yield is close to breaking out over resistance.

But even if the stock market keeps dipping here, there are signs abound that the bull market is still alive and that any pullback is just a pause in the uptrend.
Here are three metrics I’m watching that suggests the bull is still in charge.
3 Reasons the Bull is Intact
When it comes to big picture assessment of bull versus bear trends, I turn to earnings, participation in the prevailing trend, and junk debt.
It’s my preferred combination to gain an objective understanding of the forces driving the stock market’s trend. And when all three are aligning with the same message, it’s a powerful signal that shouldn’t be ignored.
Lets start with earnings. I’ve written frequently about the importance of the earnings recovery for the bull market. After all, earnings are the key driver for the long-term trend in stock prices.
Forget about the daily noise in the stock market, or the fact that the Nasdaq and S&P 500 fell for two weeks in a row. What matters most to the big picture is the trend in earnings.
With the second quarter reporting season wrapping up, estimates for the next 12 months are moving higher. The chart below shows that forward estimates gaining quickly, and are only 1% below the prior high.

When it comes to tracking the trend in stock prices, it pays to also understand participation in the trend. This is where breadth metrics provides insight, especially when comparing the number of stocks making new 52-week highs versus new 52-week lows.
The daily difference between the two can be noisy at times. That’s why it’s helpful to keep a cumulative running tally of the net result, which delivers insights about the long-term trend. You can take it a step further by applying a moving average to that trend in order to generate bullish and bearish signals. The chart below shows cumulative net new highs along with a 50-day moving average (dotted line).
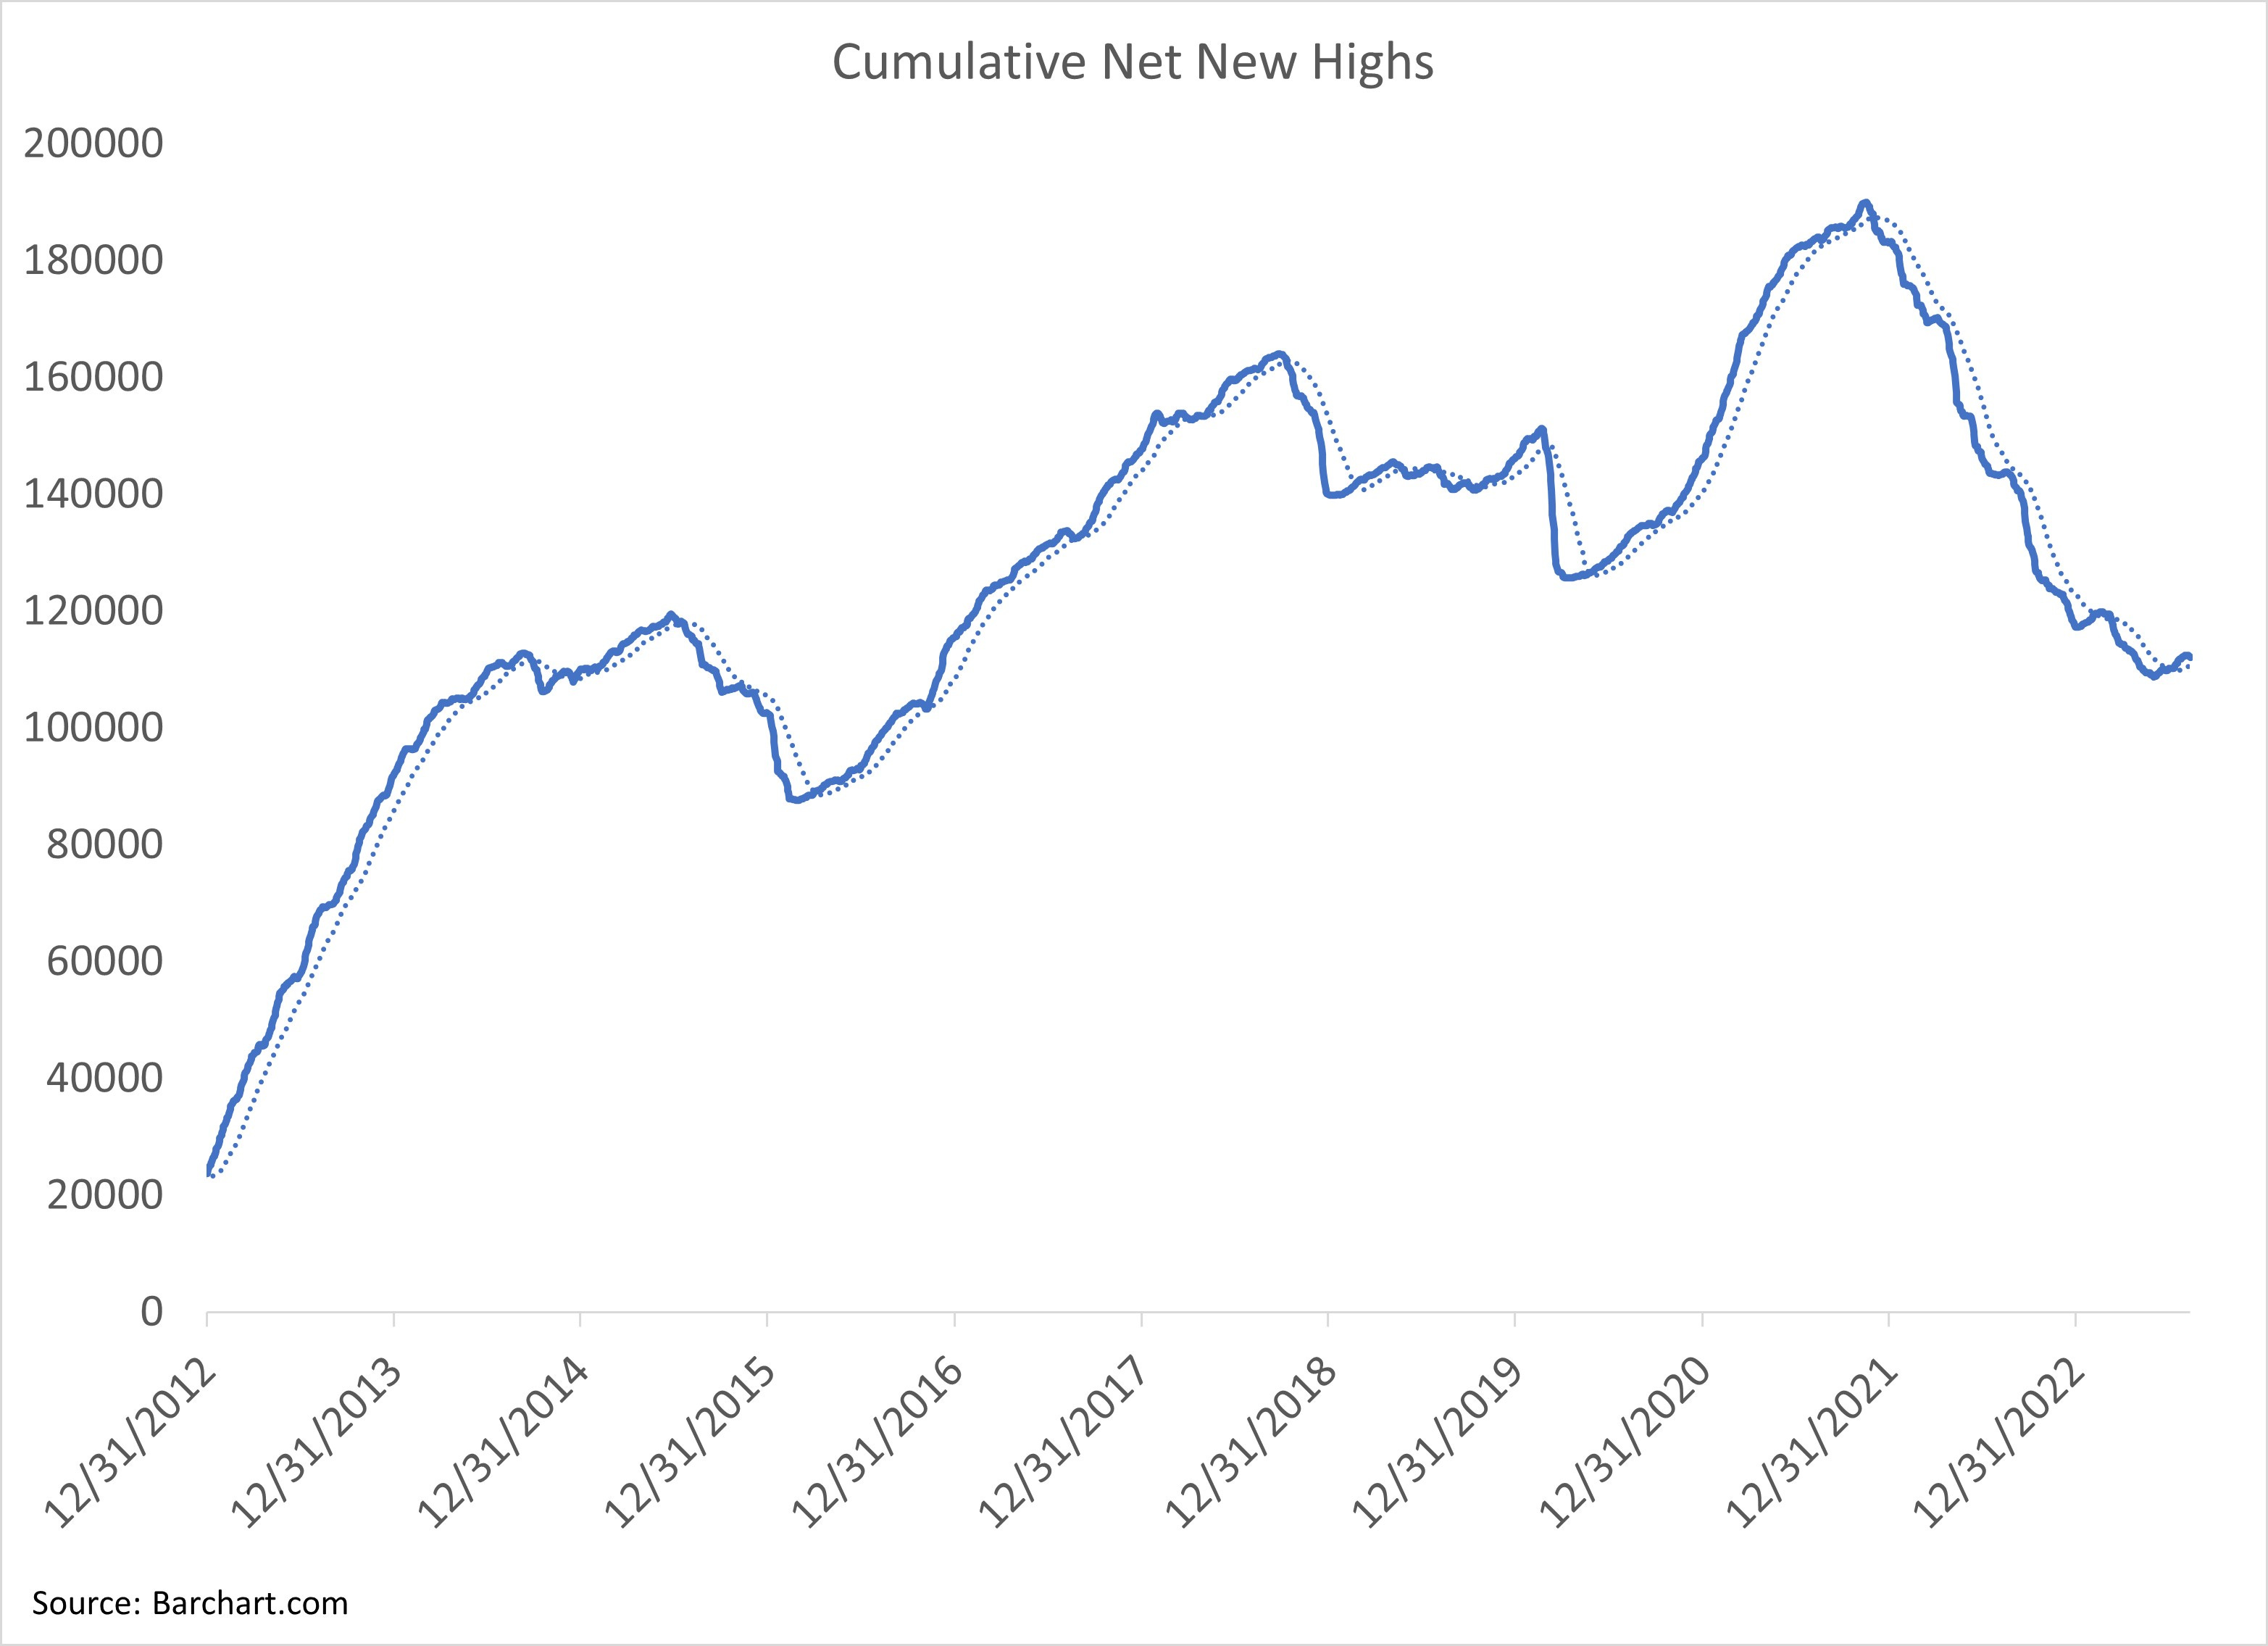
You can see a recent bullish crossover in July shows growing participation in the trend, which is badly needed to support the rally.
Finally, I also look to confirm bullish and bearish trends with the message coming from fixed income markets, and specifically high yield bonds. The extra compensation that high yield investors demand over a safe asset like a U.S. Treasury bond is called a spread, and that spread moves higher or lower based on the perception of being paid back in full from lower quality companies.
That makes spreads very sensitive to changes in the economic outlook, with spreads widening when high yield investors grow nervous and narrowing when the outlook is positive.
After rising into mid-2022, spreads are continuing to compress which is a positive signal on the economic outlook and thus the bull market trend.

The combination of rising forward earnings estimates, positive breadth in the stock market’s trend, and falling high yield spreads collectively suggests that the bull market is intact.
Now What…
I believe the prevailing trend is a bullish one, so I’m tracking the progression from stocks being overbought to oversold. I wrote about metrics to track for oversold conditions last week, and stocks overall continue inching toward oversold levels as I recently discussed:
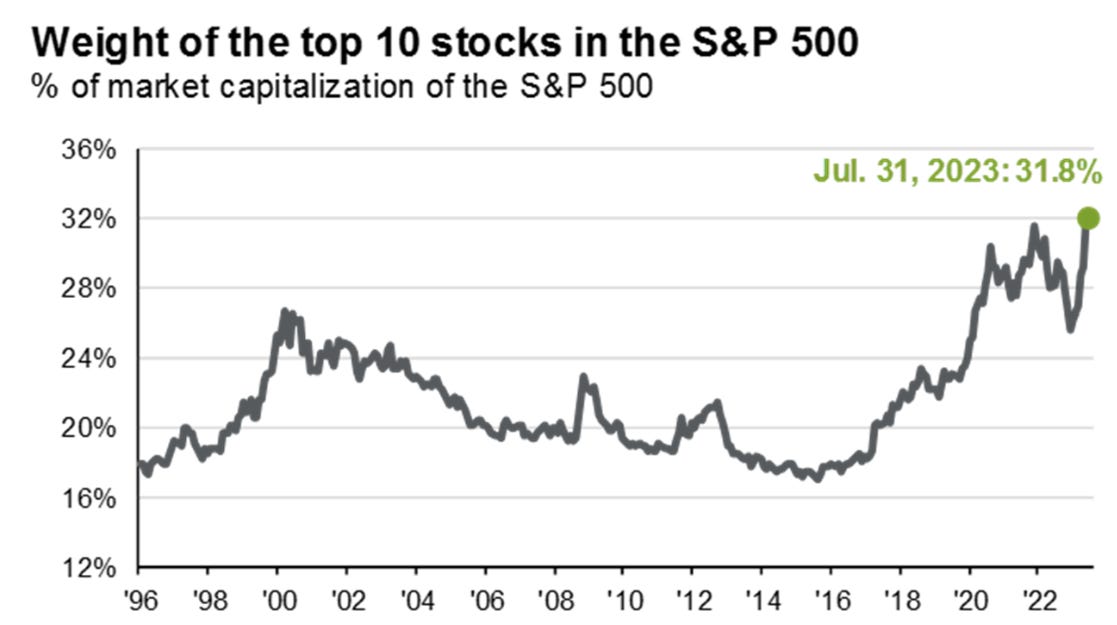
A lot of the recent selloff has been in the technology and growth corners of the stock market. After all, tech has led the way this year, and it makes up a huge portion on the major indexes like the S&P 500. You can see in the chart below from J.P. Morgan that the top 10 stocks in the index is running at the highest level in over 25 years, with tech dominating the largest holdings.
That means the selloff in tech and growth stocks is dragging the S&P 500 lower, but weakness in indexes is masking strength under the hood. There’s been a major rotation taking place into value sectors along with commodities and energy.
That’s where my recent watchlist additions have been focused, like with industrial stock AIT. Following earnings last week, the stock gapped above the $149 resistance level that you can see below.

There are also several setups developing with tanker companies that ship oil. The chart below shows TNK, which is seeing a great string of quarterly sales and earnings growth. I’m watching for a breakout over the $47 level.

That’s all for this week. Next week should provide relative calm with a light economic calendar and earnings season wrapping up. I’ll be paying most attention for signs of oversold conditions and that the bull market can resume.
I hope you’ve enjoyed The Market Mosaic, and please share this report with your family, friends, coworkers…or anyone that would benefit from an objective look at the stock market.
And make sure you never miss an edition by subscribing here:
For updated charts, market analysis, and other trade ideas, give me a follow on Twitter: @mosaicassetco
And if you have any questions or feedback, feel free to shoot me an email at mosaicassetco@gmail.com
Disclaimer: these are not recommendations and just my thoughts and opinions…do your own due diligence! I may hold a position in the securities mentioned in this report.