
The Market Mosaic 8.10.25
Will inflation reports change the outlook for rate cuts?

👋Welcome back to The Market Mosaic, where I gauge the stock market’s next move by looking at macro, technicals, and market internals. I’ll also highlight trade ideas using this analysis.
If you find this report helpful please hit that “like” button, share this post, and become a subscriber if you haven’t already done so!
🚨And be sure to check out Mosaic Traders Hub. It’s a members-only platform to alert trade ideas, track a model portfolio of open positions, and further analyze the message coming from the capital markets (👇be sure to check out our special offer below).
Now for this week’s issue…
The outlook for interest rate cuts by the Federal Reserve will be under scrutiny this week with new inflation reports on deck.
After the most recent report on the Fed’s preferred inflation gauge, the PCE price index, market expectations for rate cuts became more hawkish. The June PCE report showed inflation accelerating to a 2.6% annual pace compared to May’s 2.4% gain.
But a weak payrolls report led to a massive shift in expectations. Fears over a deteriorating labor market put more rate cuts back on the table. Various Wall Street strategists are now revising their expectations for rate cuts. Goldman Sachs expects cuts to start at the Fed’s September meeting, while JPMorgan is now penciling four rate cuts this year.
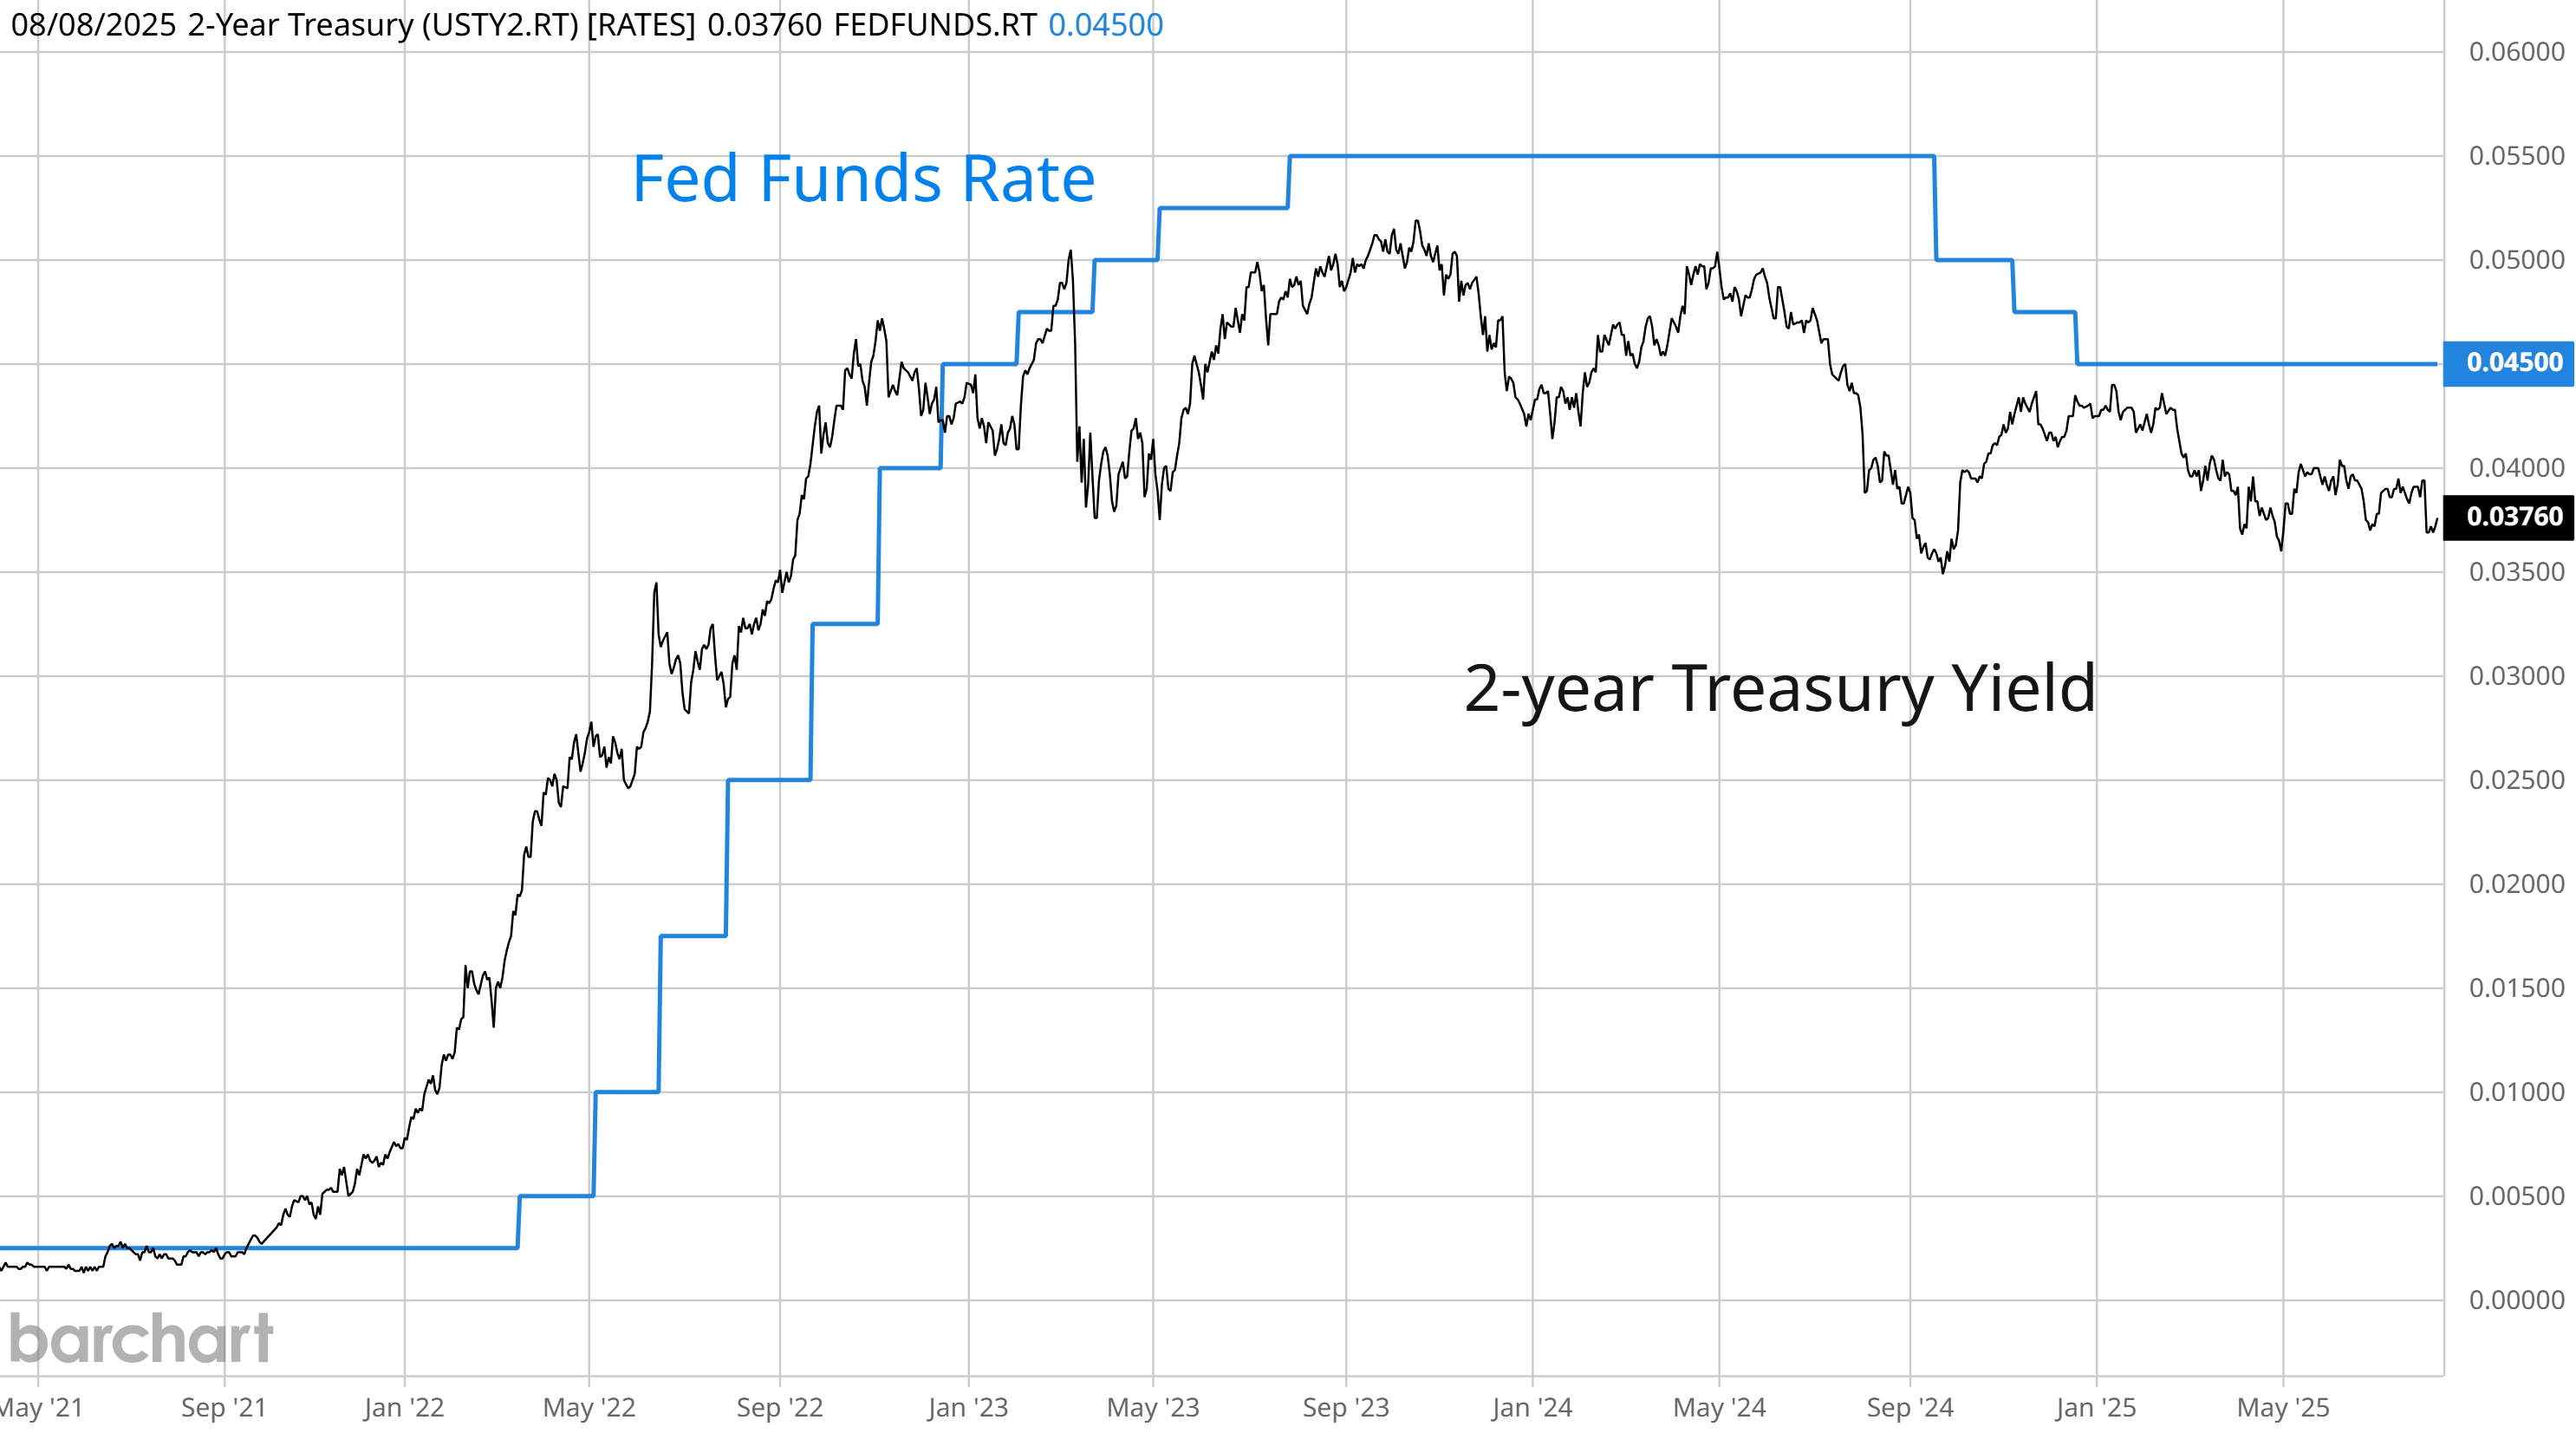
My preferred leading indicator of the short-term fed funds rate is projecting more cuts as well. The 2-year Treasury yield tends to lead changes in the fed funds rate, and is recently dropping to a level implying around two 0.25% cuts looking ahead.
With updated reports on the Consumer Price Index (CPI) and Producer Price Index (PPI) on deck, the outlook for rate cuts has massive implications for various markets. Major stock indexes are rallying on the hopes for lower rates, while homebuilding stocks are finally moving off the early April lows.
But other corners of the capital markets are reflecting concerns that inflation could become a big problem in the months ahead. That includes a rally in gold mining stocks, and coiling action in gold itself that could send prices to record highs over the $3,500 per ounce level.
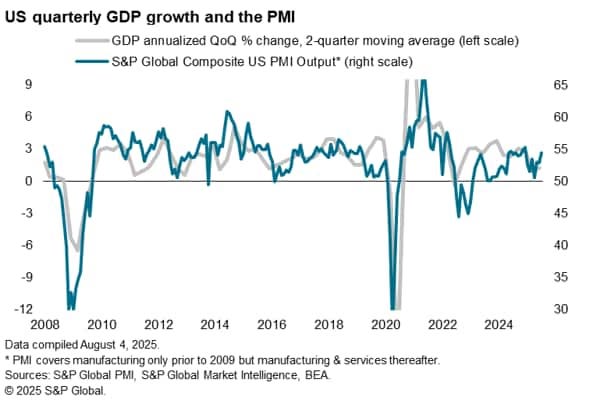
There’s also evidence that the economy is holding up just fine despite the recent payrolls data. A report on business activity from S&P Global hit the highest level of the year, while the Atlanta Fed’s GDPNow report shows third quarter annualized growth at 2.5% following the second quarter initial reading at 3.0% growth.
This week, let’s look at leading indicators of inflation and why price levels could become problematic in the coming months. We’ll also look at the tightening consolidation in gold prices, and why the average stock could be on the verge of a massive reversal.
The Chart Report
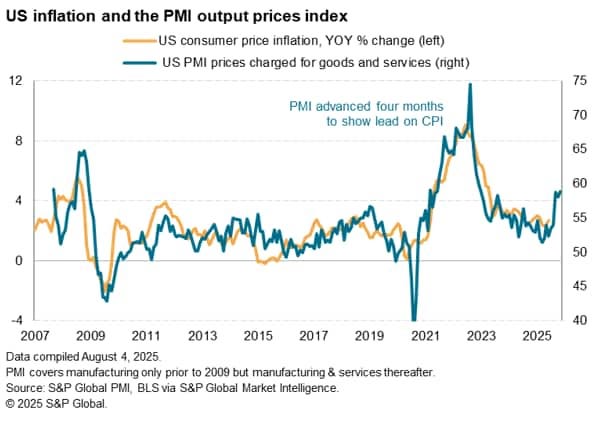
Every month, various organizations conduct business surveys to assess whether manufacturing and service sector activity is expanding or contracting. The estimates are compiled from questions covering new orders, employment trends, and inventories among other things. These purchasing managers indexes (PMI) also looks at prices paid for inputs into products and services. An increase in prices paid is frequently an early indicator of a pickup in inflation, with cost increases eventually being passed on to consumers. The chart below shows the prices paid component of S&P Global’s U.S. PMI. The U.S. prices paid (blue line) is moved ahead four months and overlaid with CPI consumer inflation (orange line) and is suggesting higher consumer inflation ahead.
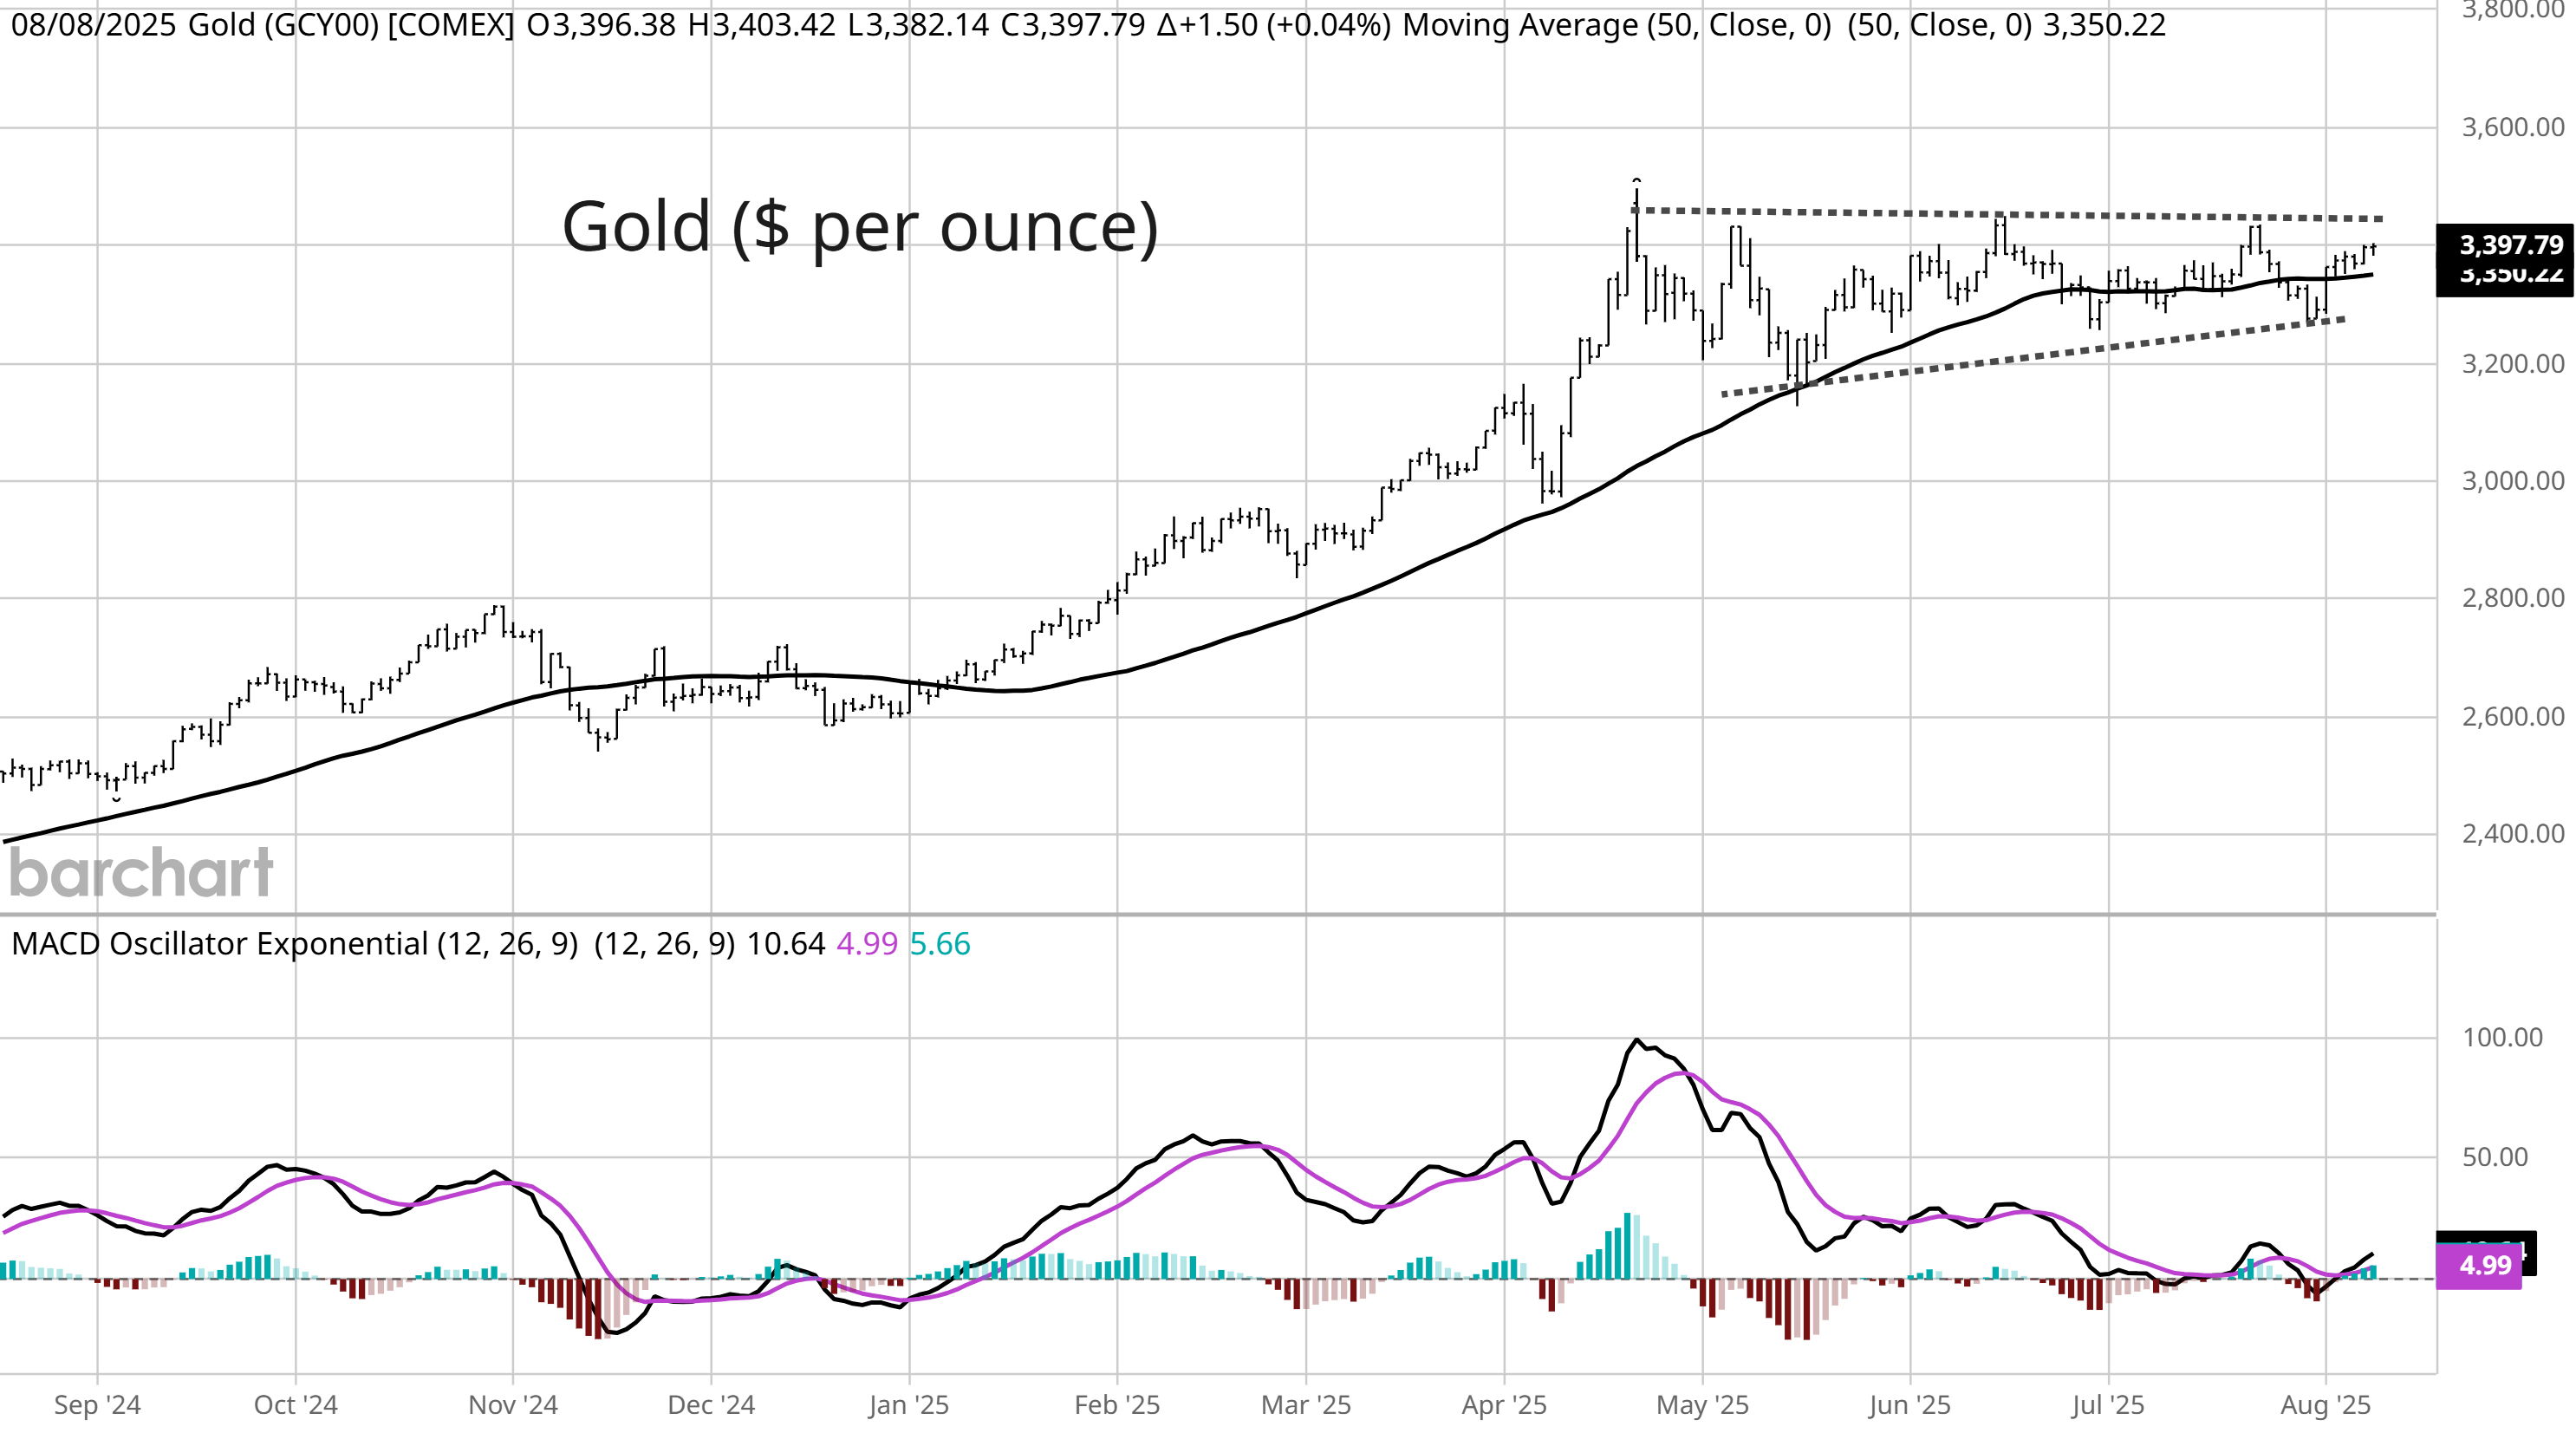
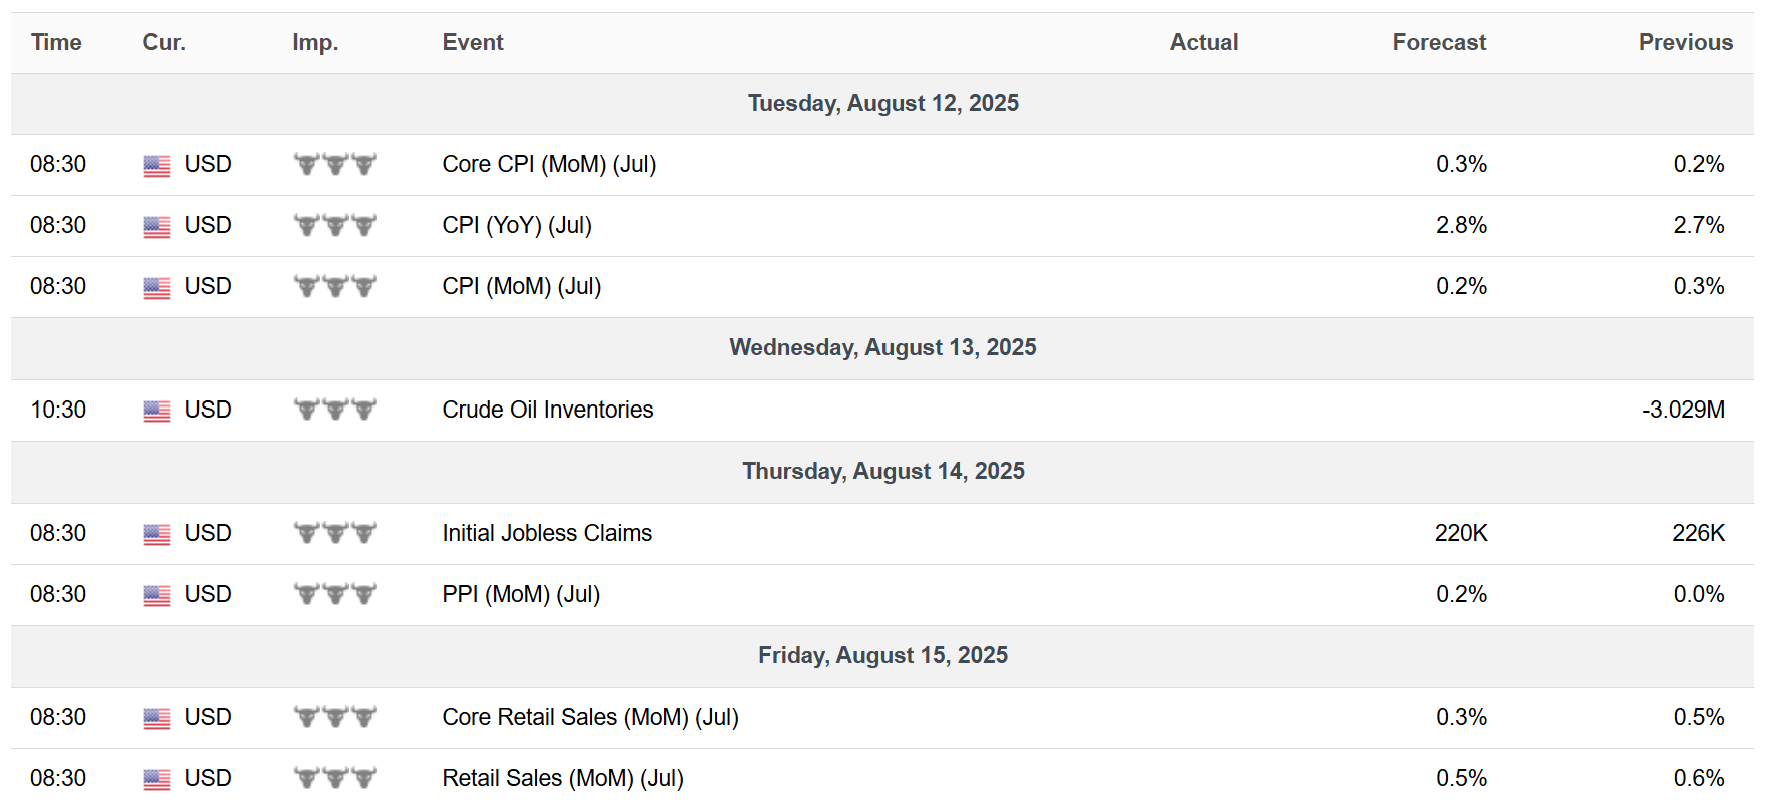
Next week will feature key reports on consumer and producer inflation. Both the CPI and PPI are scheduled for release covering the month of July. Estimates currently forecast that consumer inflation is set to accelerate slightly from June’s pace. If there’s evidence that inflation is inflecting higher, that could become a catalyst to push gold out of a four month consolidation. After peaking near $3,500 per ounce, gold prices are trading in a range around the 50-day moving average (shown with the dashed trendlines) and is starting to coil tighter. A break above $3,500 could mark the start of the next major uptrend phase in gold.
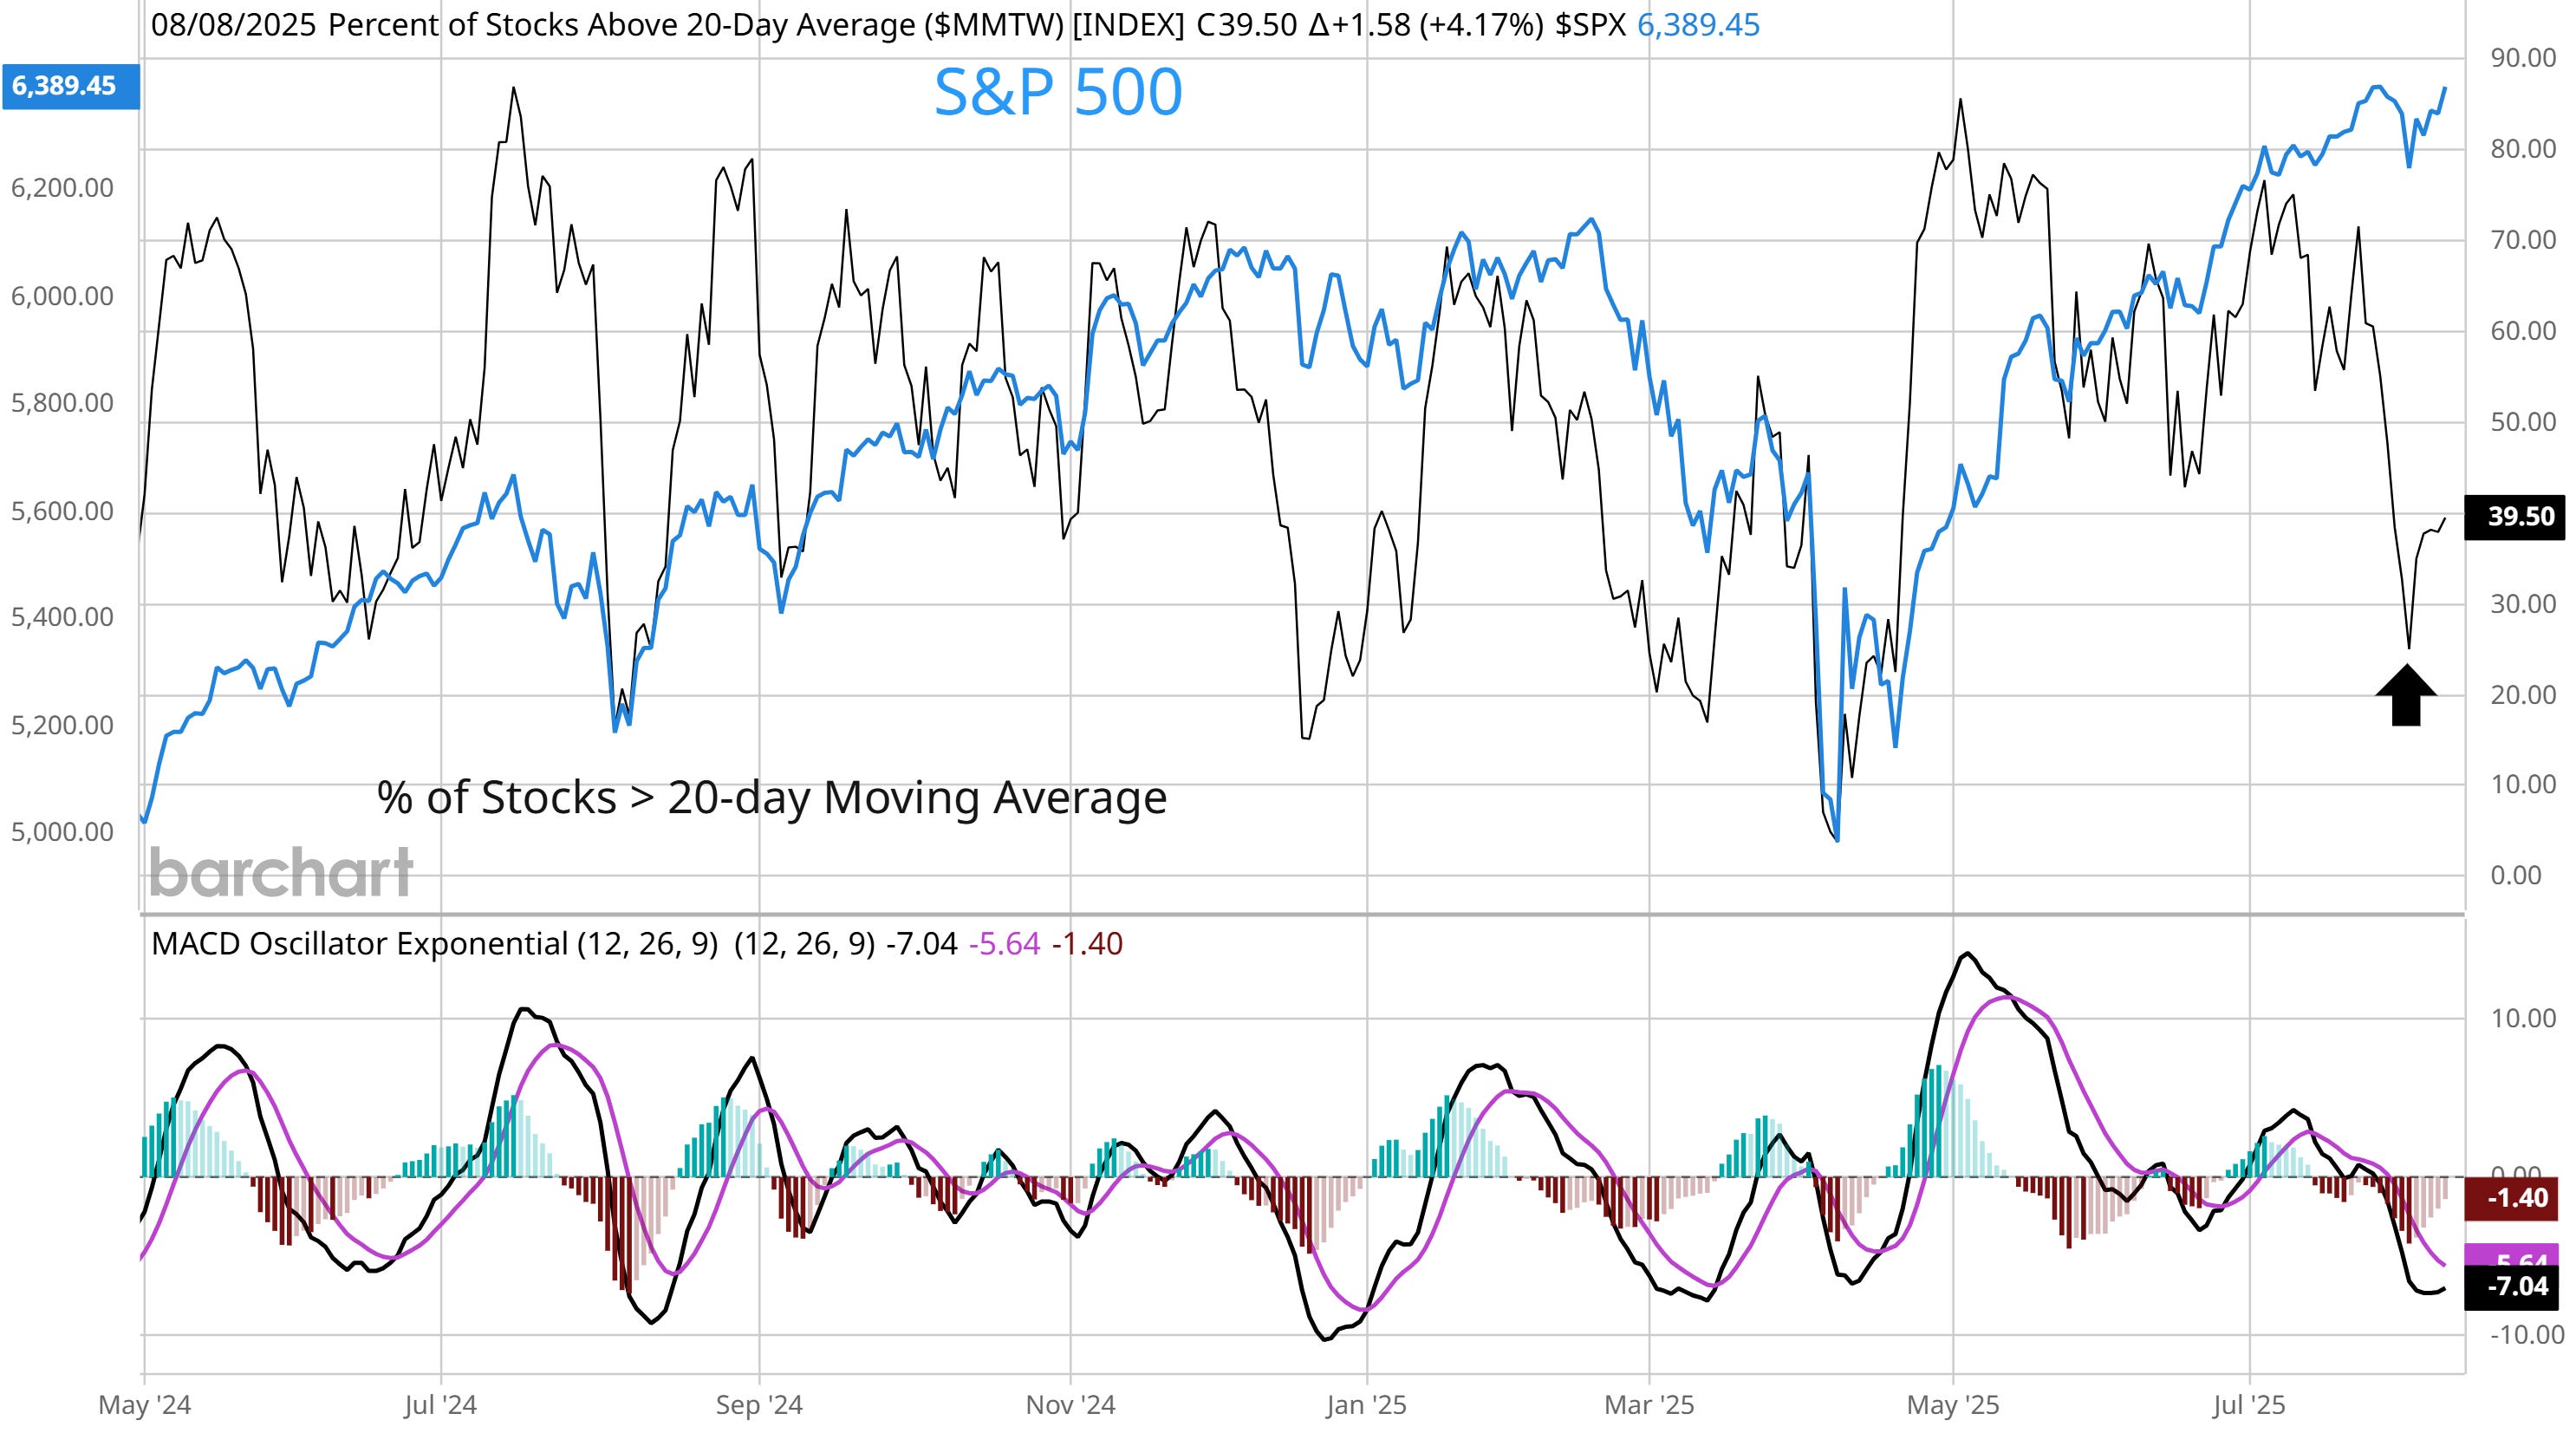
Stock market breadth is in a peculiar spot heading into a seasonally weak stretch for the S&P 500. August and September tend to be weaker months based on historic seasonality. During post election years since 1950, this is about the time the S&P 500 pulls back into October. With the S&P 500 hovering just below record highs, the percent of stocks across major exchanges trading above their 20-day moving average is only at 39%. That shows weak participation in the trend, but is also turning higher from an oversold level near the 20% threshold (arrow) since the start of August.
Positioning by speculative investors could be a catalyst supporting a recovery in the average stock just as breadth was nearing oversold levels in early August. A report on positioning in futures contracts tied to the Russell 2000 Index of small-cap stocks shows a historically large short position across a category including large speculators and hedge funds. At the same time, commercials’ net position is close to a record high. When it comes to positioning in futures, commercials are considered to be the “smart” money while extreme values in speculator positioning could mark a turning point in trend.

The Fed’s dual mandate of supporting full employment along with price stability (i.e. low inflation) will be under the microscope with this week’s inflation reports. Expectations for rate cuts has quickly moved back to favoring more cuts during the second half of the year. That shift came on the heels of July’s weak payrolls report that also saw large downward revisions to May and June. But other evidence points to an economy holding up just fine. S&P Global’s Composite US PMI came in at 55.1 in July, which is the highest reading of the year and consistent with GDP growth at 2.5% (chart below). The PMI has been moving higher in recent months (blue line), suggesting GDP growth could accelerate. The Atlanta Fed’s GDPNow model also provides a real-time estimate of current quarter GDP growth, and is also running at a 2.5% annualized pace.
Heard in the Hub
The Traders Hub features live trade alerts, market update videos, and other educational content for members.
Here’s a quick recap of recent alerts, market updates, and educational posts:
S&P 500 seasonal trends playing out.
Short-term breadth is already oversold.
A new position in a high-growth biotech stock.
Why VIX holds the key to the next big pullback.
The stock we’re looking to add following a “breakaway gap”.
You can follow everything we’re trading and tracking by becoming a member of the Traders Hub.
By becoming a member, you will unlock all market updates and trade alerts reserved exclusively for members.
🚨Our recent 142% gain in RKLB would cover a subscription for two years if you apply this discount found in the link below:
👉You can click here to join now👈
Trade Idea
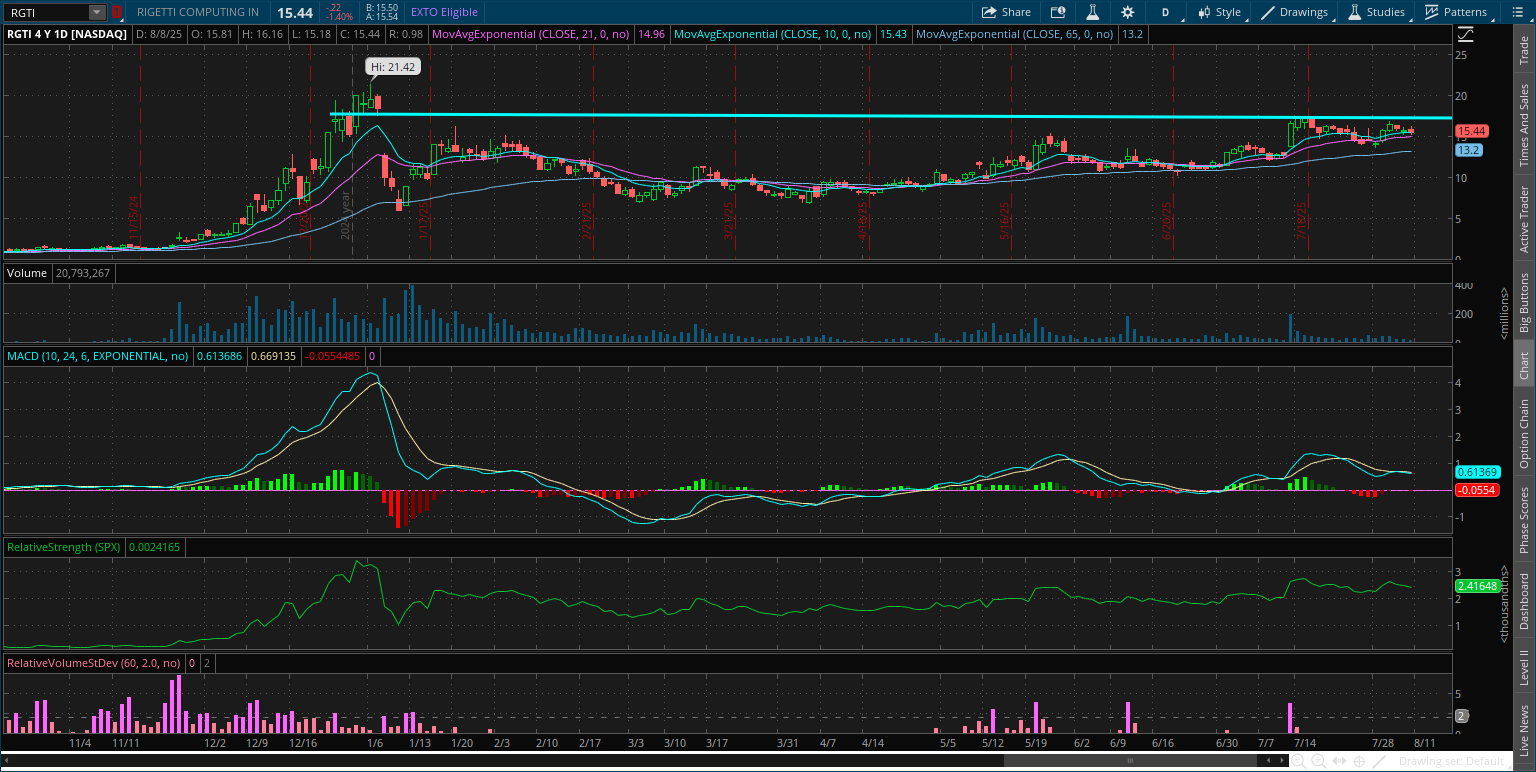
Rigetti Computing (RGTI)
Quantum computing stock that peaked at the $20 level in January. The stock is making a series of higher lows and smaller pullbacks since April, showing accumulation in its basing structure. Watching for an initial move over $17, with follow through to new highs.
Key Upcoming Data
Economic Reports
Earnings Reports

I hope you’ve enjoyed The Market Mosaic, and please share this report with your family, friends, coworkers…or anyone that would benefit from an objective look at the stock market.
Become a member of the Traders Hub to unlock access to:
✅Model Portfolio
✅Members Only Chat
✅Trade Ideas & Live Alerts
✅Mosaic Vision Market Updates + More
Our model portfolio is built using a “core and explore” approach, including a Stock Trading Portfolio and ETF Investment Portfolio.
Come join us over at the Hub as we seek to capitalize on stocks and ETFs that are breaking out!
And if you have any questions or feedback, feel free to shoot me an email at mosaicassetco@gmail.com
Disclaimer: these are not recommendations and just my thoughts and opinions…do your own due diligence! I may hold a position in the securities mentioned in this report.
RGTI. Looks like good one to get in after that long base breakout. Also Gold bumped against the ceiling four times so far.. Coiling for breakout