The Market Mosaic 7.6.25
Robust jobs report propels S&P 500 to new record highs.
👋Welcome back to The Market Mosaic, where I gauge the stock market’s next move by looking at macro, technicals, and market internals. I’ll also highlight trade ideas using this analysis.
If you find this report helpful please hit that “like” button, share this post, and become a subscriber if you haven’t already done so!
🚨And be sure to check out Mosaic Traders Hub. It’s a members-only platform to alert trade ideas, track a model portfolio of open positions, and further analyze the message coming from the capital markets.
Now for this week’s issue…
Just as the S&P 500 started making fresh record highs, last week was setting the stage to disappoint investors.
A report on the manufacturing sector showed contracting activity for the fourth consecutive month. The ISM Manufacturing PMI came in at 49, where a reading below 50 points to falling activity (and above 50 indicates expansion).
The employment component within the report came in at 45 and shows a shrinking headcount in the sector. That was followed by the ADP report on private sector payrolls that showed a loss of 33,000 jobs during June. That badly missed economist estimates for a gain of 100,000 and was the first job loss since March 2023.
That set the stage for a disappointing June payrolls report…except it didn’t disappoint at all.
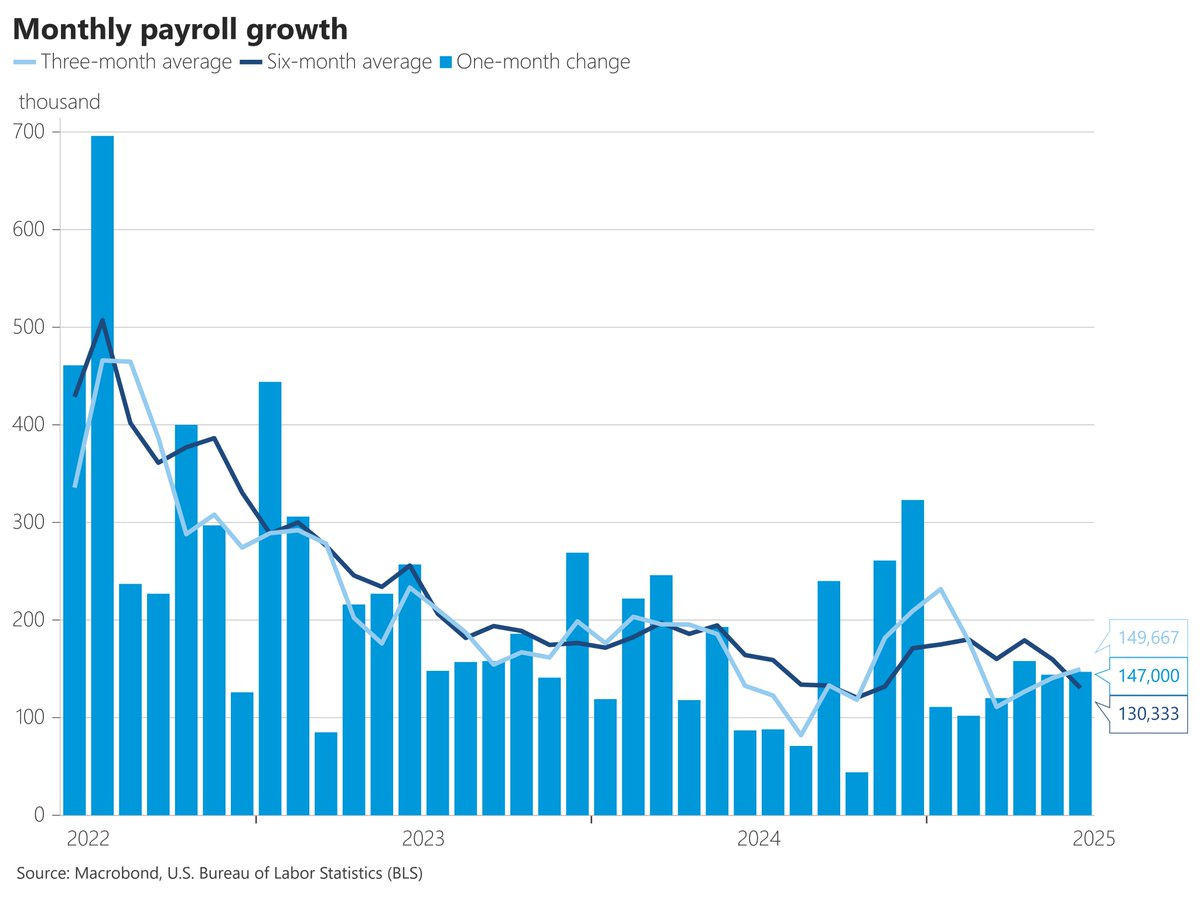
The June nonfarm payrolls report showed that 147,000 jobs were added during the month (chart below), which beat expectations for 110,000. The household survey showed the addition of 329,000 jobs, which led the unemployment rate to fall to 4.1%.
Despite the recent demands from President Trump for the Federal Reserve to lower rates, evidence of a strong labor market supports the Fed’s preference to hold rates steady and see how inflation evolves.
This week, let’s look at why market-implied odds for rate cuts are shifting direction once again. We’ll also look at the “risk-on” nature of the rally, and how investor sentiment is shifting back to greed.
The Chart Report
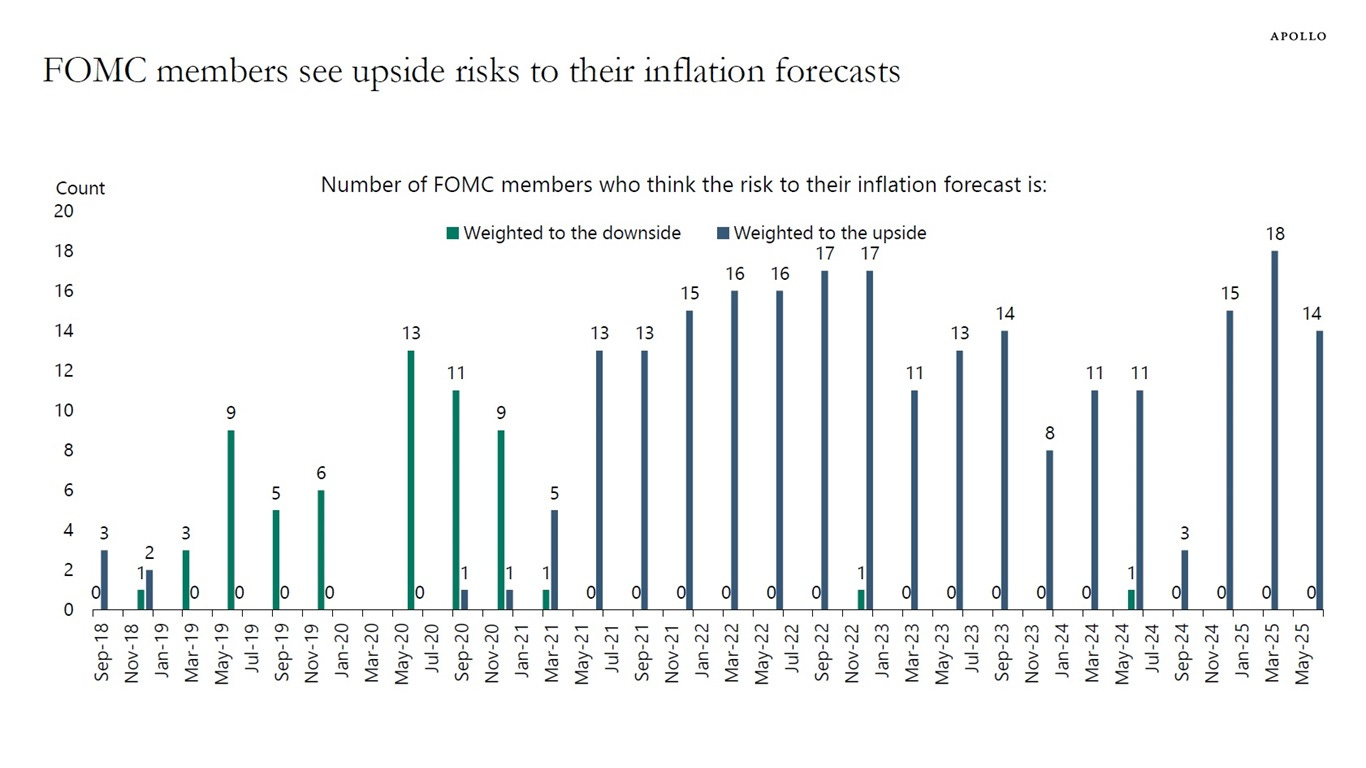
As President Trump demands that the Fed cuts rates significantly, a strong payrolls report is colliding with inflation concerns. Recent weakness in some economic reports along with the disinflation trend since mid-2022 was raising hopes that the Fed could cut rates more than the two quarter-point reductions that central bank officials are forecasting for this year. But the better-than-expected payrolls report hit at the same time members of the Fed’s rate-setting committee are worried about upside risks to inflation. The chart below shows that all Fed members who vote on interest rates see upside risks to inflation.
The outlook for additional rate cuts is being questioned once again. Market-implied odds have shifted to favor two 0.25% cuts this year after showing three cuts last week. But the stock market is moving higher regardless of the outlook for rates. That’s because stock prices follow earnings over the long-term, so evidence that the economic outlook remains intact is a key driver behind the S&P 500’s quick move back to new record highs. Animal spirits are also running strong among investors, with high beta stocks outperforming low volatility stocks last quarter by the most since 2020.
Another catalyst behind the risk-on move in the stock market is the U.S. Dollar Index (DXY). The dollar has fallen by over 10% this year, which makes 2025 the worst start for DXY since 1973. But a weaker dollar tends to be a tailwind for risky assets (chart below). One reason might come back to the earnings outlook, where a weaker dollar boosts the international sales and earnings for U.S. companies. That creates another tailwind for the earnings outlook. Emerging market and developed international equities also receive a boost since a weaker dollar helps the return of domestic investors holding international stocks.
A weak dollar environment is also supportive of commodity prices and precious metals. Gold’s march to new highs following a major breakout in late 2023 has received much attention. Silver has more recently been breaking through key levels as well. But on the commodity side, copper prices are close to staging its own breakout to record high levels. The weekly copper chart below shows the ascending triangle pattern forming since late 2023. A breakout from the pattern just over $5.00 per pound would put copper at record highs, and present another challenge to the inflation outlook since copper is highly correlation with long-term inflation expectations.
Investor sentiment and positioning reached extremely bearish levels during the April lows in the stock market. That was a key catalyst in driving a bottom and reversal higher in the stock market. Sentiment has been slow to shift back in the other direction despite the S&P 500’s recovery to fresh record highs. That’s now starting to change based on several measures of investor fear and greed. The AAII survey of retail investors showed a massive jump in bullish outlooks last week, which went to 45.0% compared to 35.1% the week before. The chart below also shows CNN’s Fear & Greed Index, which quickly cycled back to “extreme greed” territory last week.
Heard in the Hub
The Traders Hub features live trade alerts, market update videos, and other educational content for members.
Here’s a quick recap of recent alerts, market updates, and educational posts:
Why liquidity remains a "risk-on" tailwind for stocks.
Profit taking to raise capital for new breakout trades.
July seasonality during post-election years playing out.
The setup in Carvana (CVNA) and the key levels to watch.
You can follow everything we’re trading and tracking by becoming a member of the Traders Hub.
By becoming a member, you will unlock all market updates and trade alerts reserved exclusively for members.
👉You can click here to join now👈
Trade Idea
Atour Lifestyle Holdings Limited (ATAT)
The stock is making a new four-month base after a failed breakout in February. Forming the right side of the base and trading in a tight range as the MACD resets above zero. Watching for a move over $33.50.
Key Upcoming Data
Economic Reports
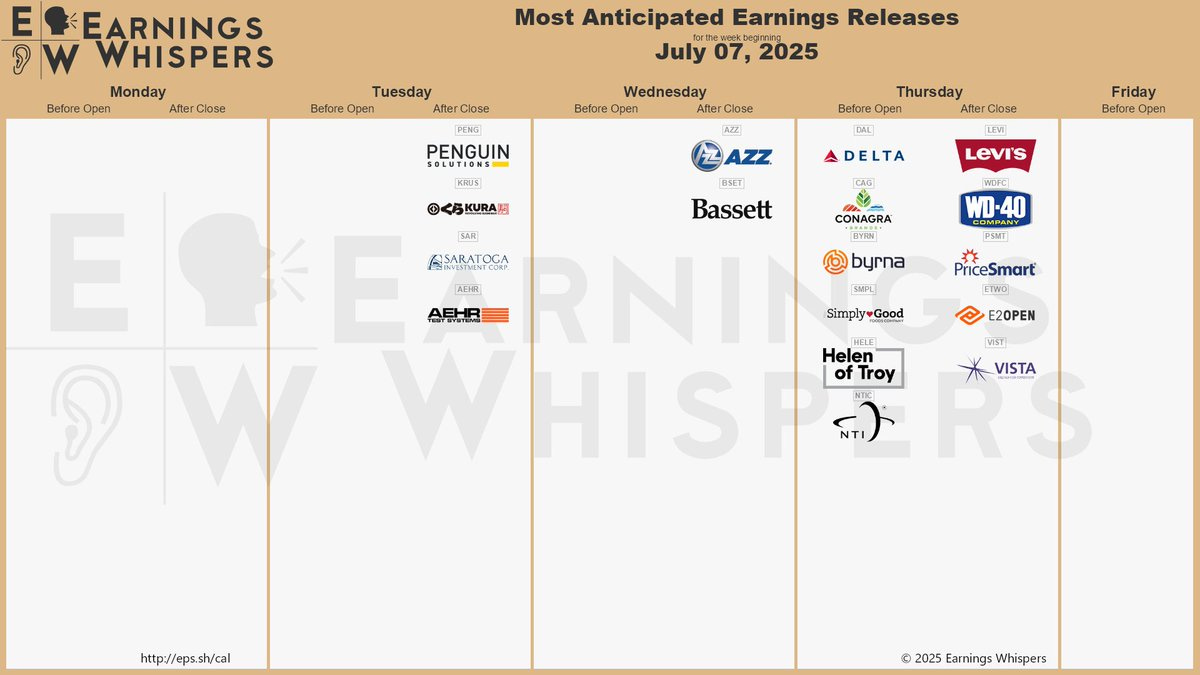
Earnings Reports
I hope you’ve enjoyed The Market Mosaic, and please share this report with your family, friends, coworkers…or anyone that would benefit from an objective look at the stock market.
Become a member of the Traders Hub to unlock access to:
✅Model Portfolio
✅Members Only Chat
✅Trade Ideas & Live Alerts
✅Mosaic Vision Market Updates + More
Our model portfolio is built using a “core and explore” approach, including a Stock Trading Portfolio and ETF Investment Portfolio.
Come join us over at the Hub as we seek to capitalize on stocks and ETFs that are breaking out!
And if you have any questions or feedback, feel free to shoot me an email at mosaicassetco@gmail.com
Disclaimer: these are not recommendations and just my thoughts and opinions…do your own due diligence! I may hold a position in the securities mentioned in this report.


