
The Market Mosaic 7.5.26
No Longer Just the Megacaps: Average Stocks Lead the Way.

👋Welcome back to The Market Mosaic, where I gauge the stock market’s next move by looking at macro, technicals, and market internals. I’ll also highlight trade ideas using this analysis.
If you find this report helpful please hit that “like” button, share this post, and become a subscriber if you haven’t already done so!
🚨And be sure to check out Mosaic Traders Hub. It’s a members-only platform to alert trade ideas, track a model portfolio of open positions, and further analyze the message coming from the capital markets.
Now for this week’s issue…
The start of the third quarter greeted investors with a worse than expected jobs report for June along with negative revisions to prior months…putting a question mark on the health of the labor market.
The economy created just 57,000 jobs during June compared to estimates for 115,000, while May and April’s figures were revised lower by a combined 74,000 jobs. The unemployment rate ticked down to 4.2% on a drop in labor force participation.
Investors initially cheered the report with a rally in stock index futures, signaling a regime where bad economic news is good for equities. As the outlook for monetary policy becomes more hawkish, a softer jobs report could delay rate hikes from the Federal Reserve.
But the reality is that the jobs report likely hit the “Goldilocks” zone, and wasn’t bad enough to stoke growth concerns while also not strong enough to pull forward additional tightening from the Fed.
Even with the softer June jobs report, overall the recent trend in payrolls is inflecting higher based on the three- and six-month moving averages (chart below). Other economic reports received during the week reinforces the growth outlook.

That includes the ISM Manufacturing PMI that measures activity in the manufacturing sector of the economy. While the headline figure decelerated from prior report, it remained well into expansion territory while the leading new orders component points to growth ahead as well.
Signs of broadening economic activity helped send the S&P 500 higher by about 15% in the second quarter that ended last week, which was the best showing in six years. The final month of the quarter also saw market breadth spread beyond the tech sector and AI infrastructure trade.
This week, let’s look at the bullish continuation pattern forming in the S&P 500 while new 52-week highs are expanding across the market. We’ll also look at evidence that economic growth is broadening across industries.
The Chart Report
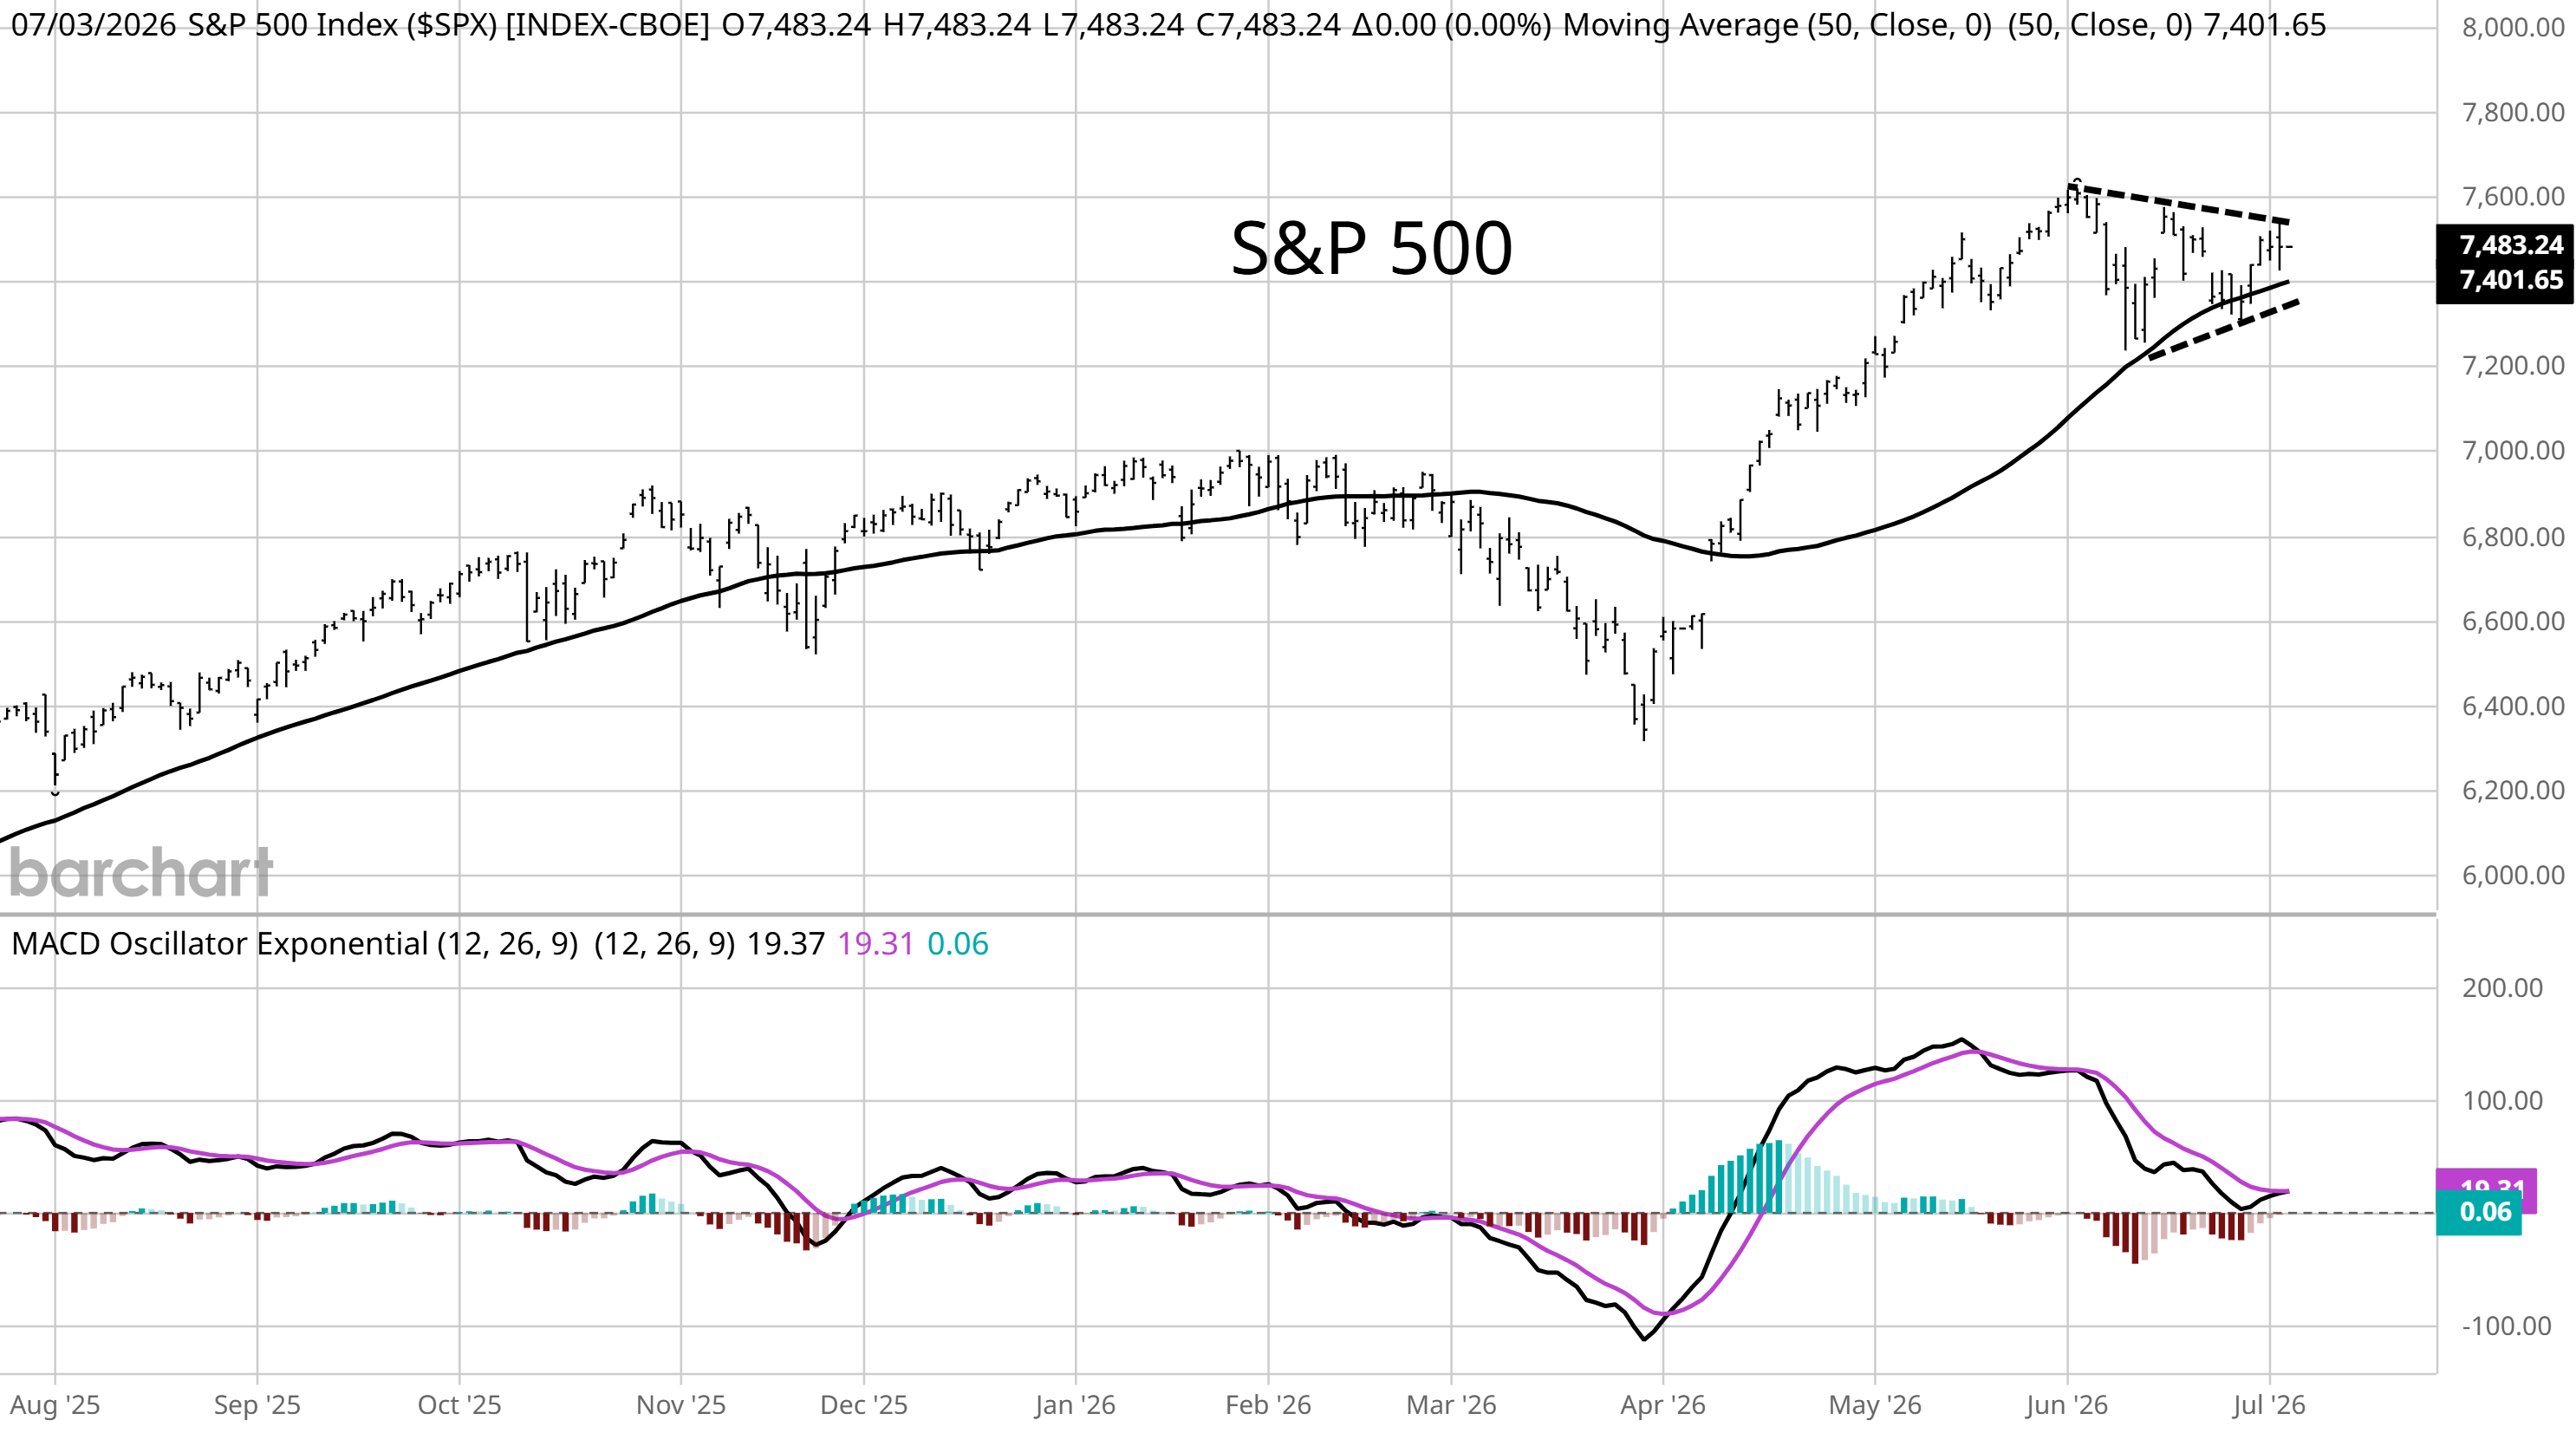
Although the S&P 500 is coming off a hot second quarter with a 15% gain, the index topped in early June and has yet to make a new high. But the S&P 500 trading within a bullish continuation pattern and has been finding support at a key level. The dashed lines in the chart below show the symmetrical triangle pattern, which tends to resolve in the direction preceding the pattern (higher in this case). As the pattern has filled out, the S&P is finding support at the 50-day moving average (black line). The consolidation is also allowing the index to reset the MACD above the zero line, which is a bullish momentum reset. The pattern is forming against the backdrop of positive calendar seasonality in July and elevated bearish sentiment among retail investors.
While the June jobs report came in weaker than expected, other reports of economic activity are holding up. That includes surveys of business activity across manufacturing and services sectors. The ISM’s manufacturing survey remains above the key 50 level, indicating expansion in that sector of the economy. Underlying components are evolving favorably as well. The new orders figure was reported at 56, indicating growth and is considered a leading indicator of economic activity. Within the manufacturing report, the number of industries reporting growth is jumping higher and is a the best level since 2023 (chart below). That shows economic activity broadening beyond AI infrastructure capex spending.

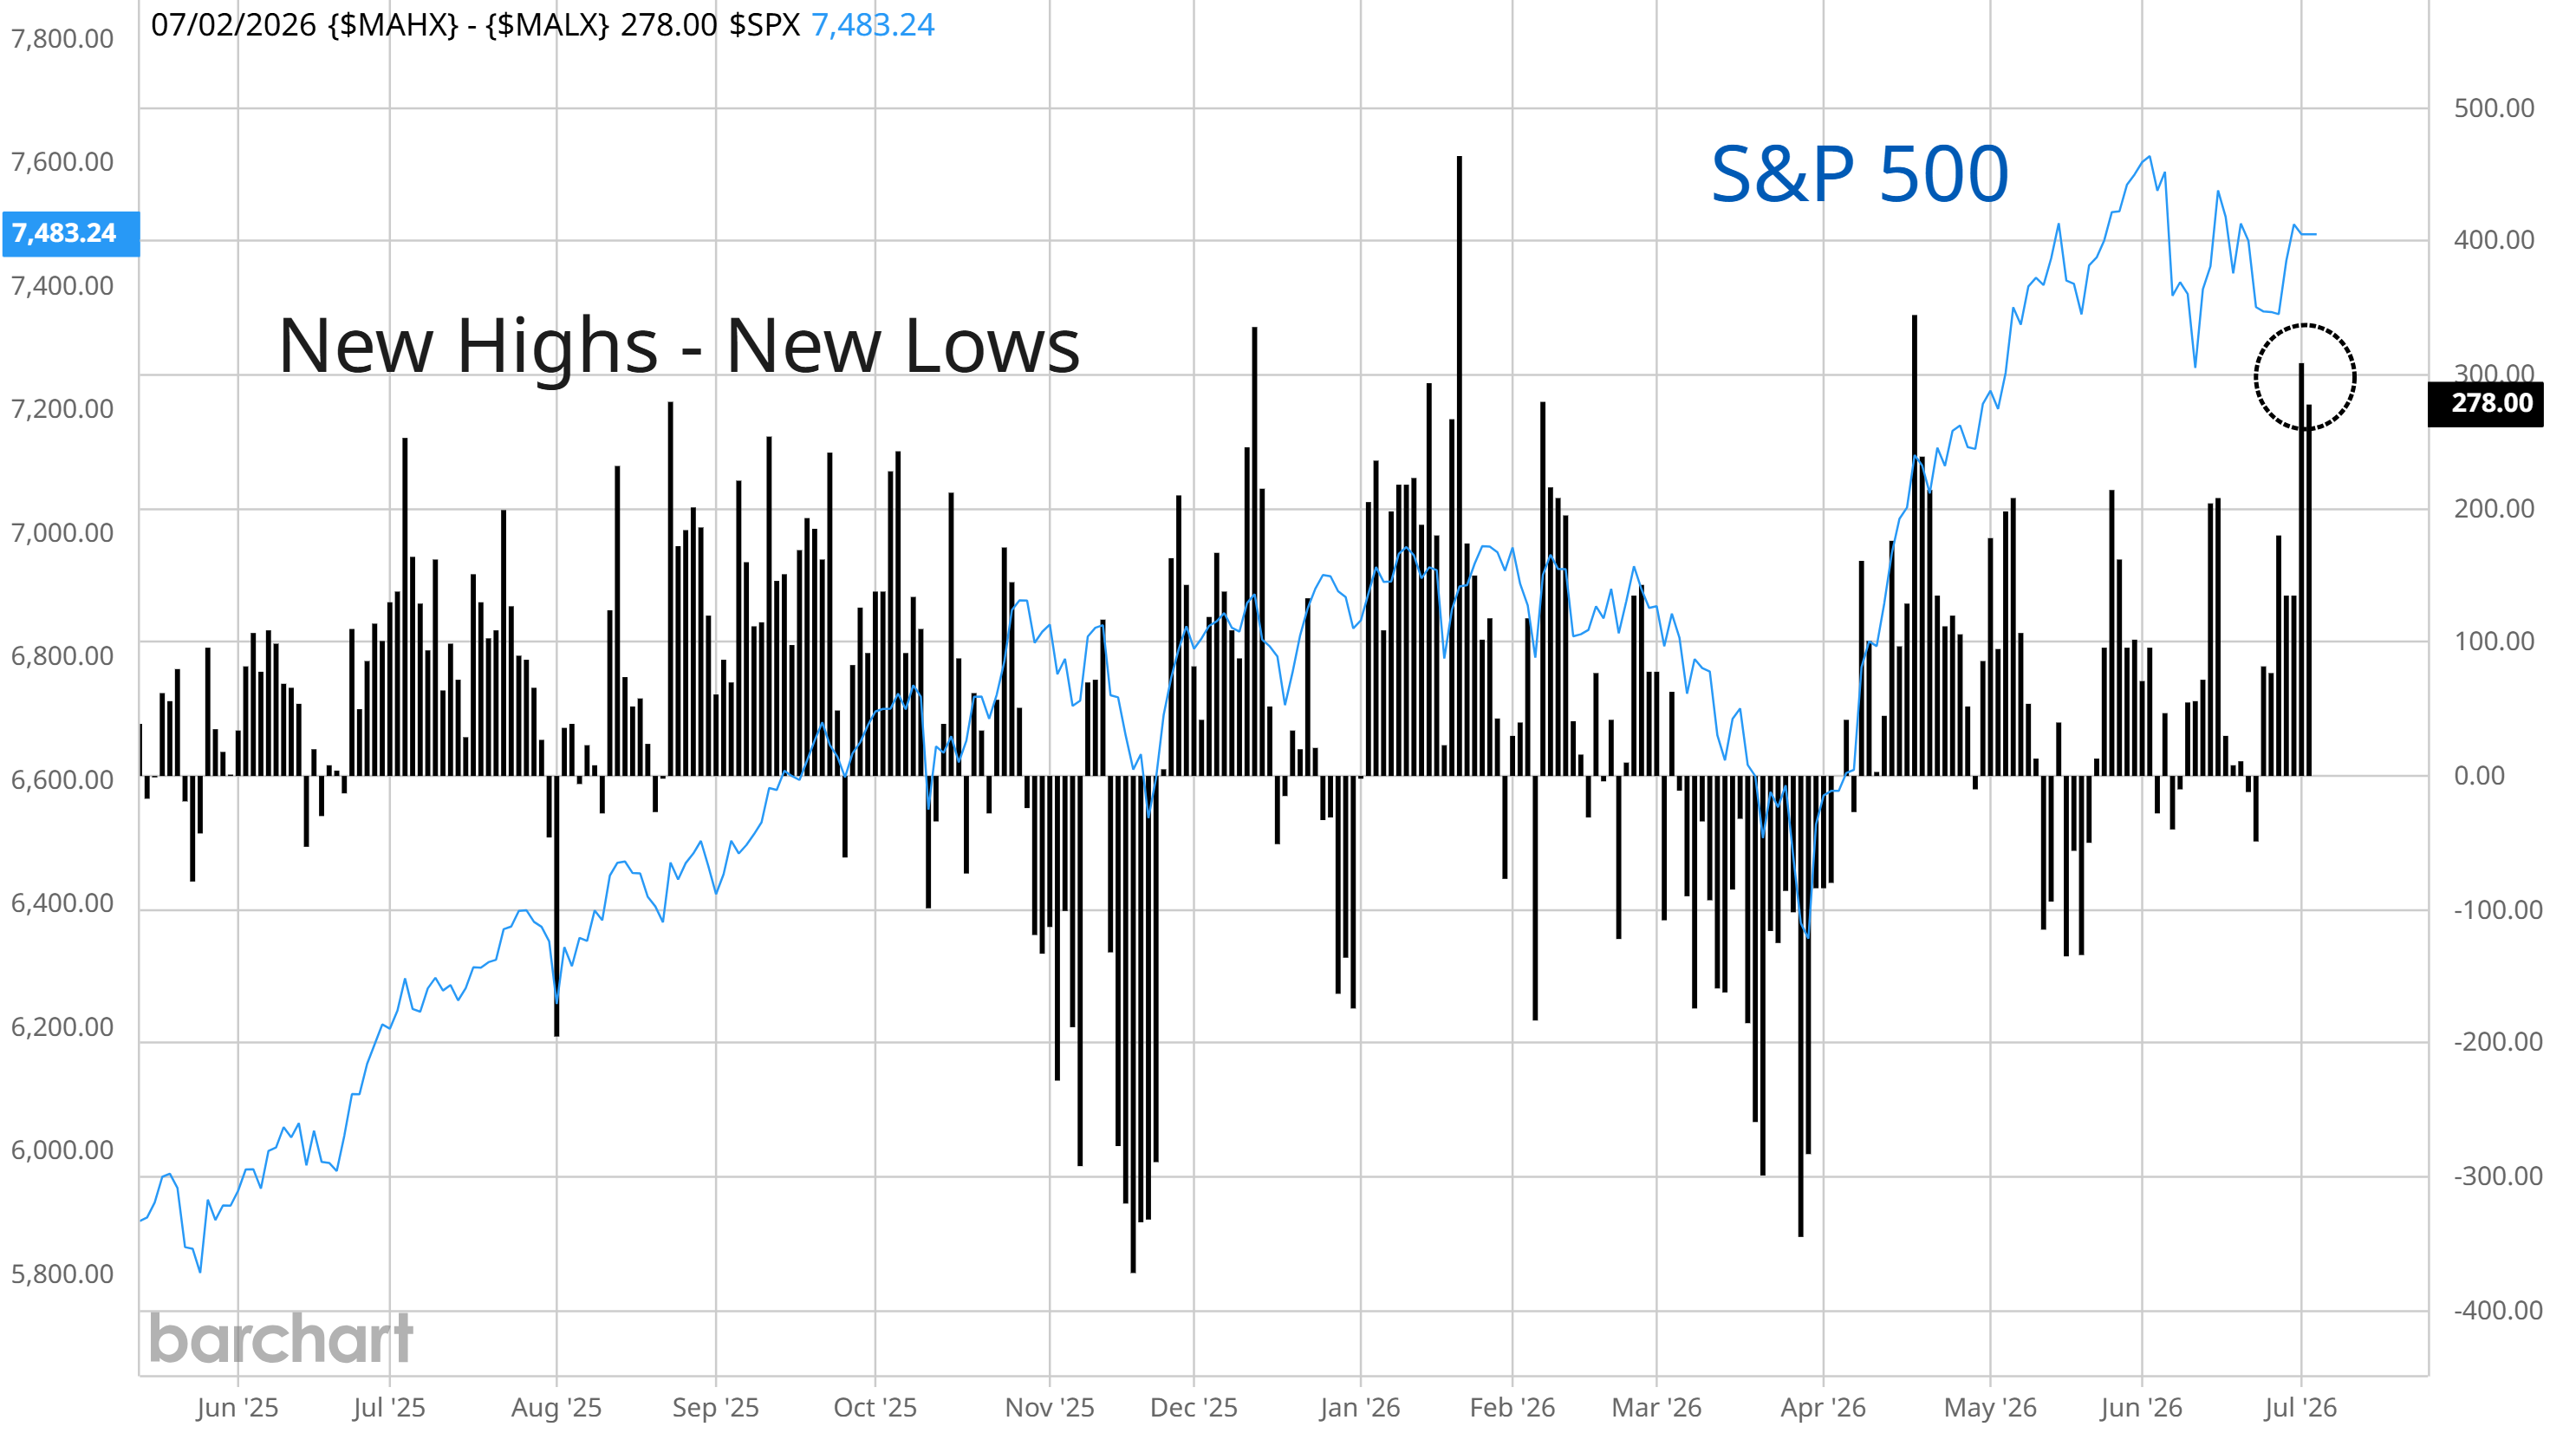
While the S&P 500 has been consolidating since the start of June, the average stock has been rallying to new record highs. That includes the equal-weight S&P 500, small-cap stocks with the Russell 2000 Index, and the NYSE advance/decline line. New highs minus new lows across major exchanges are jumping higher as well. The chart below shows net new 52-week highs which jumped to the highest daily reading since April and is one of the largest figures of the past year. Improving breadth shows the foundation of the bull market broadening, which is positive for the outlook for forward returns.
Stock prices are a discounting mechanism for future business conditions, and will often turn six- to 12-months before an inflection in earnings. With that in mind, keep a close eye on semiconductor indexes that have gone parabolic around optimism for AI-driven earnings from the capex spend. But the move in semiconductor stocks will likely peak before its apparent the earnings cycle is turning. That’s the lesson from another semiconductor earnings boom heading into the internet bubble peak in 2000. The chart below plots semiconductor stocks in the top panel along with earnings (bottom panel) heading into the 2000 peak. Chip company earnings kept moving higher for nearly a year after chip stock prices peaked.

Heard in the Hub
The Traders Hub features live trade alerts, market update videos, and other educational content for members.
Here’s a quick recap of recent alerts, market updates, and educational posts:
Why liquidity remains a bullish tailwind.
This software stock doesn’t care about AI’s threat.
What seasonality says about midterm election years.
Labor market data turning a corner ahead of payrolls.
How to use weekly charts to pinpoint support and resistance levels.
You can follow everything we’re trading and tracking by becoming a member of the Traders Hub.
By becoming a member, you will unlock all market updates and trade alerts reserved exclusively for members.
Trade Idea
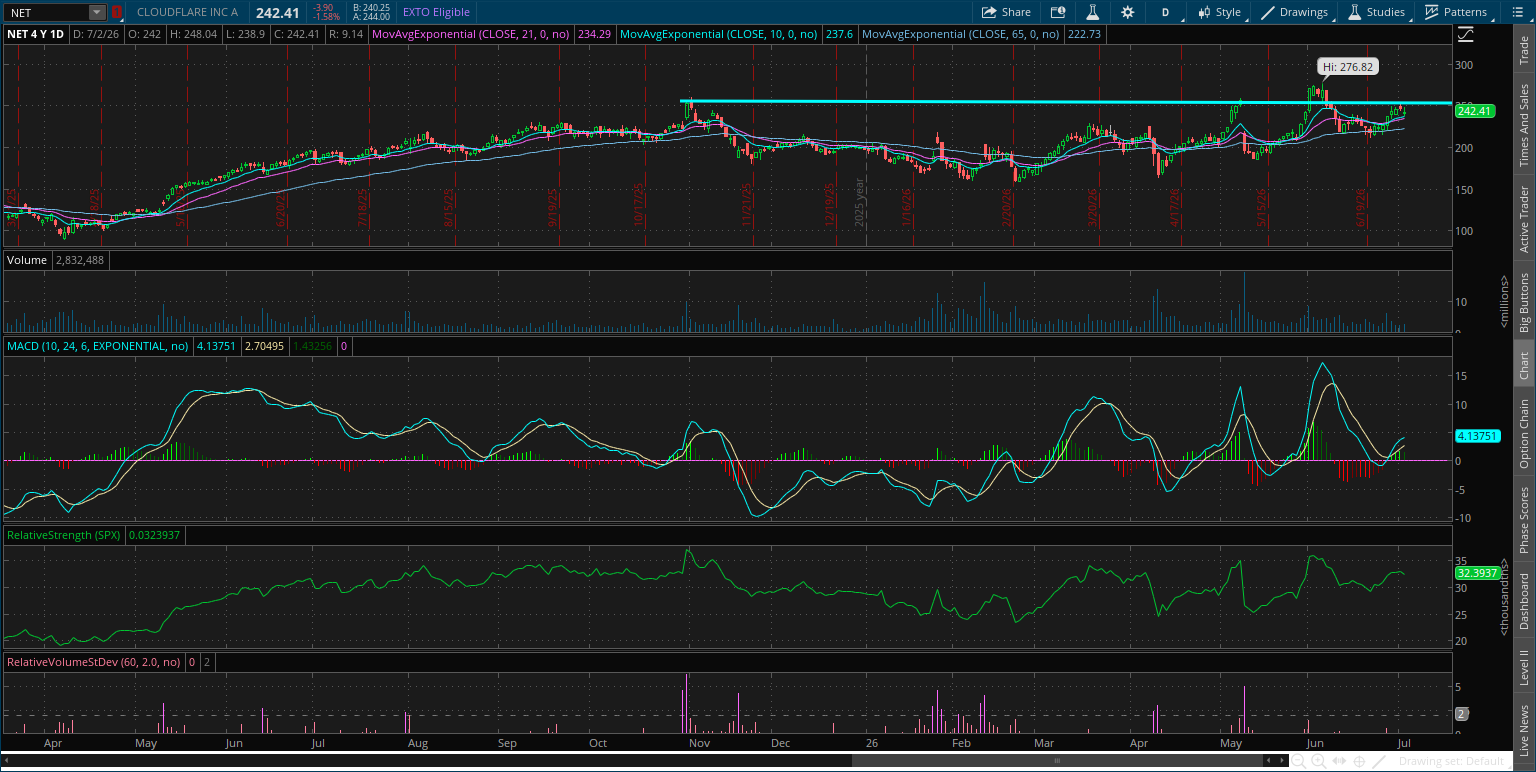
Cloudflare (NET)
Watching a new pattern after a failed break above the $250 level. The weekly chart shows this level is still in play as the stock makes a smaller pullback and resets the MACD above the zero line. I’m watching for an initial move over $250.
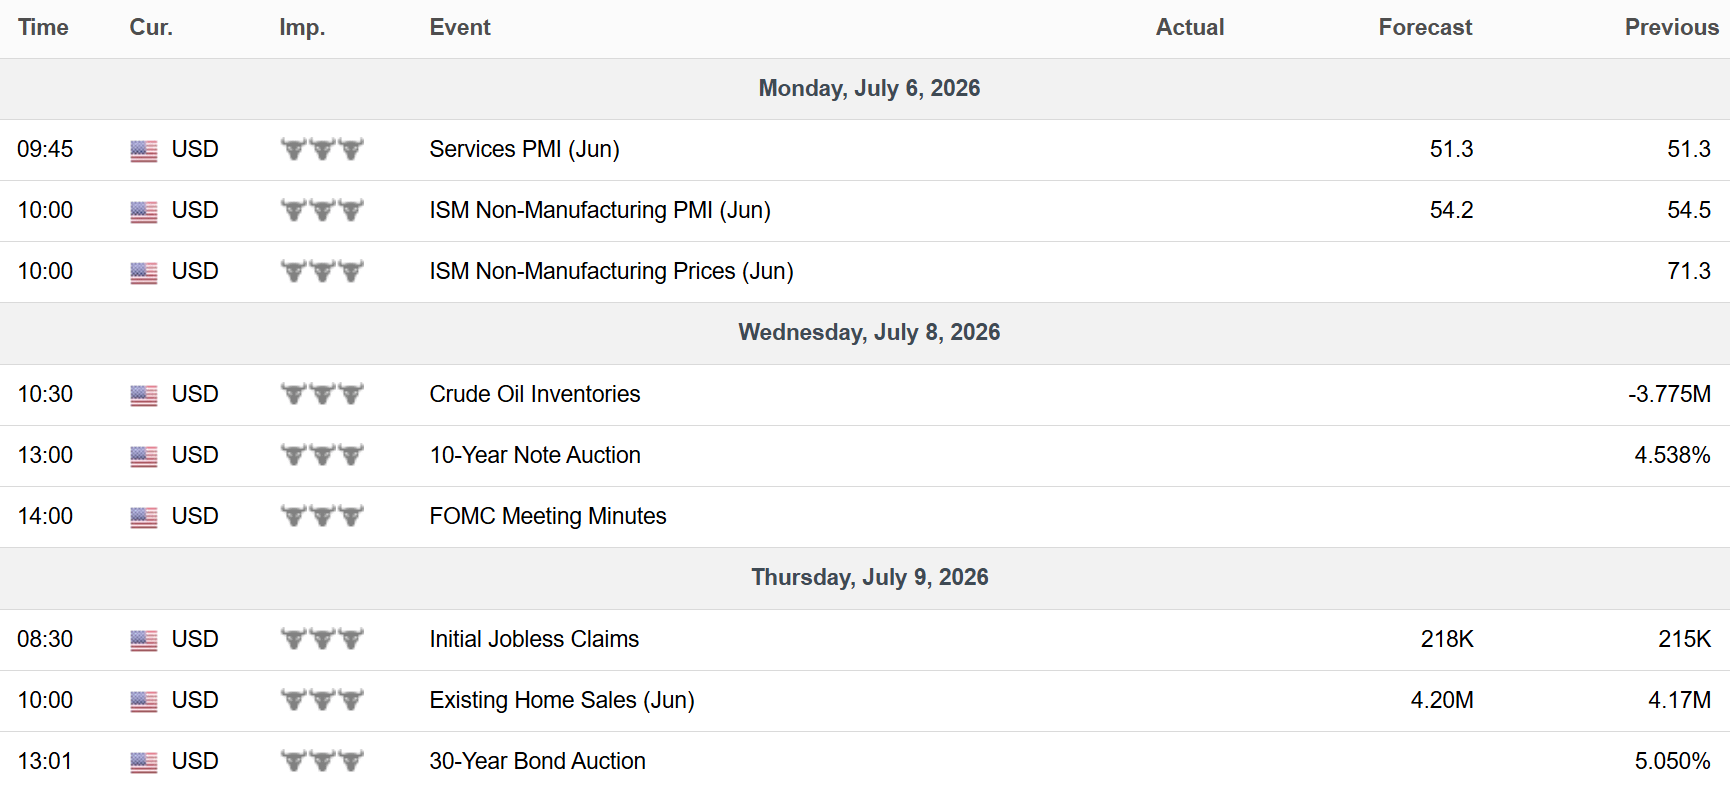
Key Upcoming Data
Economic Reports
Earnings Reports

I hope you’ve enjoyed The Market Mosaic, and please share this report with your family, friends, coworkers…or anyone that would benefit from an objective look at the stock market.
Become a member of the Traders Hub to unlock access to:
✅Model Portfolio
✅Members Only Chat
✅Trade Ideas & Live Alerts
✅Mosaic Vision Market Updates + More
Our model portfolio is built using a “core and explore” approach, including a Stock Trading Portfolio and ETF Investment Portfolio.
Come join us over at the Hub as we seek to capitalize on stocks and ETFs that are breaking out!
And if you have any questions or feedback, feel free to shoot me an email at mosaicassetco@gmail.com
Disclaimer: these are not recommendations and just my thoughts and opinions…do your own due diligence! I may hold a position in the securities mentioned in this report.