
The Market Mosaic 7.27.25
Liquidity driving market rally amid surging risk appetite.

👋Welcome back to The Market Mosaic, where I gauge the stock market’s next move by looking at macro, technicals, and market internals. I’ll also highlight trade ideas using this analysis.
If you find this report helpful please hit that “like” button, share this post, and become a subscriber if you haven’t already done so!
🚨And be sure to check out Mosaic Traders Hub. It’s a members-only platform to alert trade ideas, track a model portfolio of open positions, and further analyze the message coming from the capital markets (👇be sure to check out our special offer below).
Now for this week’s issue…
Easing trade tensions and liquidity tailwinds are sending the S&P 500 to fresh record highs while volatility falls to the lowest levels since the start of the year.
President Trump announced that a trade deal with Japan had been reached, and that negotiations with the European Union are coming along. There’s also reports that Trump will travel to China in the “not-to-distant future”, triggering hopes that more agreements with key trading partners will be completed.
Other factors are supporting the risk-on move across the capital markets. That includes the liquidity backdrop, where a broad measure of the U.S. money supply rose by 4.5% year-over-year to reach a new record high.
The chart below shows the level of M2, where you can see the previous peak in early 2021 and drop in the money supply that aligned with 2022’s bear market. M2 bottomed and has been recovering since 2023, and is now making a new record high alongside major stock indexes.

Other reports are delivering evidence that the economy is holding steady just as the second quarter earnings season gets underway. That includes initial jobless claims that fell to 217,000 and remains near historically low levels.
The S&P 500 gained 1.5% on the week and closed at a fresh record high. The grind higher on the major indices is also sending volatility to their lowest levels since the start of the year.
Even though the S&P 500 has spent 68 consecutive days above its 20-day moving average, there is still skepticism behind the rally. The AAII survey of retail investors shows bearish views on the stock market at 34% compared to the historical average of 31%.
This week, let’s look at the historic nature of the S&P 500’s recovery from the early April lows. We’ll also look at why the average stock outside the “Mag 7” is becoming critical to sustaining the rally and why the Federal Reserve may be cornered on rate cuts for the rest of the year.
The Chart Report
The early April bottom in the S&P 500 and subsequent rally is setting records across a number of metrics. Back on April 9, the NYSE advance/decline volume ratio hit 72 which is the highest reading on record. That showed institutional investors were rushing to buy the brief plunge into bear market, and was followed by other thrust indicators like the Zweig Breadth Thrust. That’s given way to a period of persistent momentum in the S&P, with the index staying above the short-term 20-day moving average for 68 consecutive days (chart below) and is the longest stretch in nearly 30 years.

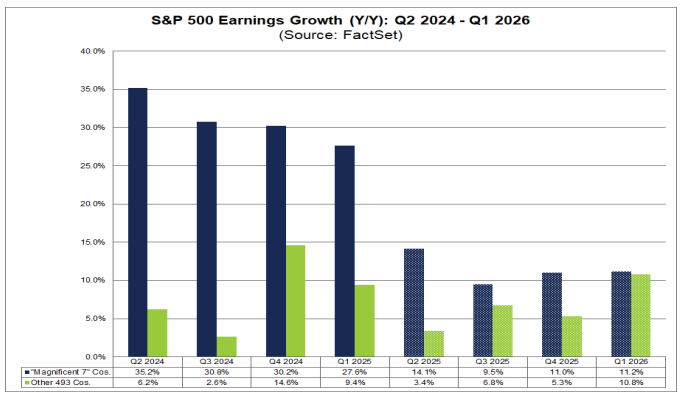
While breadth expansion was an early feature of the rally off the April lows, the average stock in the S&P 500 has been slow to catch the index until now. The Invesco S&P 500 Equal Weight ETF (RSP) tracks the average stock in the S&P and is joining the capitalization-weighted index in making new all-time highs. Better participation by the average stock will be needed to keep the bull market outlook intact, especially as the earnings growth contribution from the “Magnificent 7” looks set to trail off over the coming quarters. You can see that Mag 7 earnings growth starts to trail off quickly starting this quarter relative to last year’s pace (blue bars), while the other 493 (green bars) in the S&P 500 are expected to see accelerating growth rates over the coming year.
The rally in the stock market is starting to bear resemblance to prior periods of speculative risk taking. The appetite for more speculative stocks is on the rise, with global IPOs recording 539 listings and a 17% increase in proceeds during the first half of 2025 compared to last year. There’s also been a spike in the number of companies coming to market via SPAC, which was a popular vehicle in 2021’s bull market. Goldman Sachs tracks a speculative indicator (chart below) looking at volumes in unprofitable stocks, penny stocks, and companies with extremely excessive valuations relative to sales. It’s on the rise, and recently hit the highest level in over two years.

The steady gains in the stock market is driving the VIX back toward its lowest levels of the year. The CBOE Volatility Index (VIX) closed last week at 14.93, which lowest close since February when the S&P made its high before plunging into a bear market. But based on historic seasonal trends, July tends to mark a low point for volatility before a jump over the next couple months (chart below). Low volatility during July reflects the fact that it’s also the best month for S&P returns on average going back to 1928. But calendar seasonality gets more choppy into September and October, which tends to drive the VIX higher.

While the pace of quarterly earnings reports continues running at a high pace next week, investor attention will be fixated on the Federal Reserve’s rate-setting meeting. That comes following a high profile visit by President Trump to see renovations at the Fed’s headquarters and to apply further pressure to Fed Chair Jerome Powell to cut interest rates. While the July meeting is widely expected to see no change in rates, investors will be looking for clues on rate cuts during the remaining meetings of the year. Fears over inflation will continue to be a restraining factor on the outlook, with evidence of tariffs impacting the most recent Consumer Price Index (CPI) report. The prices paid component of business surveys are also pointing the way higher. The chart below shows the output prices component (blue line) from the S&P Global PMI report against CPI (orange line). Major inflections in output prices tends to lead CPI historically.

Heard in the Hub
The Traders Hub features live trade alerts, market update videos, and other educational content for members.
Here’s a quick recap of recent alerts, market updates, and educational posts:
Gold’s breakout from a bullish continuation pattern.
The setup I’m watching in a quantum computing stock.
Why the CPI and PPI shows tariffs are driving price increases.
A key chart level on inflation breakeven rates delivering a warning.
This artificial intelligence stock could become the next great AI trade.
You can follow everything we’re trading and tracking by becoming a member of the Traders Hub.
By becoming a member, you will unlock all market updates and trade alerts reserved exclusively for members.
🚨Our recent 142% gain in RKLB would cover a subscription for two years if you apply this discount found in the link below:
👉You can click here to join now👈
Trade Idea
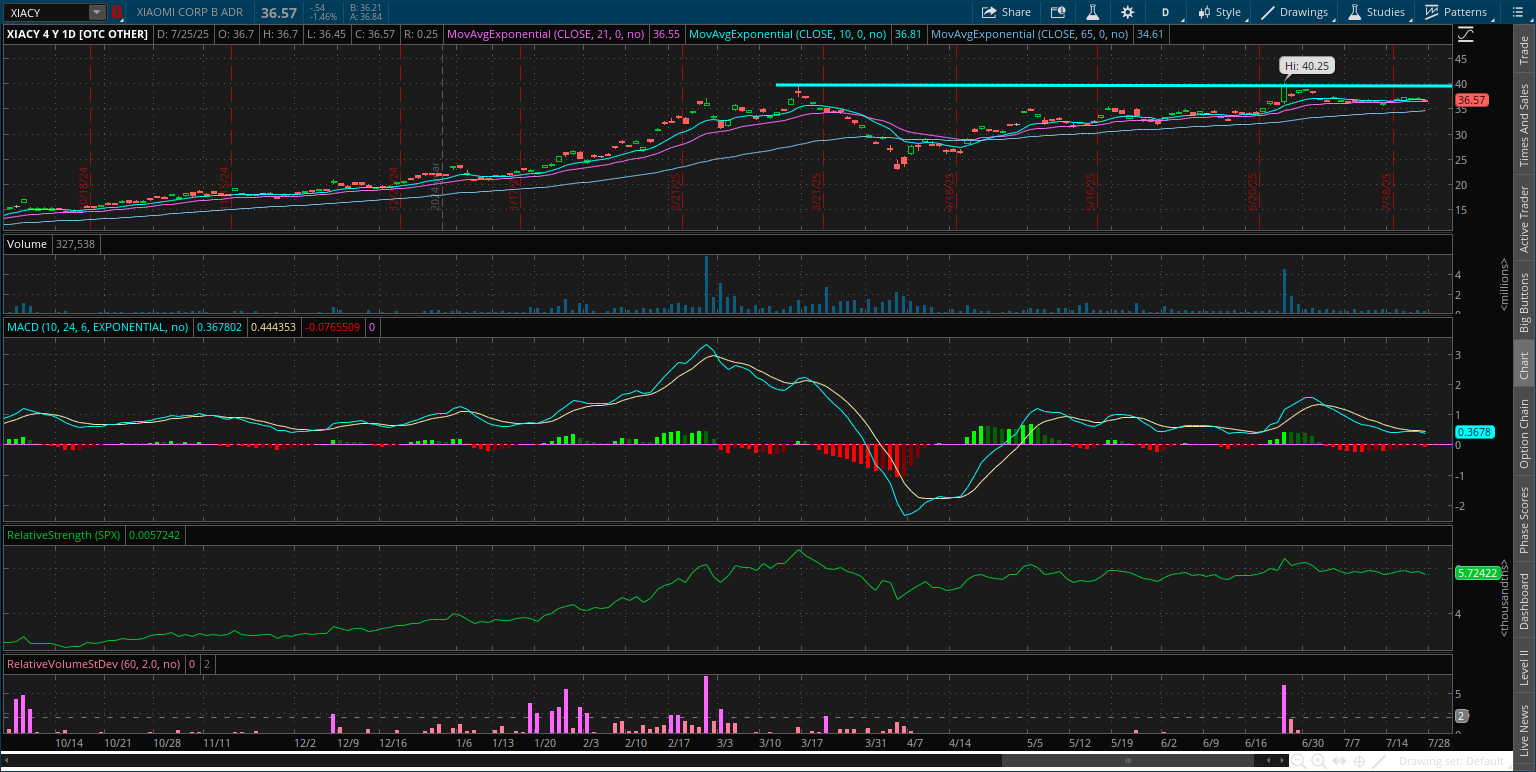
Xiaomi (XIACY)
The stock rallied to the $40 level in March and is recently testing that level once again. Pulling back in recent sessions after a large candle failed to breakout. That’s resulting in a smaller pullback and MACD reset. I’m watching for a move over $40.
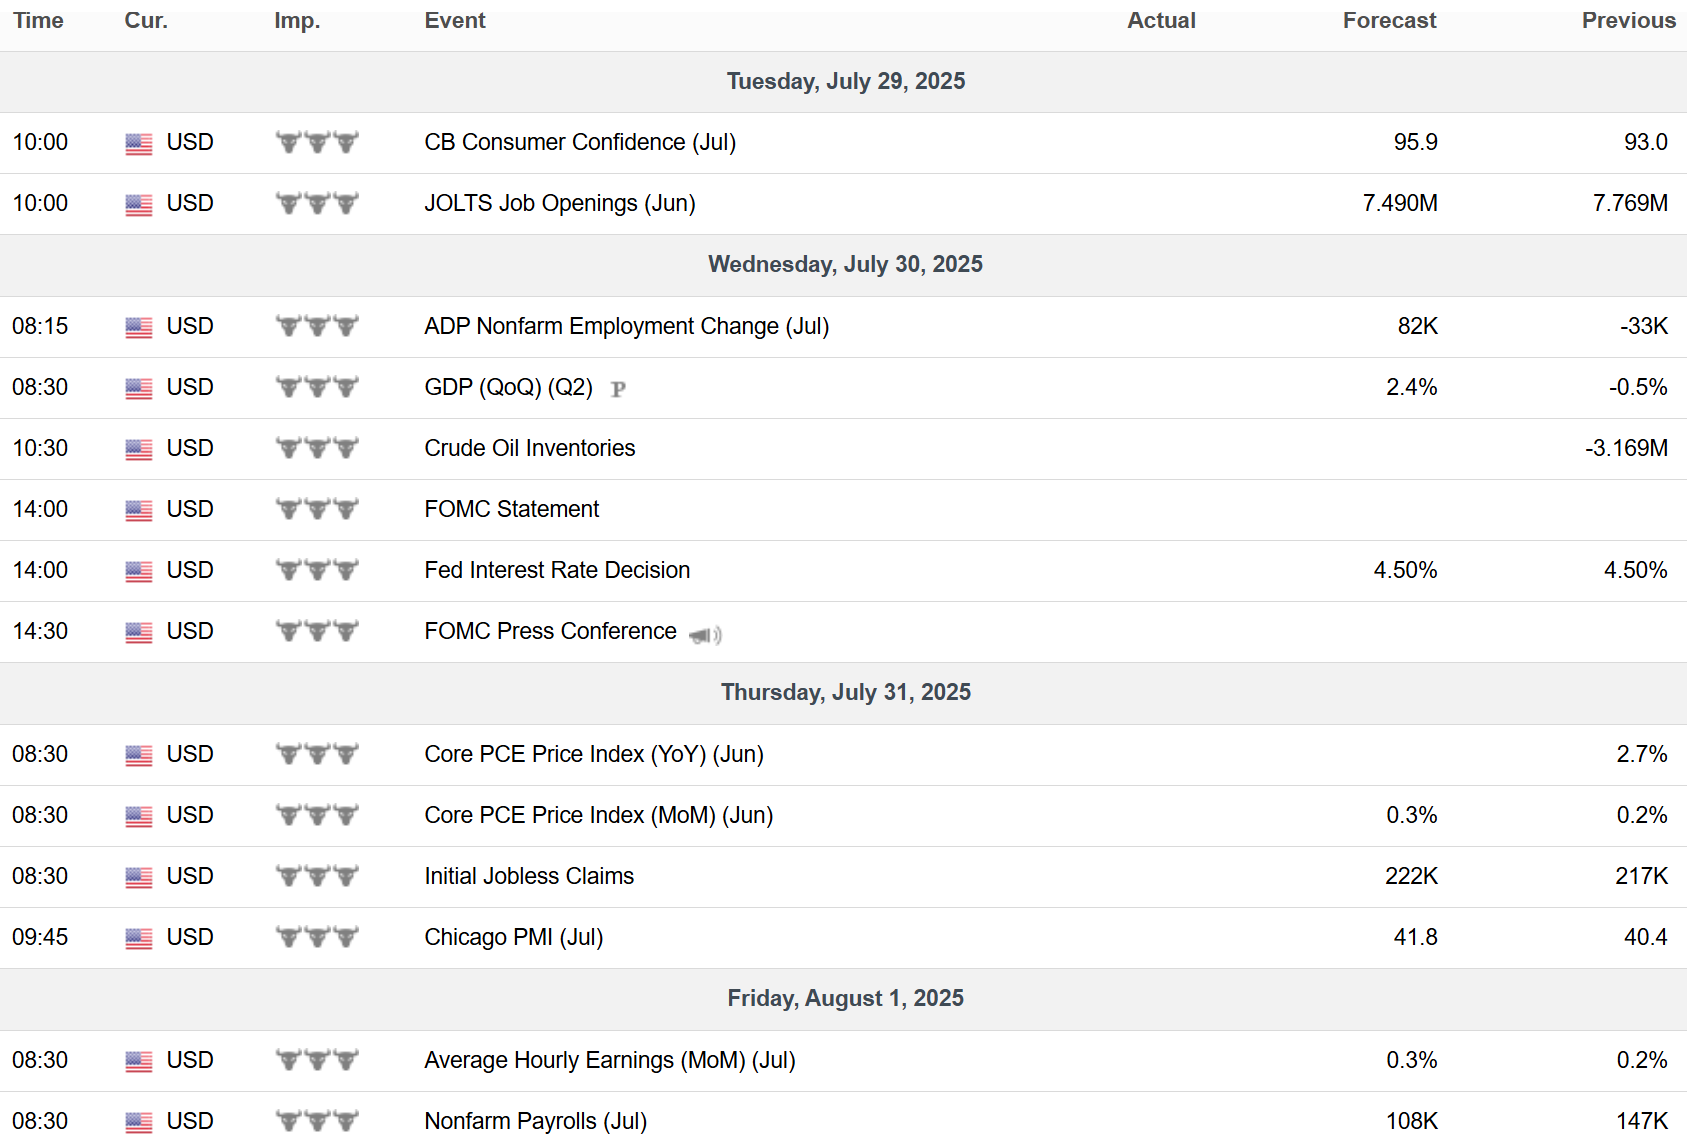
Key Upcoming Data
Economic Reports
Earnings Reports

I hope you’ve enjoyed The Market Mosaic, and please share this report with your family, friends, coworkers…or anyone that would benefit from an objective look at the stock market.
Become a member of the Traders Hub to unlock access to:
✅Model Portfolio
✅Members Only Chat
✅Trade Ideas & Live Alerts
✅Mosaic Vision Market Updates + More
Our model portfolio is built using a “core and explore” approach, including a Stock Trading Portfolio and ETF Investment Portfolio.
Come join us over at the Hub as we seek to capitalize on stocks and ETFs that are breaking out!
And if you have any questions or feedback, feel free to shoot me an email at mosaicassetco@gmail.com
Disclaimer: these are not recommendations and just my thoughts and opinions…do your own due diligence! I may hold a position in the securities mentioned in this report.