

👋Welcome back to The Market Mosaic, where I gauge the stock market’s next move by looking at macro, technicals, and market internals. I’ll also highlight trade ideas using this analysis.
If you find this report helpful please hit that “like” button, share this post, and become a subscriber if you haven’t already done so!
🚨And be sure to check out Mosaic Traders Hub. It’s a members-only platform to alert trade ideas, track a model portfolio of open positions, and further analyze the message coming from the capital markets.
Now for this week’s issue…
Interest rates across the yield curve are on the rise while major stock market indexes are breaking below key support levels.
A crumbling ceasefire between the U.S. and Iran is halting traffic through the Strait of Hormuz once again and causing a jump in oil prices. Oil has gone from $69 per barrel at the start of July to $89 currently.
While the most recent Consumer Price Index (CPI) report for June showed moderating inflation from a pullback in energy prices, the resurgence of the conflict in the Middle East is pressuring the inflation outlook all over again.
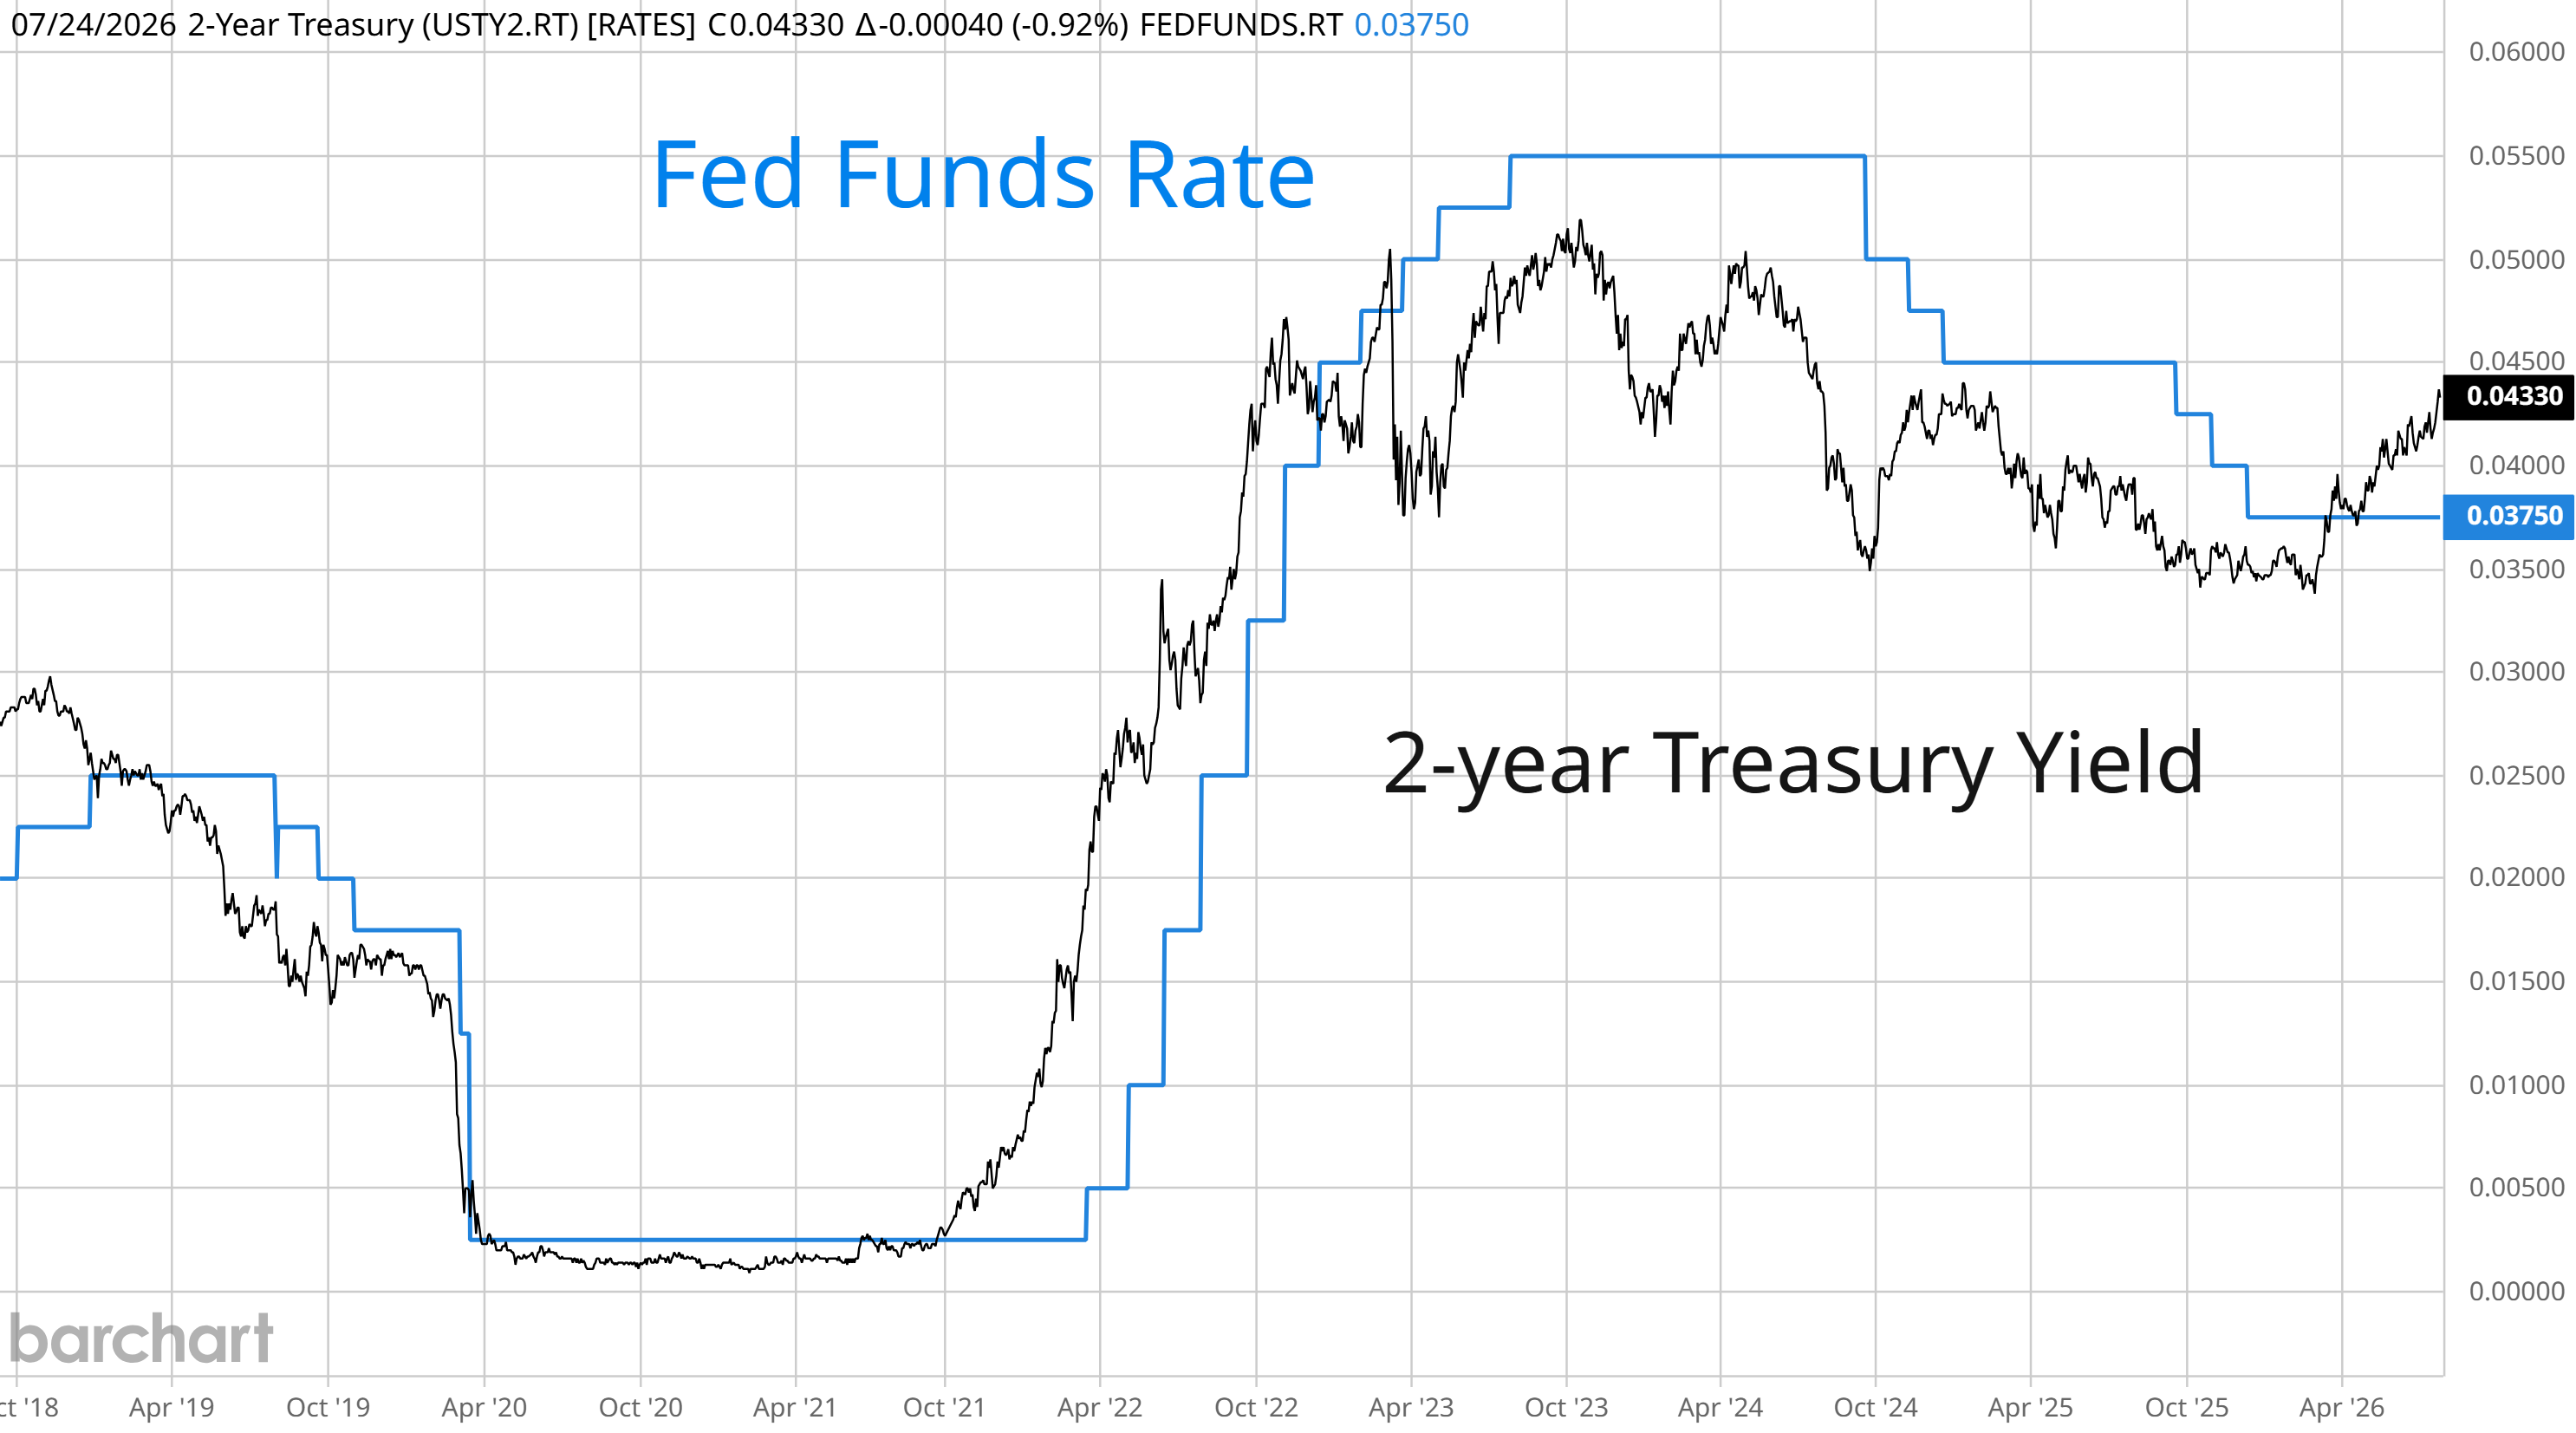
The 2-year Treasury yield that tends to lead key inflection points in monetary policy hit a fresh high for 2026 at 4.37%, and is the highest level since the start of 2025. It also sits well above the current target for the fed funds rate.
The 30-year Treasury yield is also testing a key breakout level once again. In May, the 30-year yield saw a false break above the 5% level which has served as resistance since late 2023. With oil prices on the rise and the inflation outlook uncertain, the 30-year is attempting another breakout (chart below).
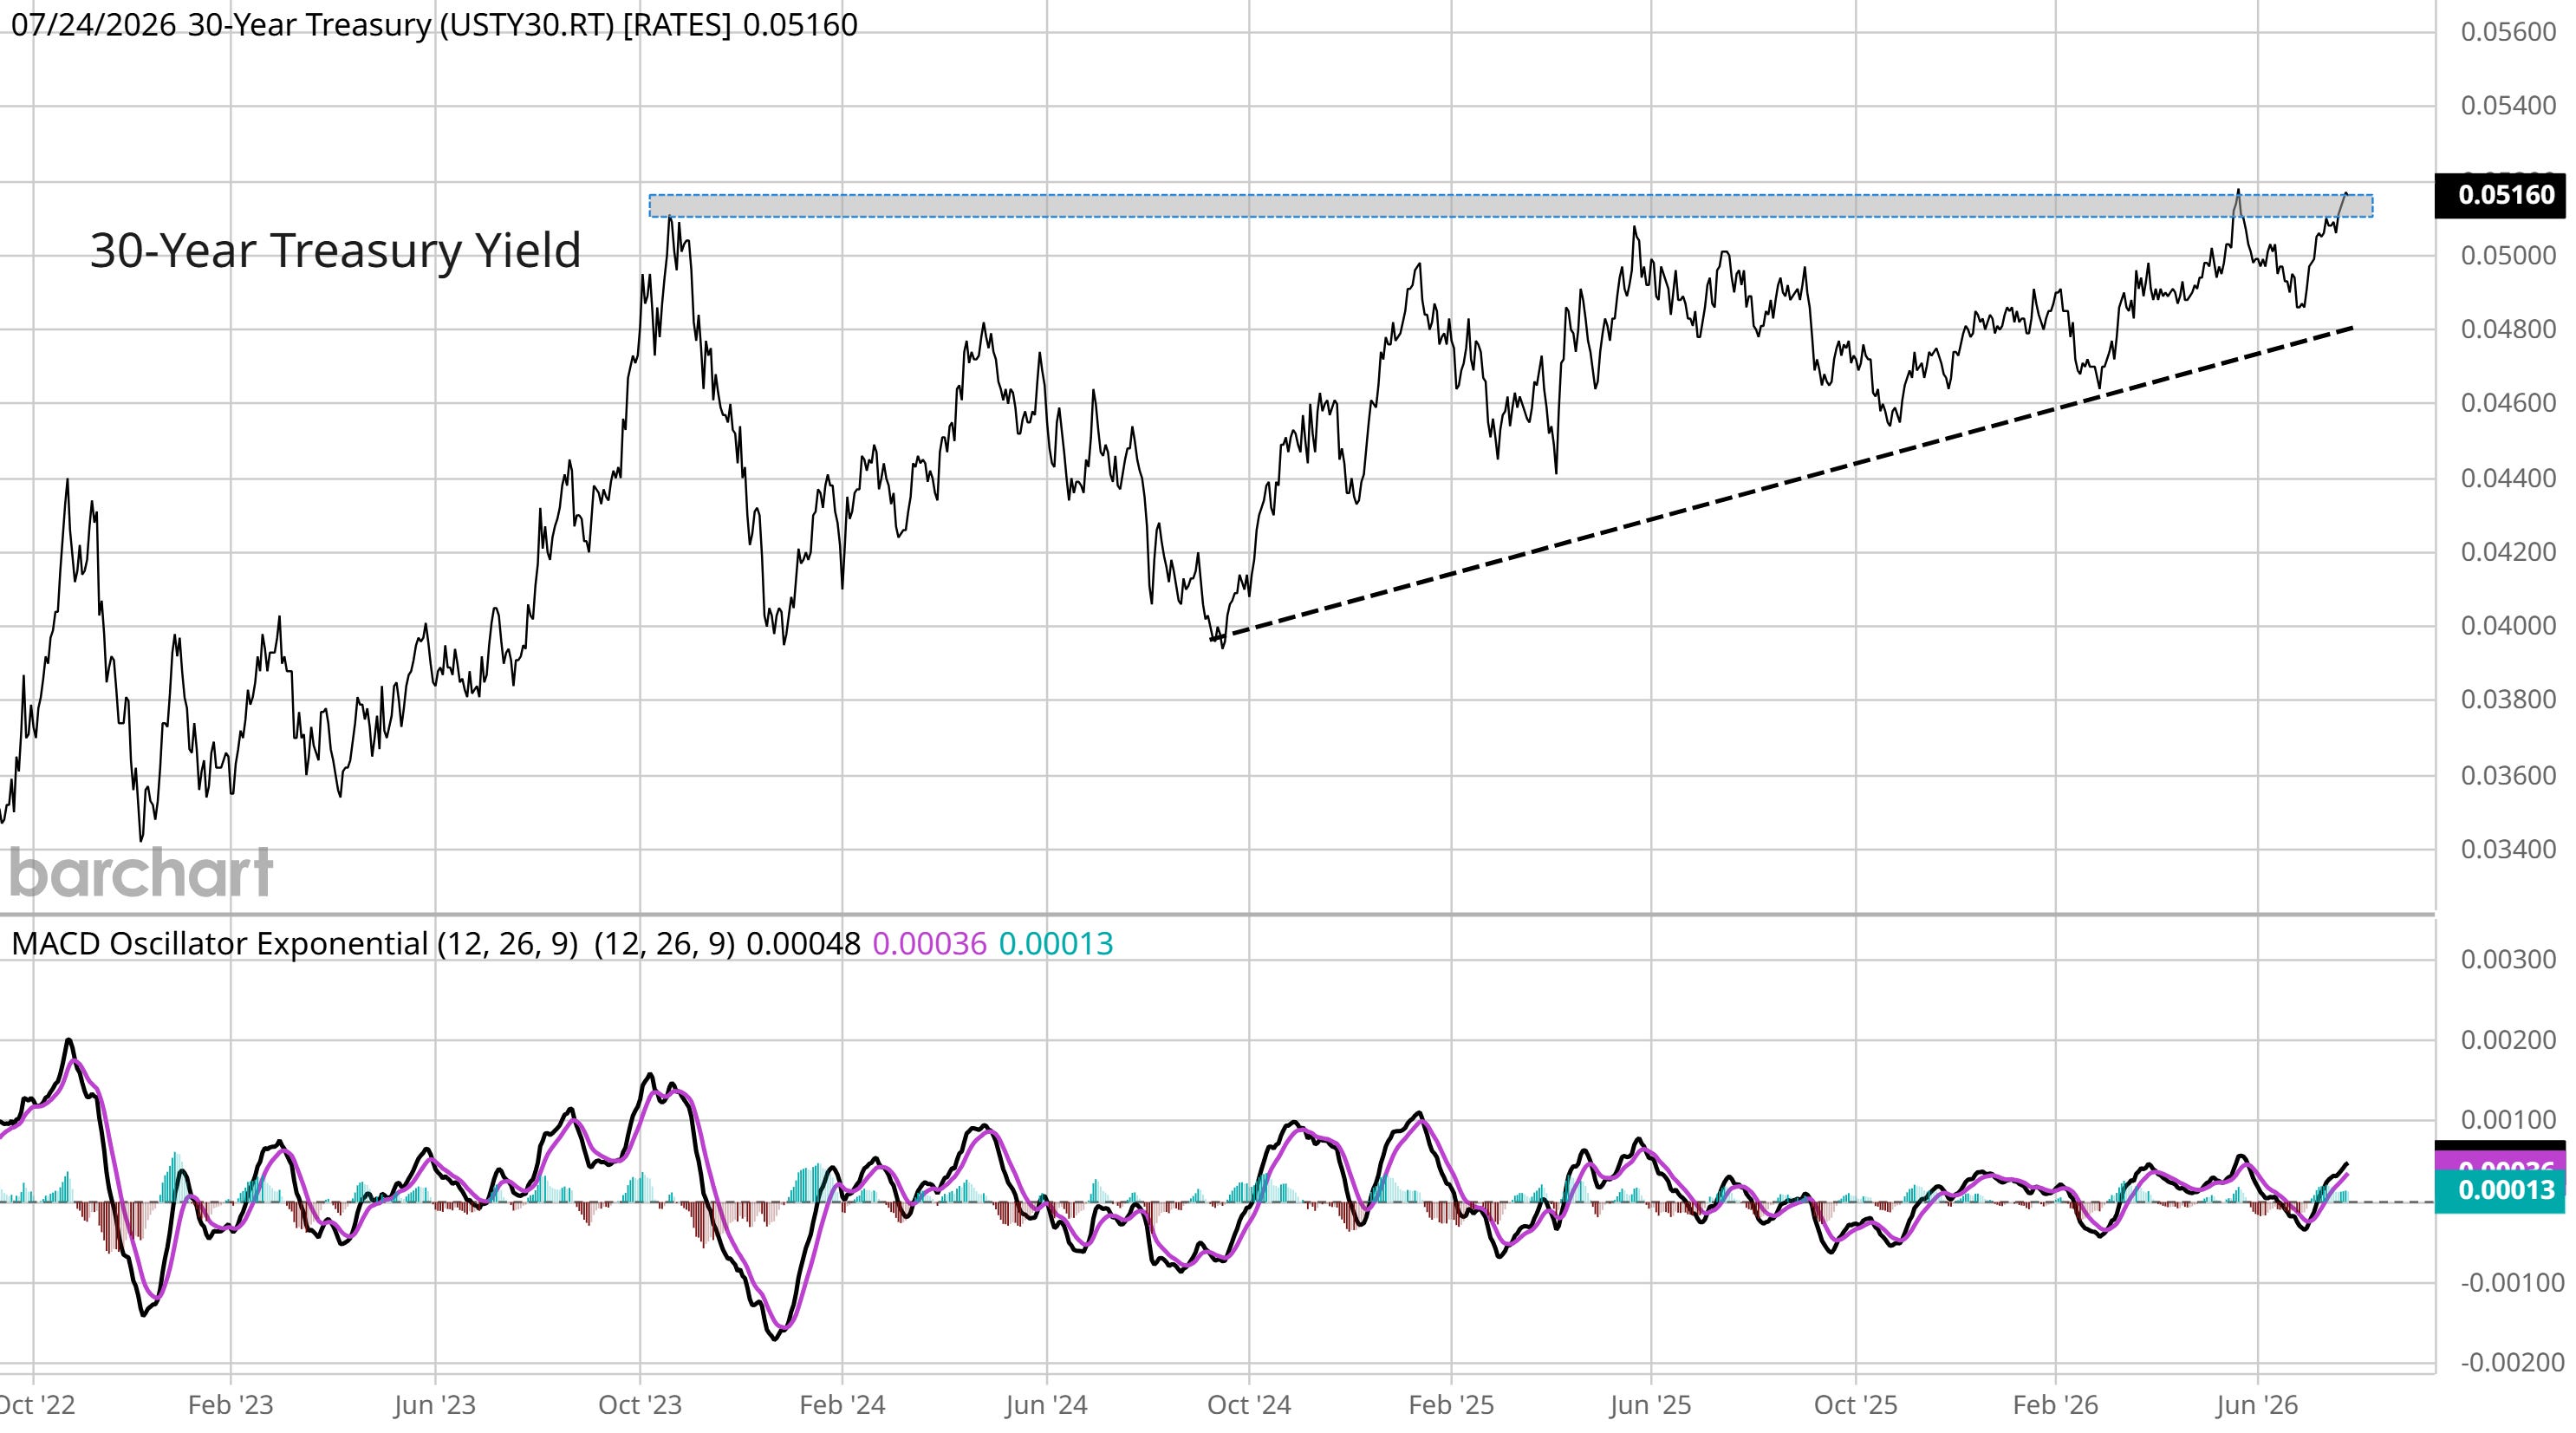
Rising rates across the yield curve could keep pressuring stock prices, where indexes like the S&P 500 and Nasdaq peaked in early June and are now losing key support levels.
At the same time, market breadth is deteriorating while the backdrop for seasonality is transitioning from a bullish tailwind to bearish headwind. Seasonality during mid-term election years also tends to produce lower average returns and larger drawdowns.
This week, let’s look at the bearish headwinds stacking up against the stock market across breadth and historic seasonal trends. We’ll also look at the chart pointing to interest rate hikes happening soon.
The Chart Report
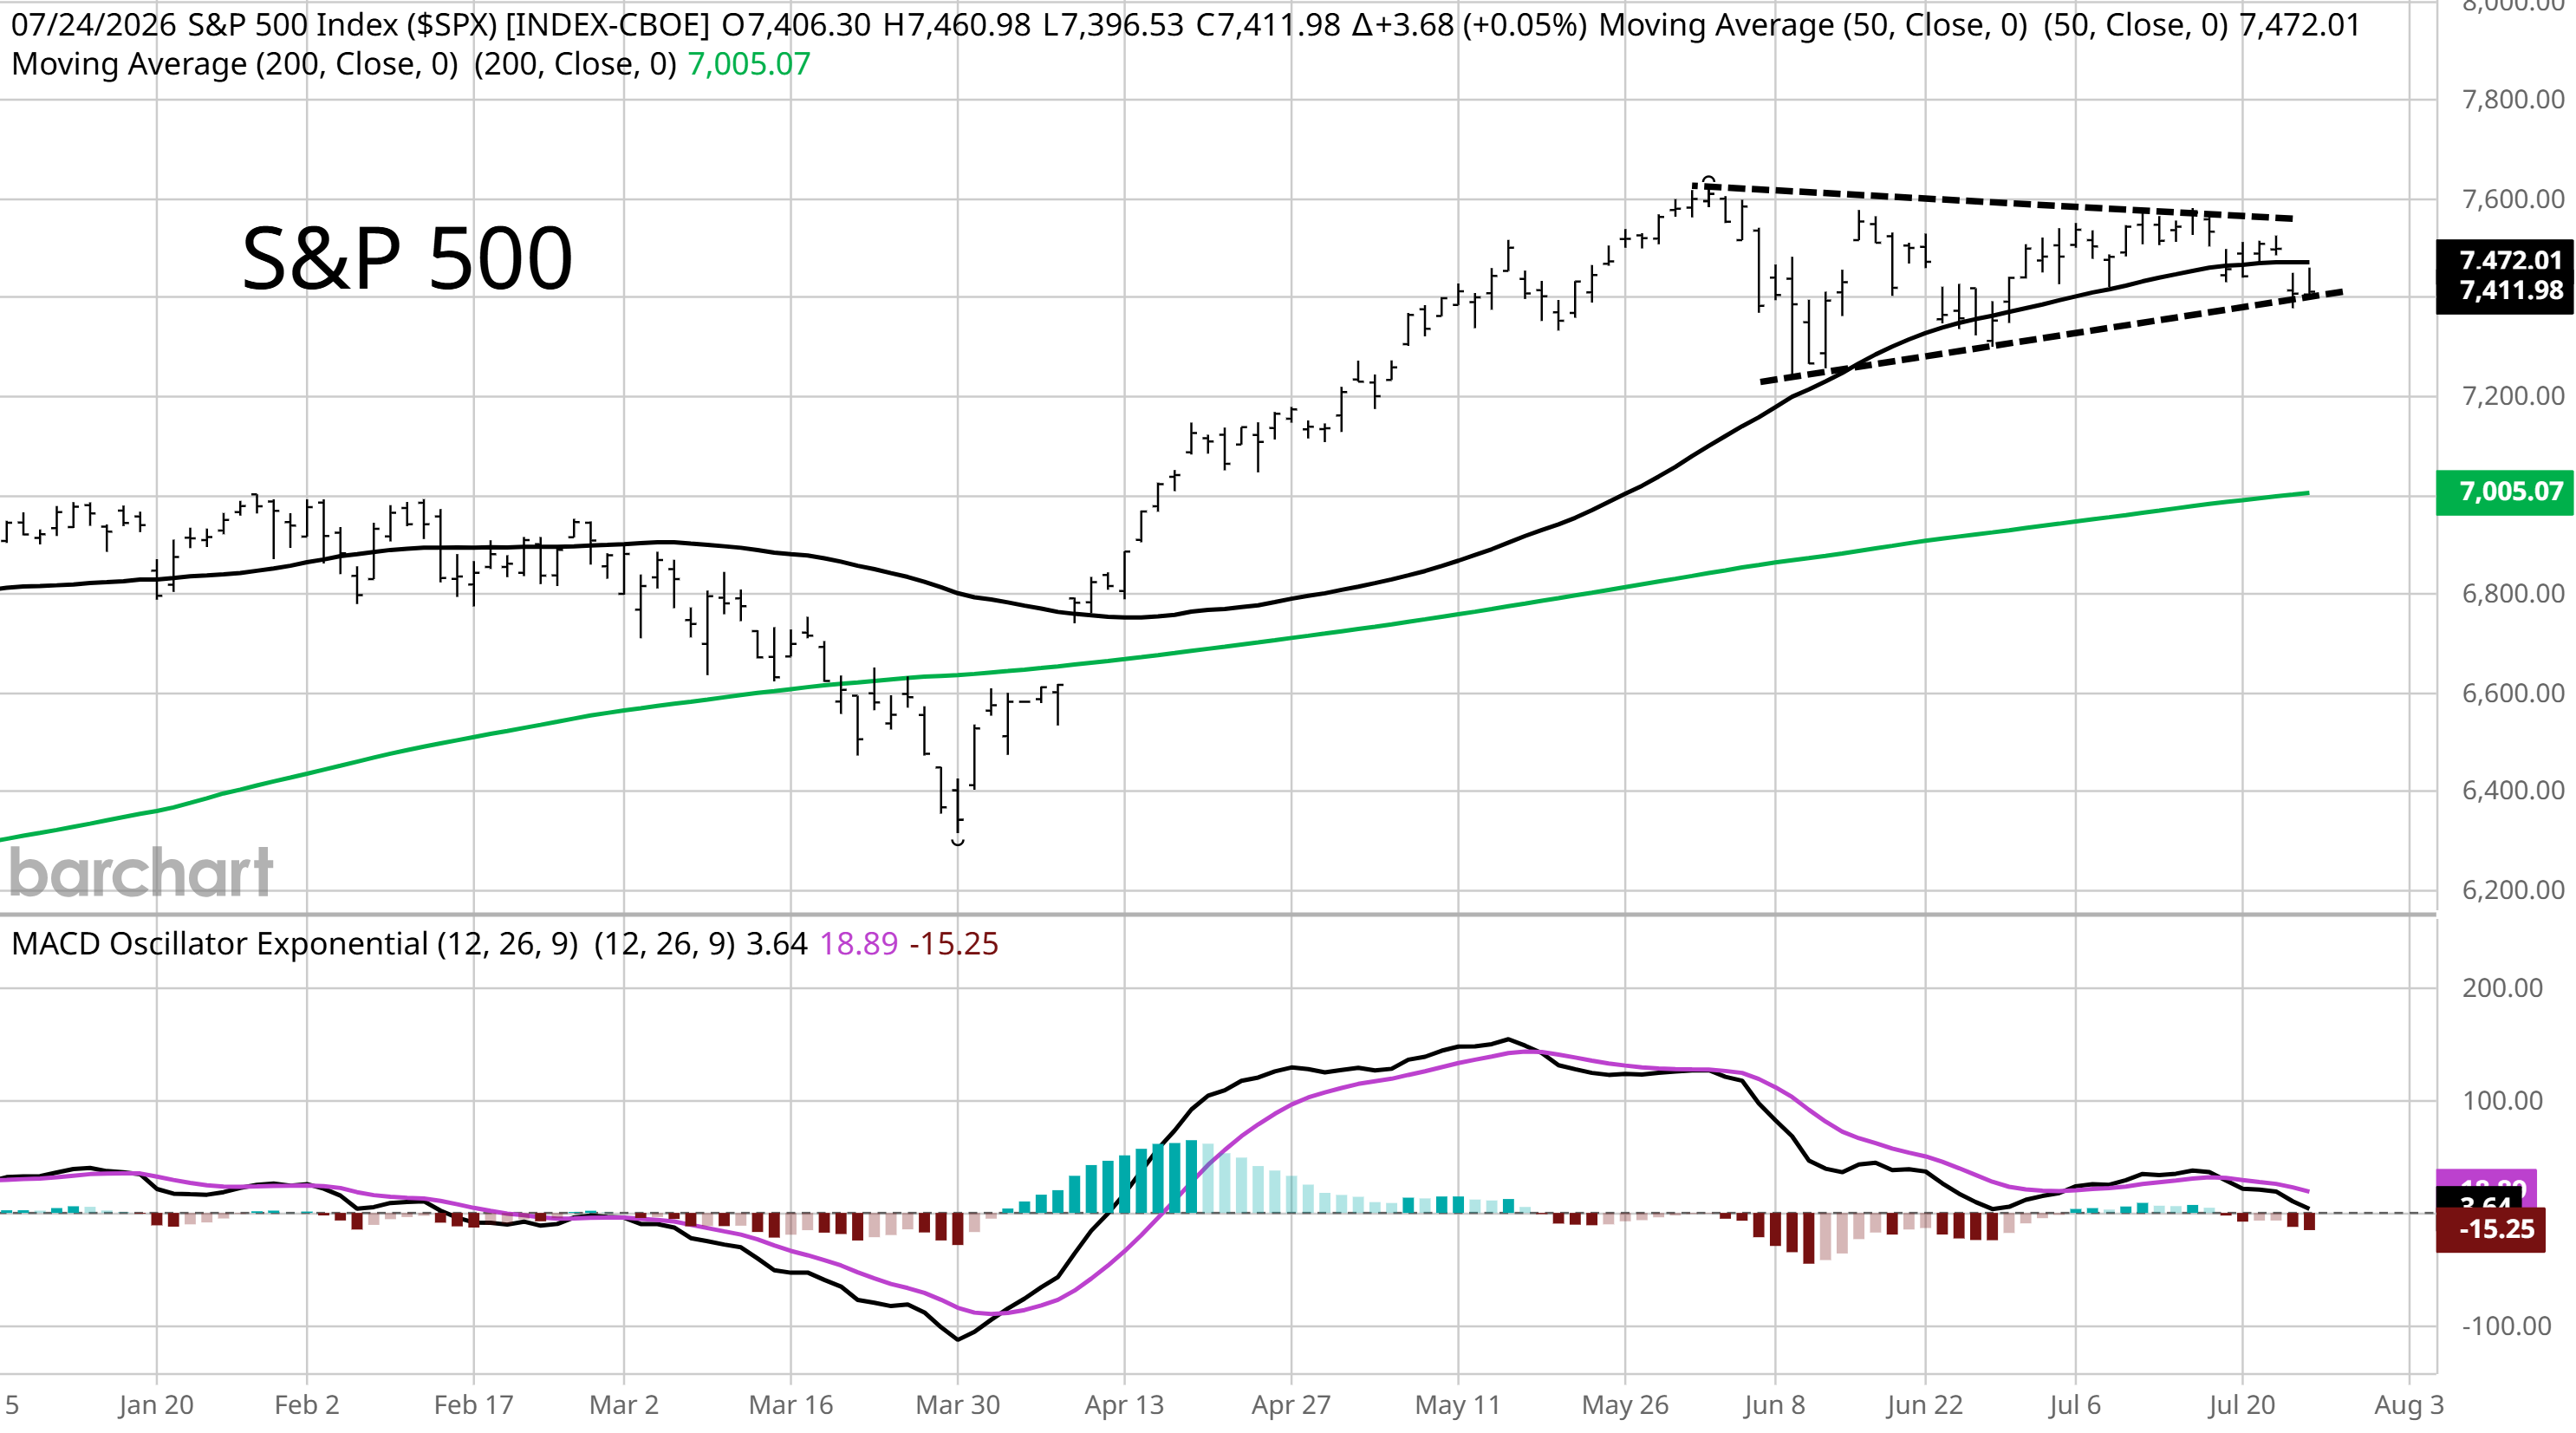
Major indexes like the S&P 500 peaked in early June and have been chopping sideways since then. The price action created symmetrical triangle pattern, which is seeing a bearish break last week. Symmetrical triangles tend to be continuation patterns, which means the pattern should resolve in the direction preceding the setup. In this instance, you would have expected a bullish resolution. But over the past week, you can see the S&P 500 is close to breaking the lower trendline in the chart below. The S&P already lost one key support level with the 50-day moving average (MA - black line). If trendline support in the triangle gives way, that could set up a test of the 200-day MA (green line) that’s currently near the 7,000 level (or 5% downside from current levels).
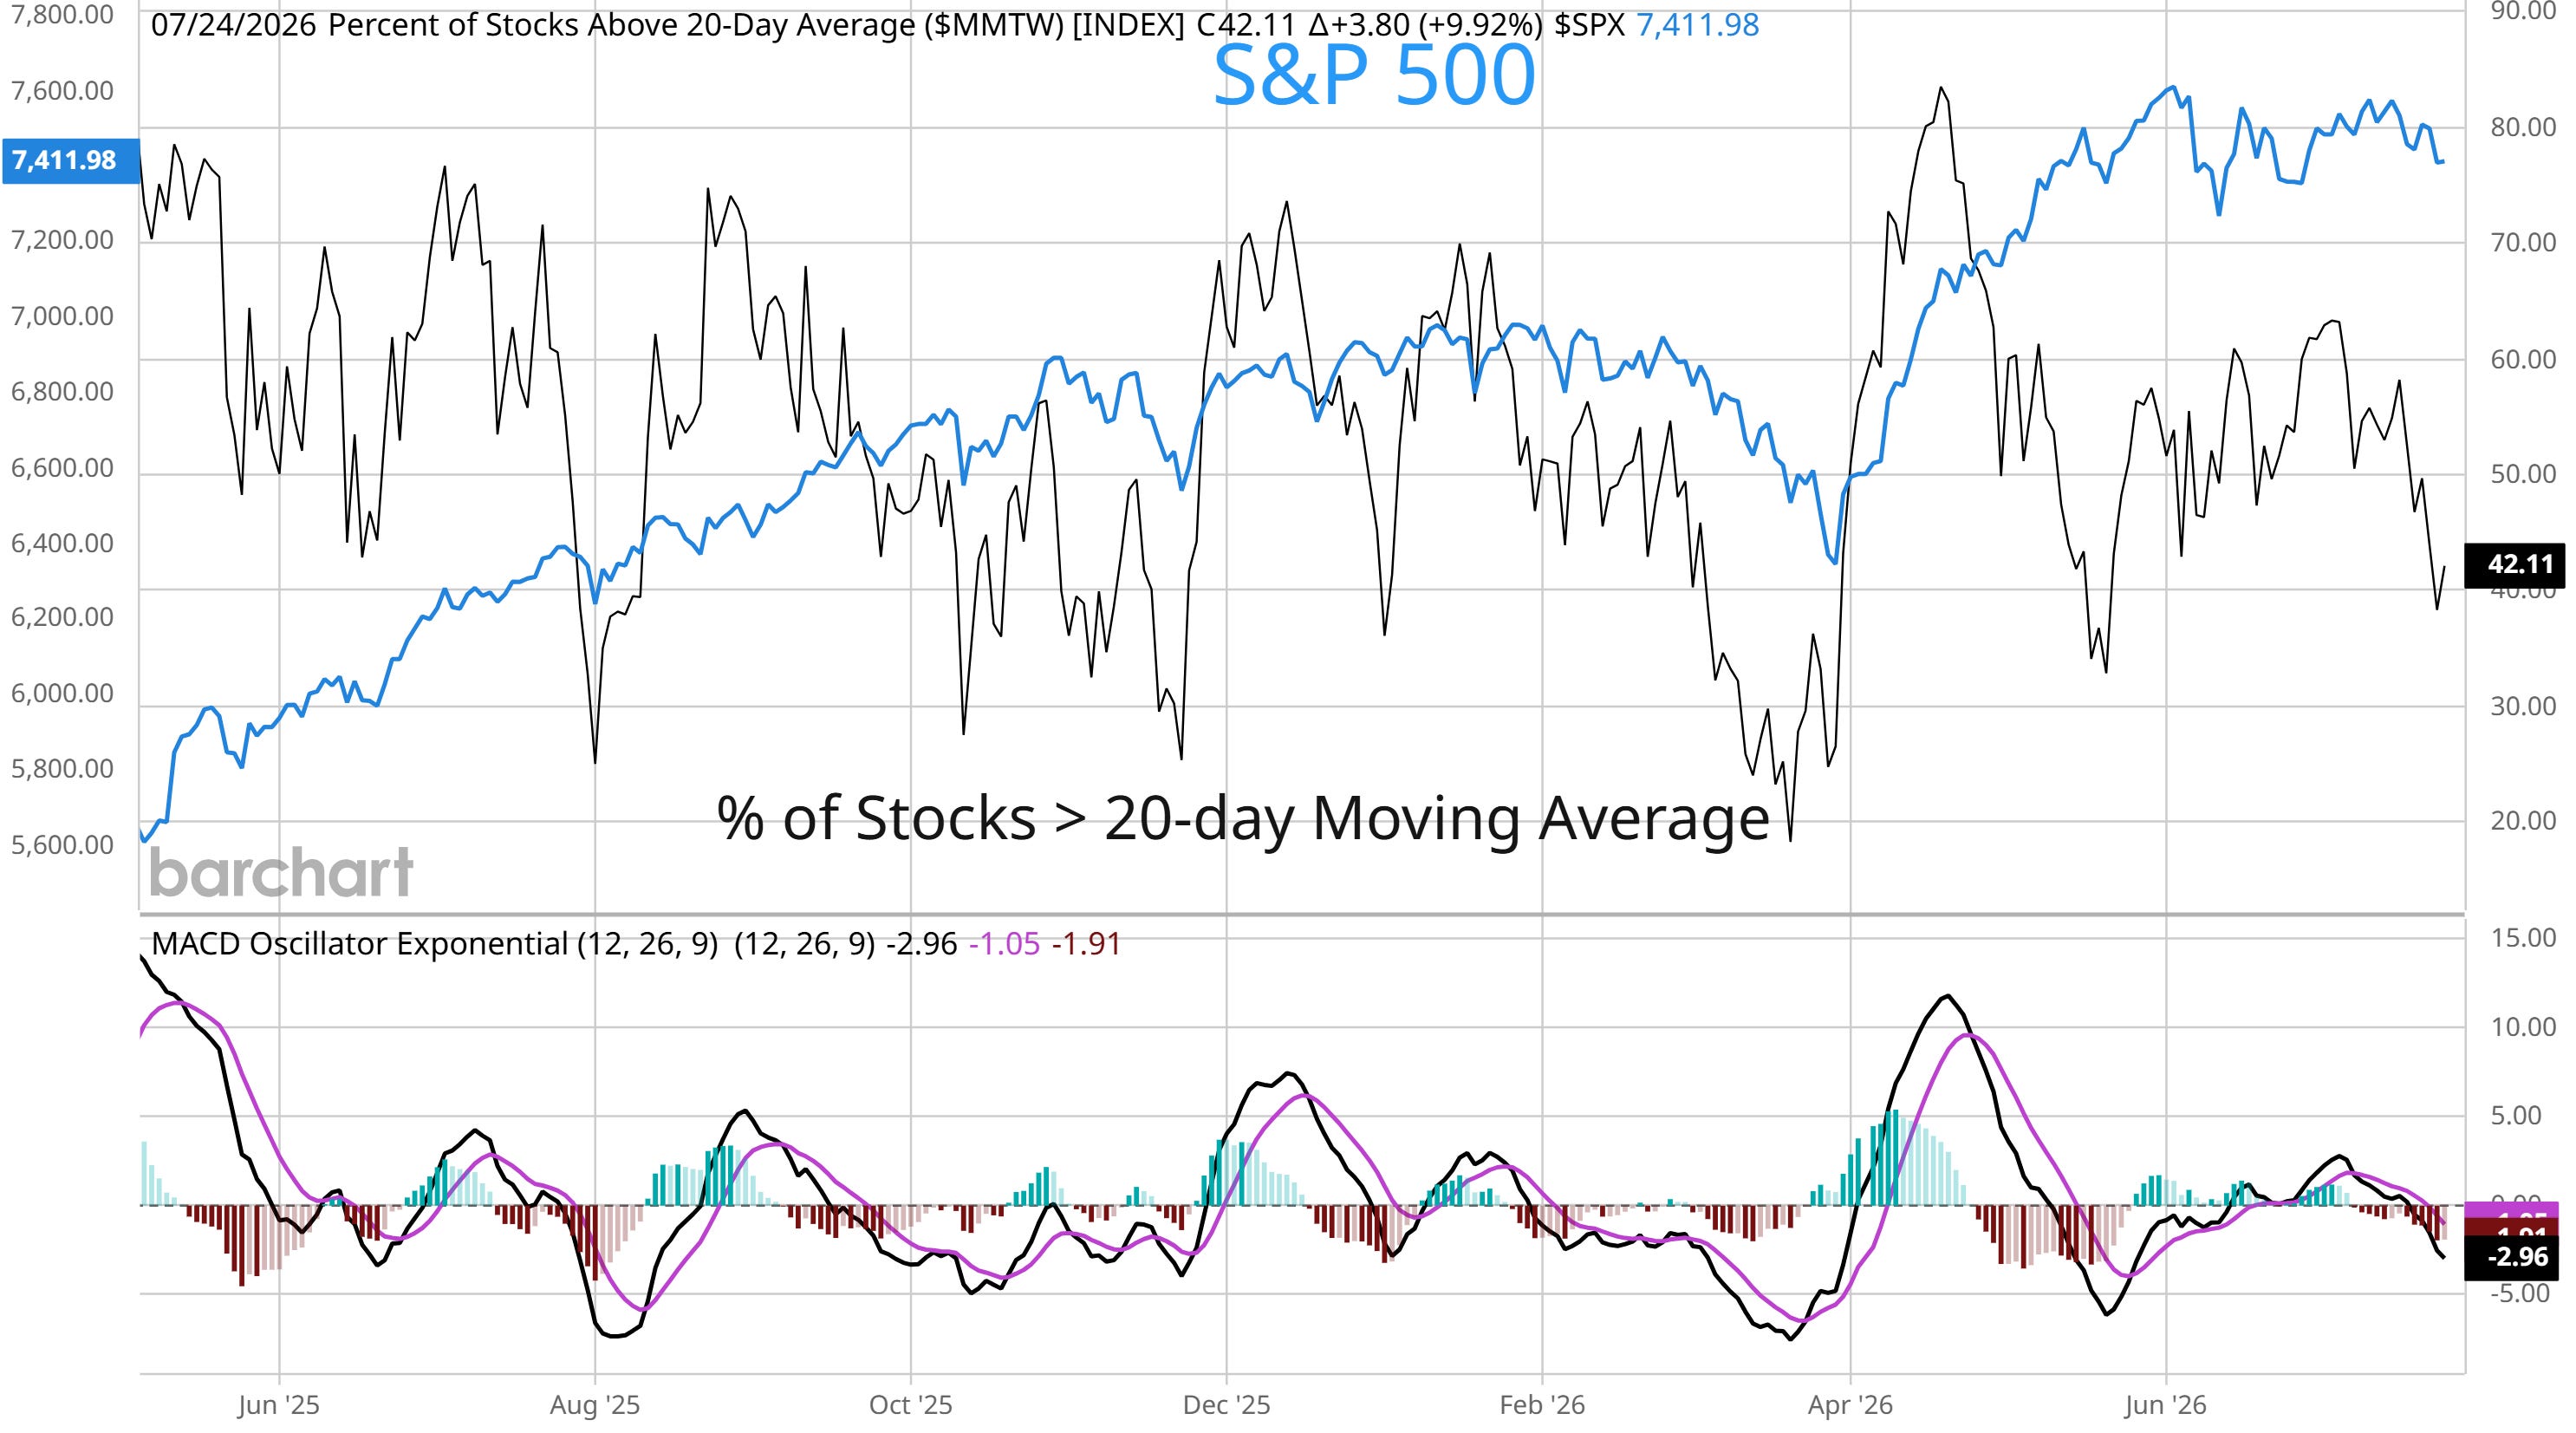
While the indexes like the S&P 500 and Nasdaq are starting to flash bearish signals, there’s already been deterioration in the average stock under the hood. The number of stocks across major exchanges trading in short-term uptrends has been turning lower since the start of July following a tepid recovery. You can measure that with the percent of stocks trading above their 20-day MA in the chart below (which also overlays the metric with the S&P 500). The percent of stocks in short-term uptrends stood at 63% in early July and is seeing a sharper deterioration in the past two weeks. Currently at 42%, you can see in the chart that oversold conditions tend to emerge below the 30% level which means there could be more downside in the near-term.
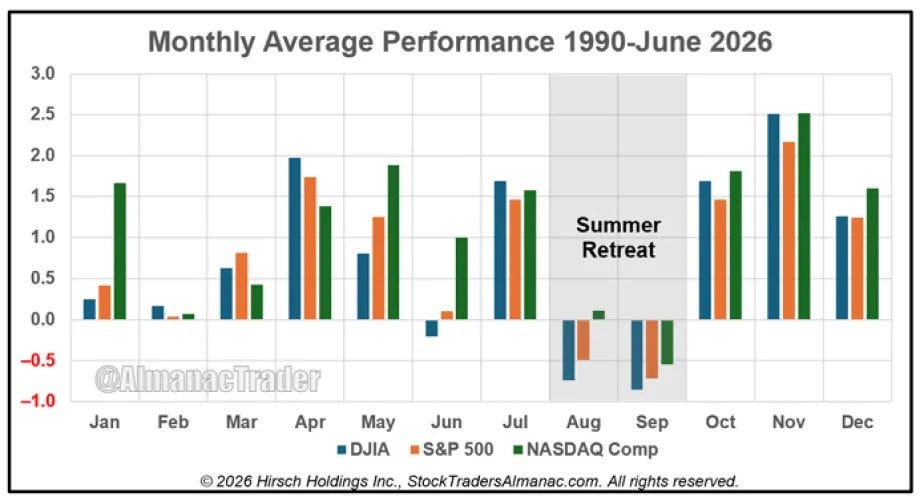
The S&P 500’s mild pullback in July runs counter to what is a historically strong stretch for the stock market. July ranks as one of the best months for average returns and win rate over various lookback periods for the S&P 500. While there is still one more week of trading remaining, the calendar is about to become much more bearish in the months ahead. The chart below shows the average monthly performance for the S&P, Nasdaq, and Dow going back to 1990. August and September ranks as the worst months for average returns, while midterm election years are also notorious for volatility heading into elections.
Massive moves are underway across the yield curve despite a weaker than expected consumer inflation report. The most recent June CPI report showed an increase of 3.5% year-over-year while the monthly change dropped by 0.4%. The annual gain was less than expected while the monthly decline was the largest decrease since April 2020. But as tensions in the Middle East intensify and oil prices rapidly increase, interest rates are jumping across maturities. That includes the 2-year yield that tends to lead fed funds is now at 4.31% and sits well above the Federal Reserve’s target range (chart below). Market-implied odds are now showing two quarter-point rate hikes now being priced for 2026.
Heard in the Hub
The Traders Hub features live trade alerts, market update videos, and other educational content for members.
Here’s a quick recap of recent alerts, market updates, and educational posts:
The upside of strict trade entry criteria.
The historic crash in the momentum factor.
Why I’m excited about new semiconductor positions.
A new core investment portfolio position I’m monitoring.
The outsized impact of the dollar on this sector’s performance.
You can follow everything we’re trading and tracking by becoming a member of the Traders Hub.
By becoming a member, you will unlock all market updates and trade alerts reserved exclusively for members.
Trade Idea
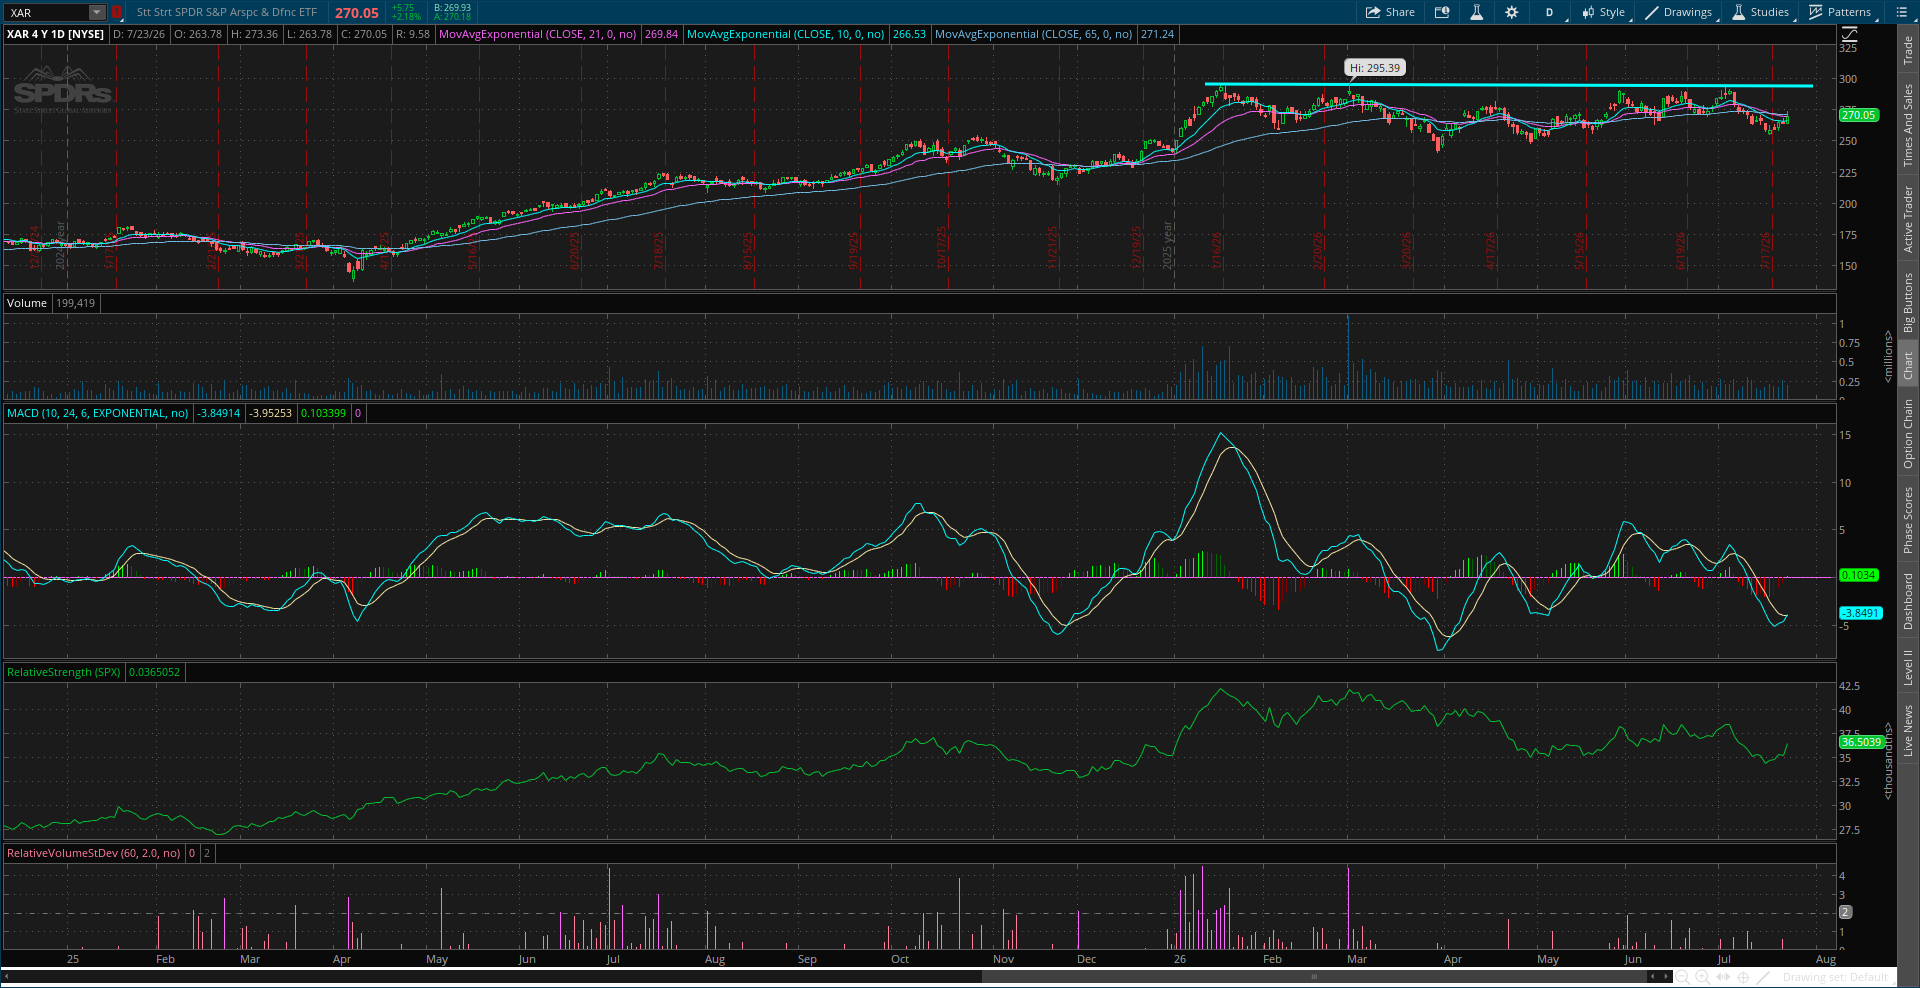
State Street SPDR S&P Aerospace & Defense ETF (XAR)
Aerospace ETF trading in a basing pattern since January. The MACD needs to recover back above zero. Ideally we see another test of resistance at $300 followed by another smaller pullback before breaking out.
Key Upcoming Data
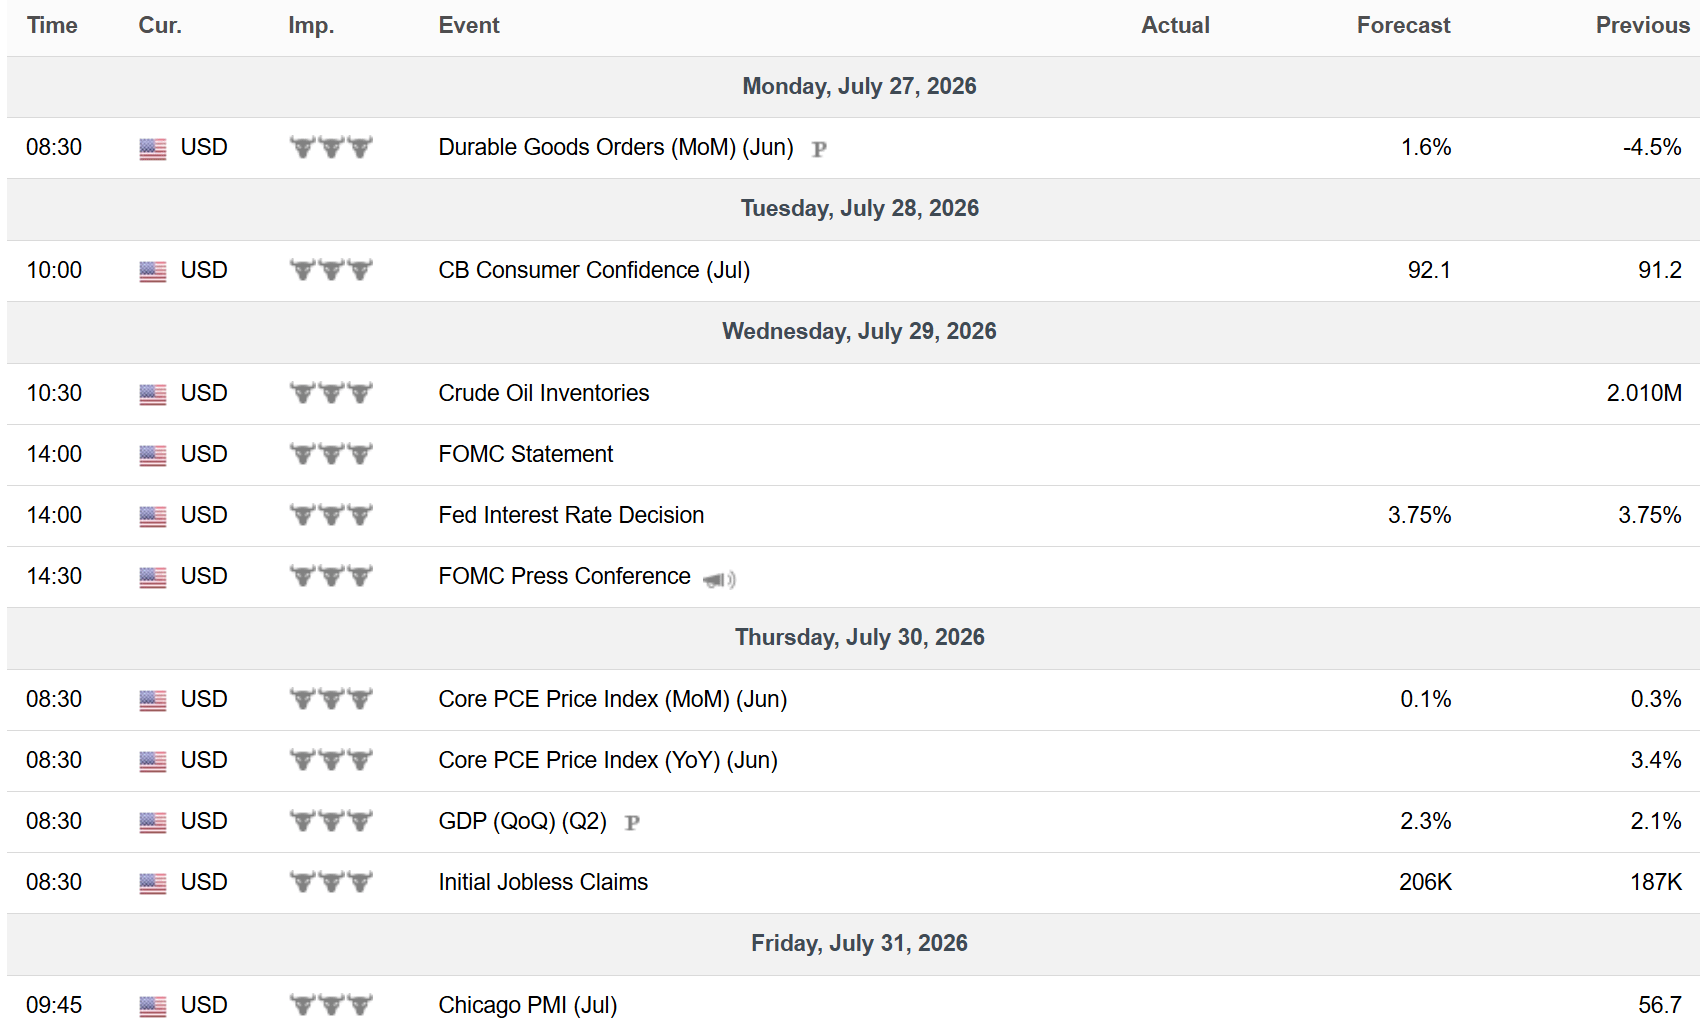
Economic Reports
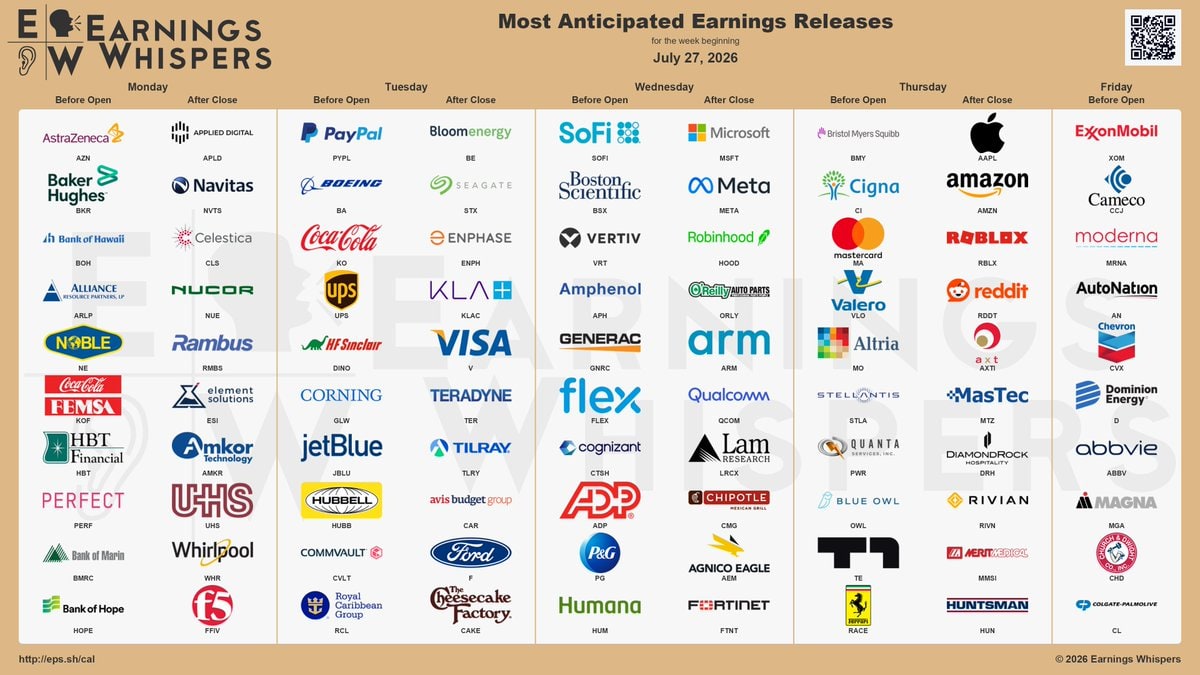
Earnings Reports
I hope you’ve enjoyed The Market Mosaic, and please share this report with your family, friends, coworkers…or anyone that would benefit from an objective look at the stock market.
Become a member of the Traders Hub to unlock access to:
✅Model Portfolio
✅Members Only Chat
✅Trade Ideas & Live Alerts
✅Mosaic Vision Market Updates + More
Our model portfolio is built using a “core and explore” approach, including a Stock Trading Portfolio and ETF Investment Portfolio.
Come join us over at the Hub as we seek to capitalize on stocks and ETFs that are breaking out!
And if you have any questions or feedback, feel free to shoot me an email at mosaicassetco@gmail.com
Disclaimer: these are not recommendations and just my thoughts and opinions…do your own due diligence! I may hold a position in the securities mentioned in this report.