The Market Mosaic 7.24.22
Stocks rally, but something is missing...
Welcome back to The Market Mosaic, where I gauge the stock market’s next move by looking at trends, market internals, and the mood of the crowd.
I’ll also highlight one or two trade ideas I’m tracking using this information.
And if you find this content helpful, hit that “like” button (you know, the one that looks like a heart). Because I heart you too…
Please share this post and become a subscriber to this always free newsletter if you haven’t already done so!
Also, be sure to check out Mosaic Chart Alerts. It’s a midweek update covering my best chart setups among long and short ideas in the stock market, along with levels that would trigger a trade. I’ll have another update out this week!
Now for this week’s issue…
There it is!
I’ve been flagging the potential to see a bear market rally unfold, driven in part by a setup in mid-term election seasonality, incredibly bearish sentiment, as well as falling levels of volatility which I updated here:
But there is just one thing missing…leading stocks posting breakouts! Just to be clear, I define a leader as a stock that’s been able to buck the bear market and is on the verge of breaking out to new highs. In last week’s Mosaic Chart Alerts, there were several beautiful breakout setups that I highlighted. And with last week’s 2.5% gain in the S&P 500, I surely thought I would be initiating a few positions.
Wrong…
Instead, I stood by as stocks like ENPH, EVH, and DY failed to clear the levels that I laid out in their chart patterns. A lot of the action took place in the most beaten-up segments of the market, which carries the hallmarks of a short-covering rally.
Here’s why I’m still mostly watching and waiting from the sidelines.
No Capitulation, No Thrust
I have yet to see firm evidence that this bear market in stocks is over. I’ve previously laid out several capitulation indicators that I believe will signal selling exhaustion and thus mark a bottom. And once we do have those signs of capitulation, next look for confirmation via a breadth thrust to sustain a durable rally.
I bring this up because there was a lot of chatter about breadth thrusts occurring this past week. Breadth is just a way of measuring advancing stocks relative to declining stocks, with a strong positive ratio signaling institutional investors are scooping up shares.
Now, if we were experiencing a pullback in a bull market, then I think these recent signals of upside would be valid. But last week’s readings are lacking the punch seen in previous bear market finales.
Like with the ratio of volume in NYSE advancing stocks to declining stocks. At nearly 10 to 1 last Tuesday, that’s a solid reading if this were a bull market pullback. But it’s nowhere near the strength needed to mark a bottom. Following 2018’s bear market bottom, this ratio hit 29 to 1 as you can see below.
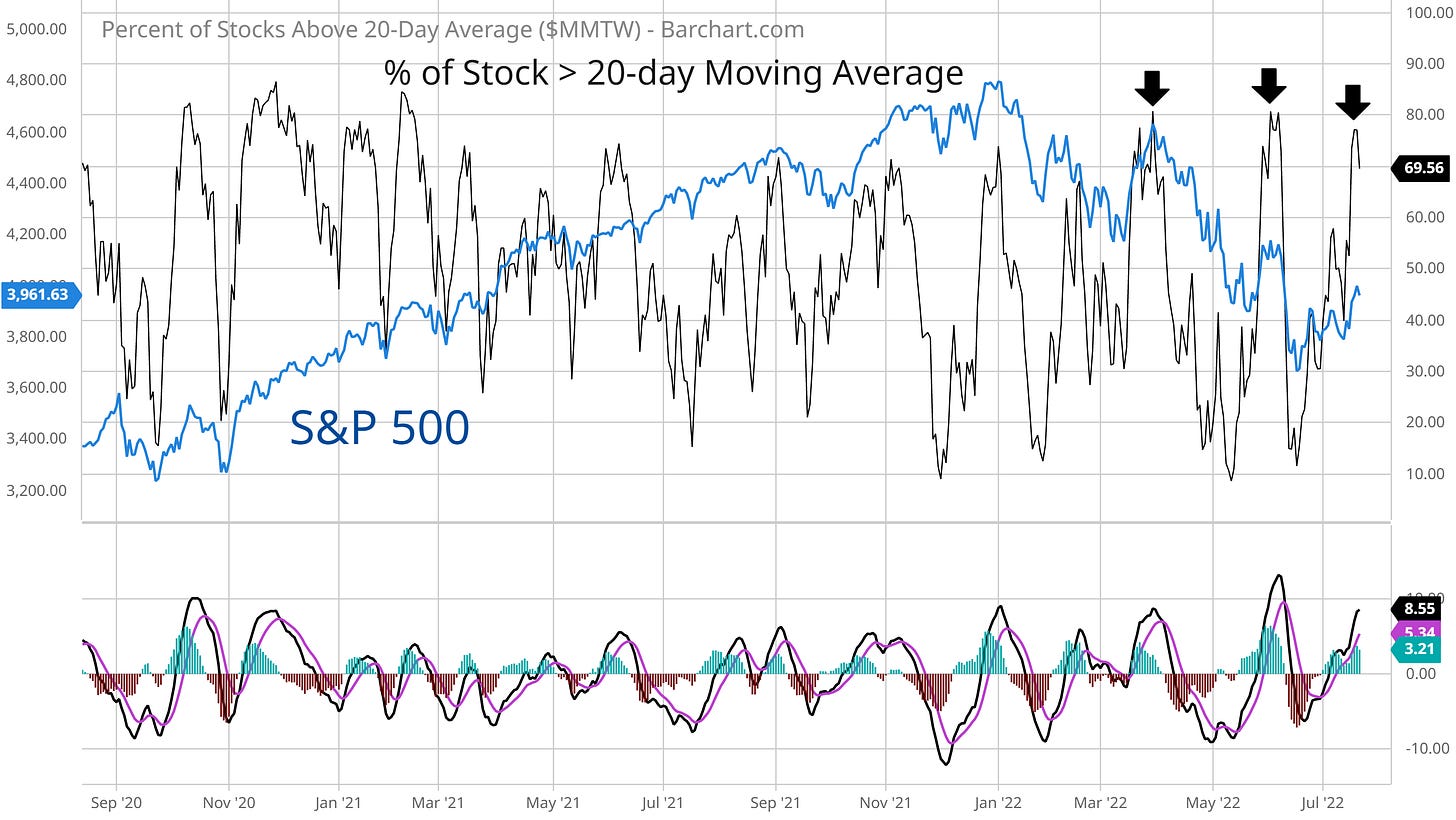
Not only that, but my favorite measure of short-term breadth is now reaching overbought levels…similar levels that have marked exhaustion of the last three rallies and saw the downside resume. The chart below shows the percent of stocks trading above their 20-day moving average, which climbed to just under 80% last week.
Finally, bad news on the economic front is catching up to the negative signals coming out of various corners of the capital markets. I noted last week that the sharp deterioration in the 3-month/10-year Treasury yield spread spelled bad news for the economy.
Well, here’s a look at a gauge of U.S. economic activity from S&P Global that plunged into contraction territory for the first time since the pandemic started.
Now What…
I don’t mind trading a bear market rally as long as watchlist positions meet my criteria for going long. But I also position size less aggressively while watching for signs that the rally could fail. So with the lack of high quality breakouts, breadth becoming overbought, a lack of capitulation signals, and fresh signs of a deteriorating economy…I’m being cautious right here.
As always, price action will be my ultimate guide and I’m still monitoring several long chart setups. A couple new ideas came across my screens last week, like with RYAN highlighted in this tweet:
GPC from Mosaic Chart Alerts is another name holding its breakout as you can see in the chart below. Perhaps it’s no surprise that this stock is working, as auto part suppliers have a reputation for being recession-proof.
There’s also quite a few stocks trading inside bear flag patterns, which is my favorite setup on the short side or with put options. I posted a tweet last week noting the flag in U, where I would now consider a position on a break below $32.
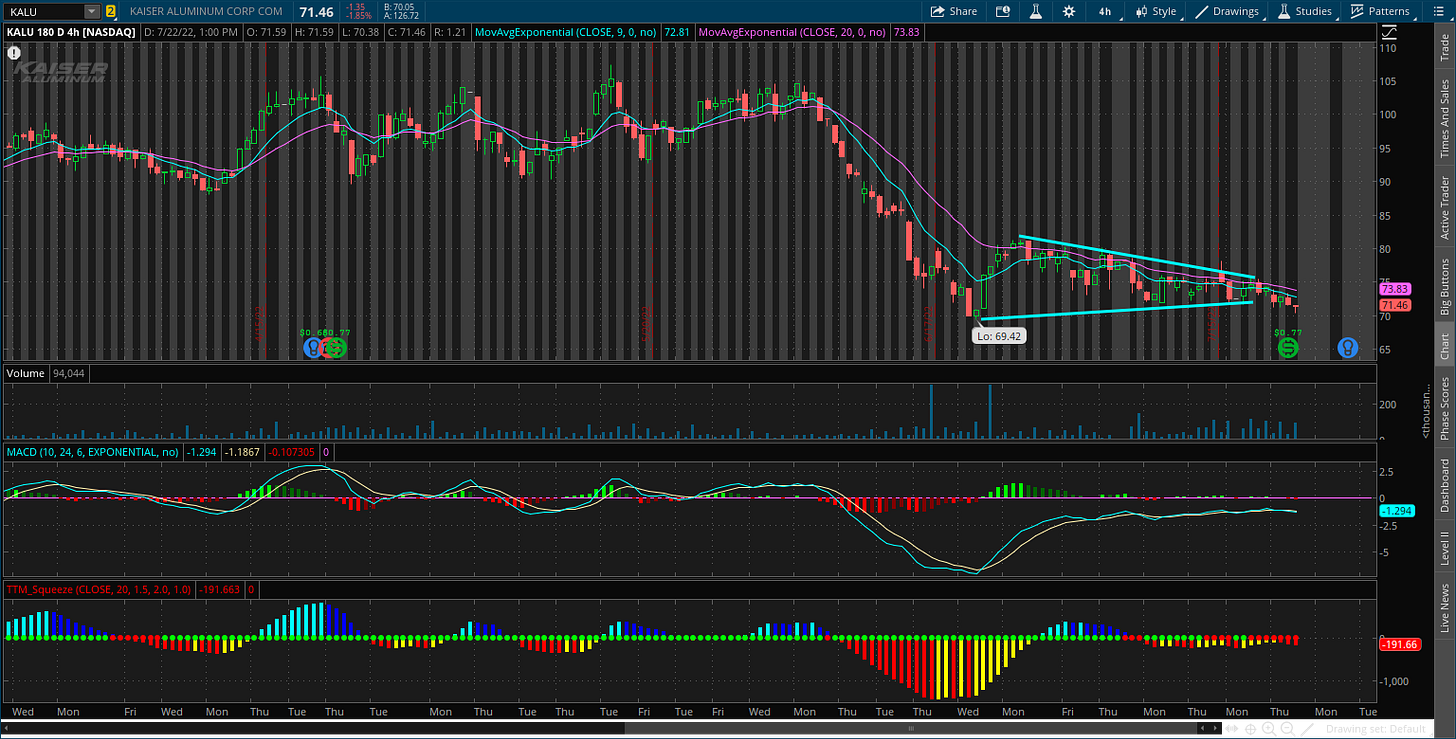
KALU from the watchlist is also starting to breakdown from the pennant continuation pattern I discussed in last week’s Mosaic Chart Alerts.
That’s all for this week. Don’t forget that we have a Federal Reserve meeting this week plus earnings reports from large-cap behemoths like Amazon (AMZN), Apple (AAPL), and Microsoft (MSFT) among many others. So while the stock market will remain volatile, don’t forget to follow the price action of your watchlist above all else!
I hope you’ve enjoyed this edition of The Market Mosaic, and please share this newsletter with anyone you feel could benefit from an objective look at the stock market.
Make sure you never miss an edition by subscribing here:
For updated charts, market analysis, and other trade ideas, give me a follow on twitter: @mosaicassetco
And if you have any questions or feedback, feel free to shoot me an email at mosaicassetco@gmail.com
Disclaimer: these are not recommendations and just my thoughts and opinions…do your own due diligence! I may hold a position in the securities mentioned in this newsletter.


