Welcome back to The Market Mosaic, where I gauge the stock market’s next move by looking at macro, technicals, and market internals. I’ll also highlight trade ideas using this analysis.
If you find this content helpful please hit that “like” button, share this post, and become a subscriber to this always free report if you haven’t already done so!
And be sure to check out Mosaic Chart Alerts. It’s a midweek update covering chart setups among long and short trade ideas in the stock market, along with levels I’m watching.
Now for this week’s issue…
When the Federal Reserve’s rate-setting committee meets again this week, market implied odds are pricing another 0.25% rate hike that will bring the fed funds rate to a range of 5.25% - 5.50%.
It’s a continuation of the fastest rate hiking campaign ever by the Fed as it tries to bring inflation under control by slamming the brakes on the economy.
And there are signs abound that the central bank’s actions should be increasingly felt…like with the yield curve for instance.
The spread between the 3-month and 10-year Treasury yield is a reliable indictor historically for gauging the future direction of the economy. When the Fed is pursuing restrictive monetary policy, shorter yields push above longer rates and create an inverted yield curve.
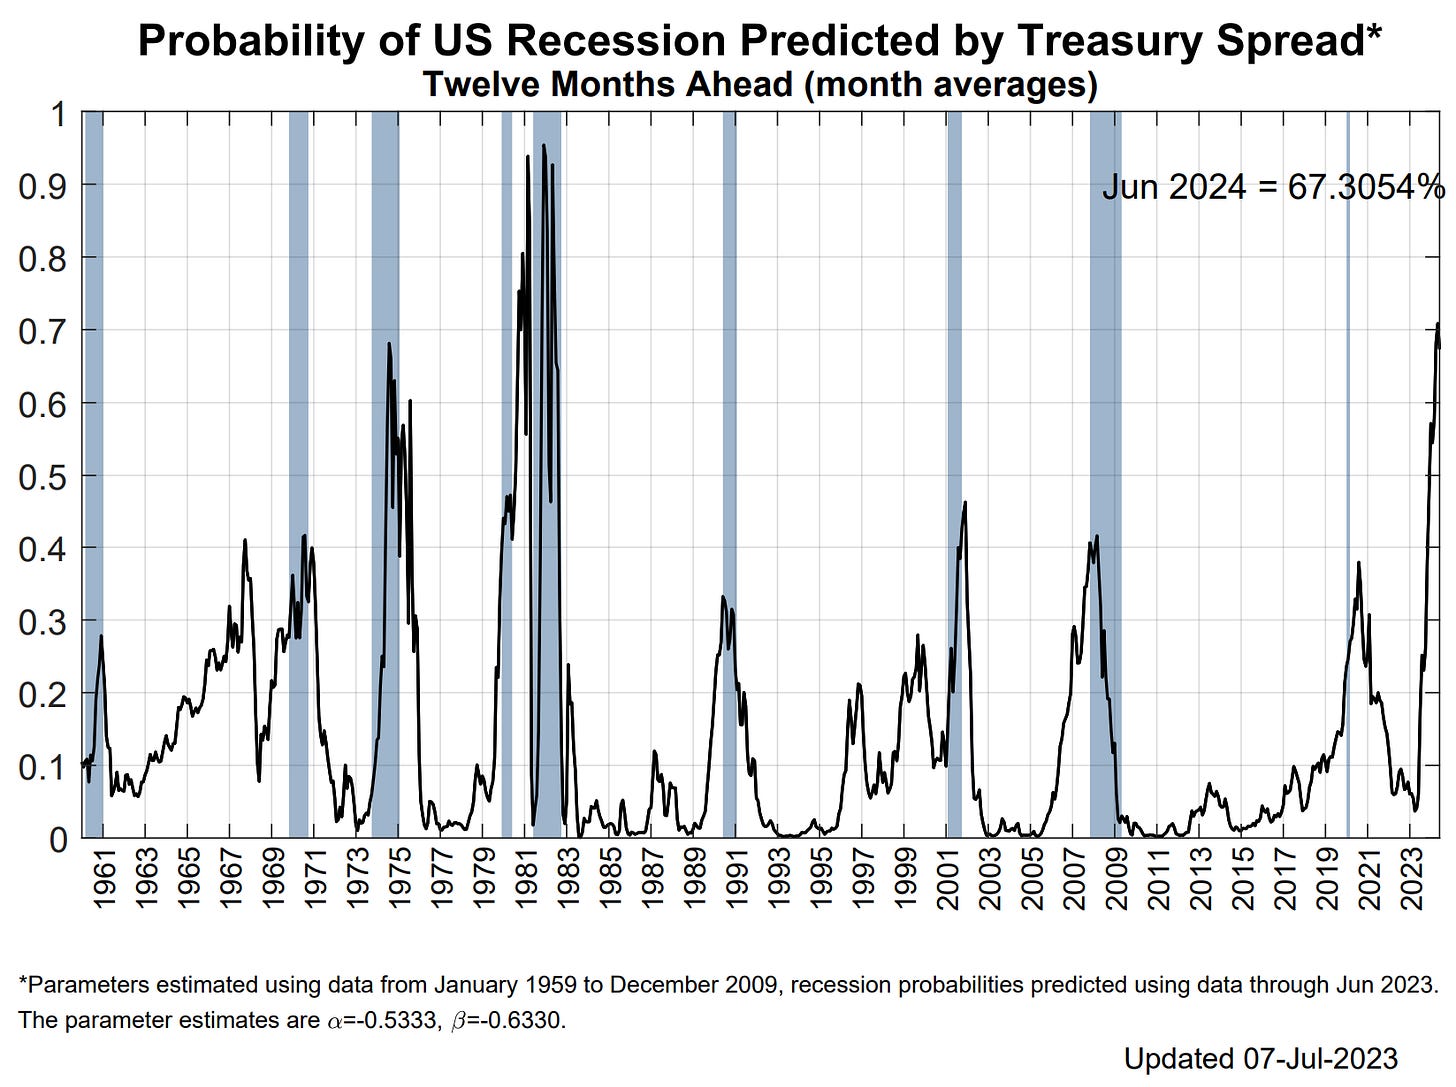
The steeper the inversion, the more likely a recession. The yield curve is the most inverted in at least 40 years as you can see below, and will likely invert even further when the Fed hikes rates this week.
The Fed even maintains a model to predict the probability of recession over the next 12 months based on output from the yield curve, which pegs the odds at the highest since the early 1980s as you can see in the chart below.
But despite the doom and gloom predicted by interest rate markets, something extraordinary is happening. There are few signs that the economy is being negatively impacted in any material way.
The labor market remains healthy with jobless claims low while trailing measures of economic activity remain strong (see the Q2 GDP estimate below). Even the housing market is showing signs of picking up even though mortgage rates are hovering near the highest level in 20 years.
And if anything, there’s emerging evidence that growth could start to accelerate.
Here are key signs that suggest the economy’s rate of change is picking up, and what it means for new breakout opportunities in the stock market.
Accelerating Economic Growth
Against the backdrop of the Fed tightening cycle and concerns over the growth outlook, investors have lost sight of three massive sources of stimulus providing an offset:
· Infrastructure Bill: $1 trillion and passed in 2021.
· Inflation Reduction Act: $500 billion and passed in 2022.
· CHIPS Act: $280 billion and passed in 2022.
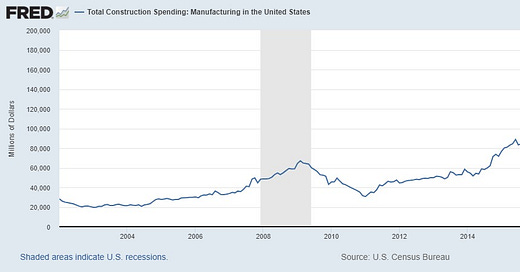
I won’t get into the details of each spending package, but suffice to say there are provisions within each bill that are creating a massive boom in spending on infrastructure and other manufacturing projects including renewable energy and semiconductors.
You can see that in the chart below with construction put in place for the manufacturing sector. This measures new manufacturing construction activity and improvements to existing structures.
The construction boom has taken this measure to $194 billion, which is up 140% in just two years. And what’s encouraging is that other leading and coincident indicators of economic activity are starting to accelerate off a low level.
You’re seeing that with leading economic indicators. The Conference Board released their own leading economic index (LEI) this past week. And while the headlines paint a dark picture with the year-over-year decline well over 5%, there are early signs of an improving rate of change off depressed levels as you can see in the chart below.
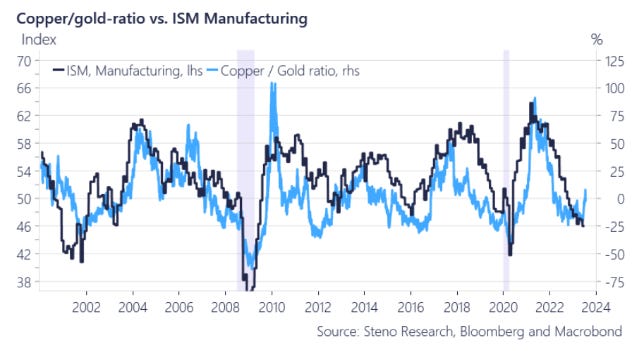
There’s also evidence that purchasing manager indexes (PMIs) could start to recover off low levels. The manufacturing report from the ISM is a popular one to track. The chart below shows the manufacturing ISM overlaid with a ratio of copper to gold prices (h/t to Steno Research).
Copper is utilized in various industrial end markets, while gold has a reputation as being a safe haven asset. So for the ratio, the thesis is that a rising line (indicating copper is outperforming gold) is a sign that economic activity is picking up and that animal spirits are gaining traction. The ratio tends to lead changes in the manufacturing ISM, which could be about to turn higher off a low figure.
As for the investment case on why all this matters, an improving rate of change off a low level is a regime historically associated with positive stock market returns. That’s because a pickup in activity is positive for the earnings outlook, which I’ve written about recently.
Forward earnings estimates need to keep moving higher for the new bull market to stay intact. And if the early signs of improving activity keeps picking up, I’m watching for trading opportunities in cyclical sectors.
Now What…
Besides the boost from infrastructure and manufacturing spending, there’s a couple other reasons why cyclical sectors could see a boost…especially on the commodity side.
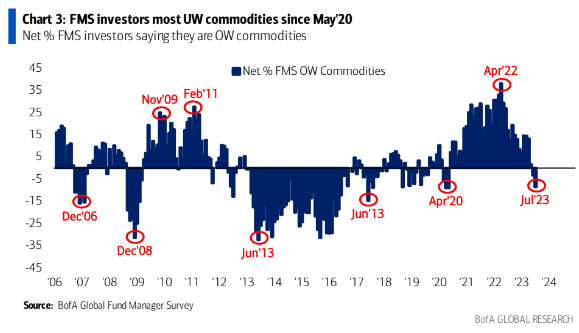
Fund managers are chasing returns in the technology sector, with the Nasdaq putting up the best first half in 40 years. But in doing so, it’s also leading to the biggest underweight to commodities since the aftermath of the pandemic as you can see below.
Commodity linked sectors also stand to benefit from a weakening dollar. Trading in most commodities takes place with U.S. dollars. So when the dollar weakens, it increases the purchasing power of foreign currencies which is a boost for commodities.
The dollar put in a significant top back in September 2022 (the arrow), and has since taken out additional key levels at the $101 level as you can see in the chart below. The significance of dollar weakness can’t be understated, especially as it impacts cyclical and commodity sectors.
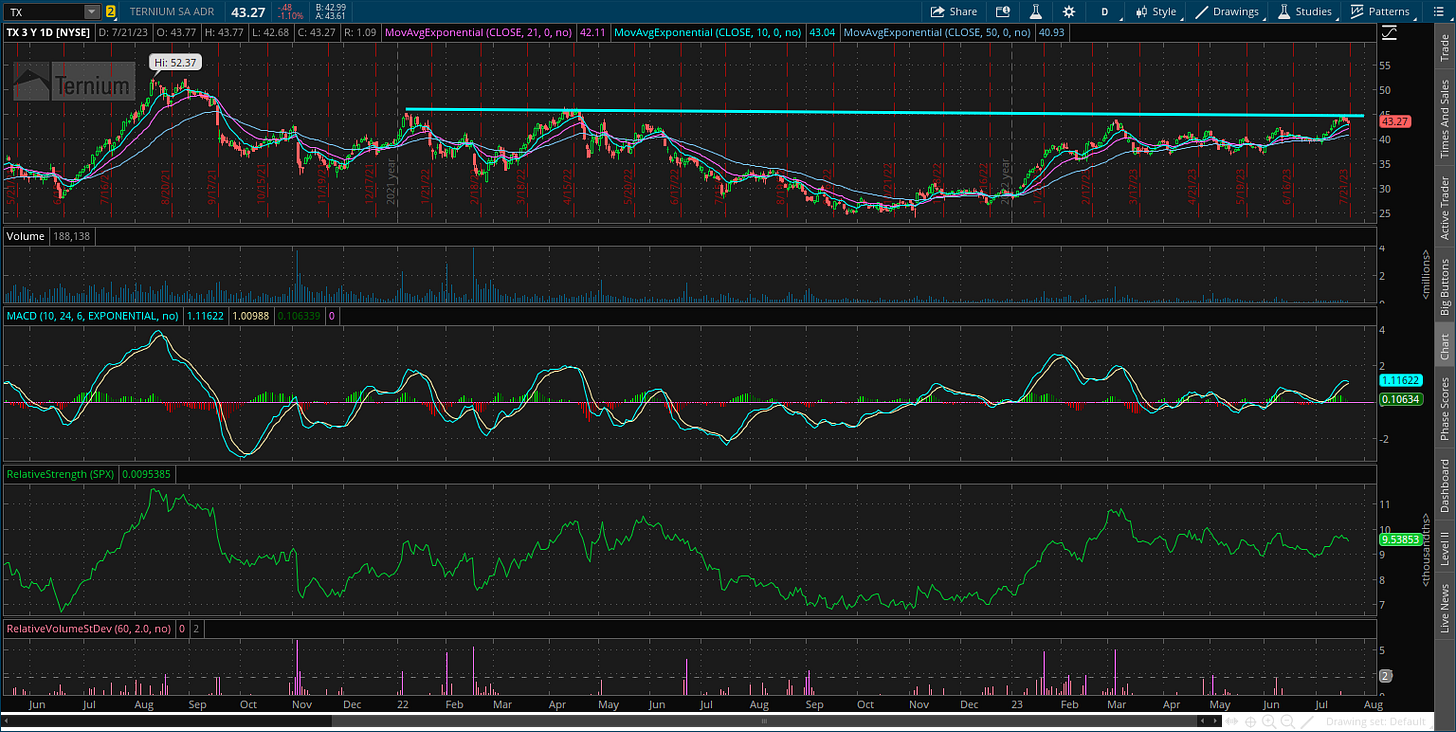
If cyclical sectors are about to takeoff, then I’m monitoring setups in the energy-linked space. One stock that has my attention recently is with Ternium (TX). The company manufactures steel for a variety of end markets, including energy and automotive.
I’m watching for a move over the $45 level, which could open the door to new highs with a follow-up move over $50 that you can see in the chart below.
That’s all for this week. The coming week will bring the most recent Fed meeting, earnings reports from companies like Microsoft and 3M, and key economic data including the first look at 2Q GDP. While there should be plenty of volatility, I’ll be watching for signs that accelerating growth metrics are lifting forward earnings estimates.
I hope you’ve enjoyed The Market Mosaic, and please share this report with your family, friends, coworkers…or anyone that would benefit from an objective look at the stock market.
And make sure you never miss an edition by subscribing here:
For updated charts, market analysis, and other trade ideas, give me a follow on Twitter: @mosaicassetco
And if you have any questions or feedback, feel free to shoot me an email at mosaicassetco@gmail.com
Disclaimer: these are not recommendations and just my thoughts and opinions…do your own due diligence! I may hold a position in the securities mentioned in this report.

