
The Market Mosaic 7.20.25
Clouds gather on the rate cut horizon.

👋Welcome back to The Market Mosaic, where I gauge the stock market’s next move by looking at macro, technicals, and market internals. I’ll also highlight trade ideas using this analysis.
If you find this report helpful please hit that “like” button, share this post, and become a subscriber if you haven’t already done so!
🚨And be sure to check out Mosaic Traders Hub. It’s a members-only platform to alert trade ideas, track a model portfolio of open positions, and further analyze the message coming from the capital markets.
Now for this week’s issue…
A hot consumer inflation report showed that tariffs are starting to make their impact on price levels.
The Consumer Price Index (CPI) increased by 2.7% compared to last year, while the core figure that strips out food and energy prices gained by 2.9%. Both figures rose from May’s rate which was expected.
Categories that should be sensitive to the initial round of tariffs are accelerating as well. That includes household furnishings that rose 1.0% compared to the prior month, which was the largest increase since January 2022.
Overall core goods excluding autos rose by 0.5% and is the biggest increase since mid-2022. Back then, the headline CPI figure was running at 9.0% on a year-over-year basis. The chart below shows the annual rate of change in the CPI’s core goods (blue line) and core services (orange line) measures.

On the producer side, the June Producer Price Index (PPI) rose by 2.3% compared to last year while the core figure increased by 2.6%. While both figures represent a deceleration from May, much of the decline was attributed to weak demand for travel that drove a decline in services inflation while goods rose 0.3% month-over-month.
Along with growing evidence that inflation could rise further in the back half of the year, evidence suggests the economy is performing just fine. That includes retail sales for the month of June that rose by 0.6% month-over-month, and was well ahead of estimates for a 0.1% increase.
Rising inflation and strong economic data is clouding the outlook for interest rate cuts from the Federal Reserve even further. Market odds are about evenly split on a quarter-point rate cut in September or no cut at all.
This week, let’s look at the latest evidence that markets are increasingly pricing higher inflation. We’ll also look at why stocks are continuing to rally past uncertainty over the rate outlook, and the key chart level that would point to further breadth expansion.
The Chart Report
As consumer inflation shows signs of accelerating, leading indicators of inflation have been sending warning signals in recent weeks. That includes a rally in assets with a high inflation beta, and are sensitive to rising price levels. Copper prices broke out to all-time record highs two weeks ago, and is notable because copper has among the highest correlations to longer-term inflation expectations. And right on cue, 10-year inflation breakeven rates are starting to move above key levels (chart below). You can see that the 10-year inflation breakeven rate is moving above trendline resistance and is testing the high end of a range going back to 2022.

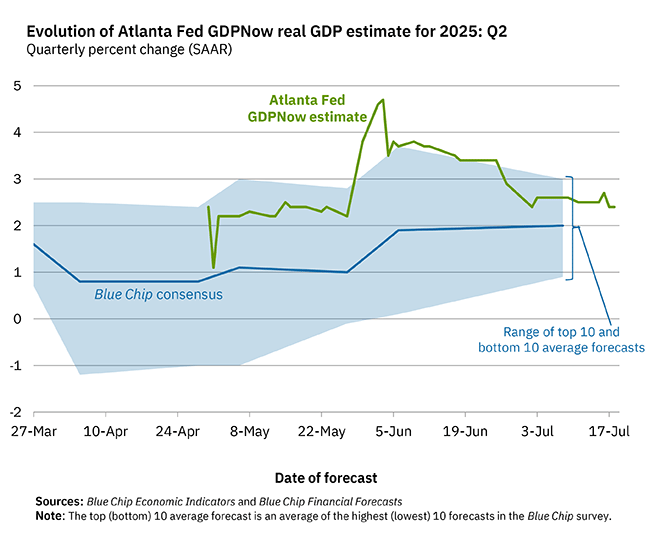
While President Trump is demanding that the Fed slash interest rates, the central bank could be forced to hold interest rates at an elevated level. That’s because of the Fed’s dual mandate to promote price stability along with full employment. Fed members have been broadcasting concerns about the impact of tariffs on inflation, which is becoming evident. At the same time, labor market statistics and the recent report on retail sales shows that the economy holding up just fine. The Atlanta Fed’s estimate for 2Q GDP currently sits at 2.4%, showing a steady growth rate. As long as the economy is holding up, the Fed’s focus could keep shifting towards price stability.
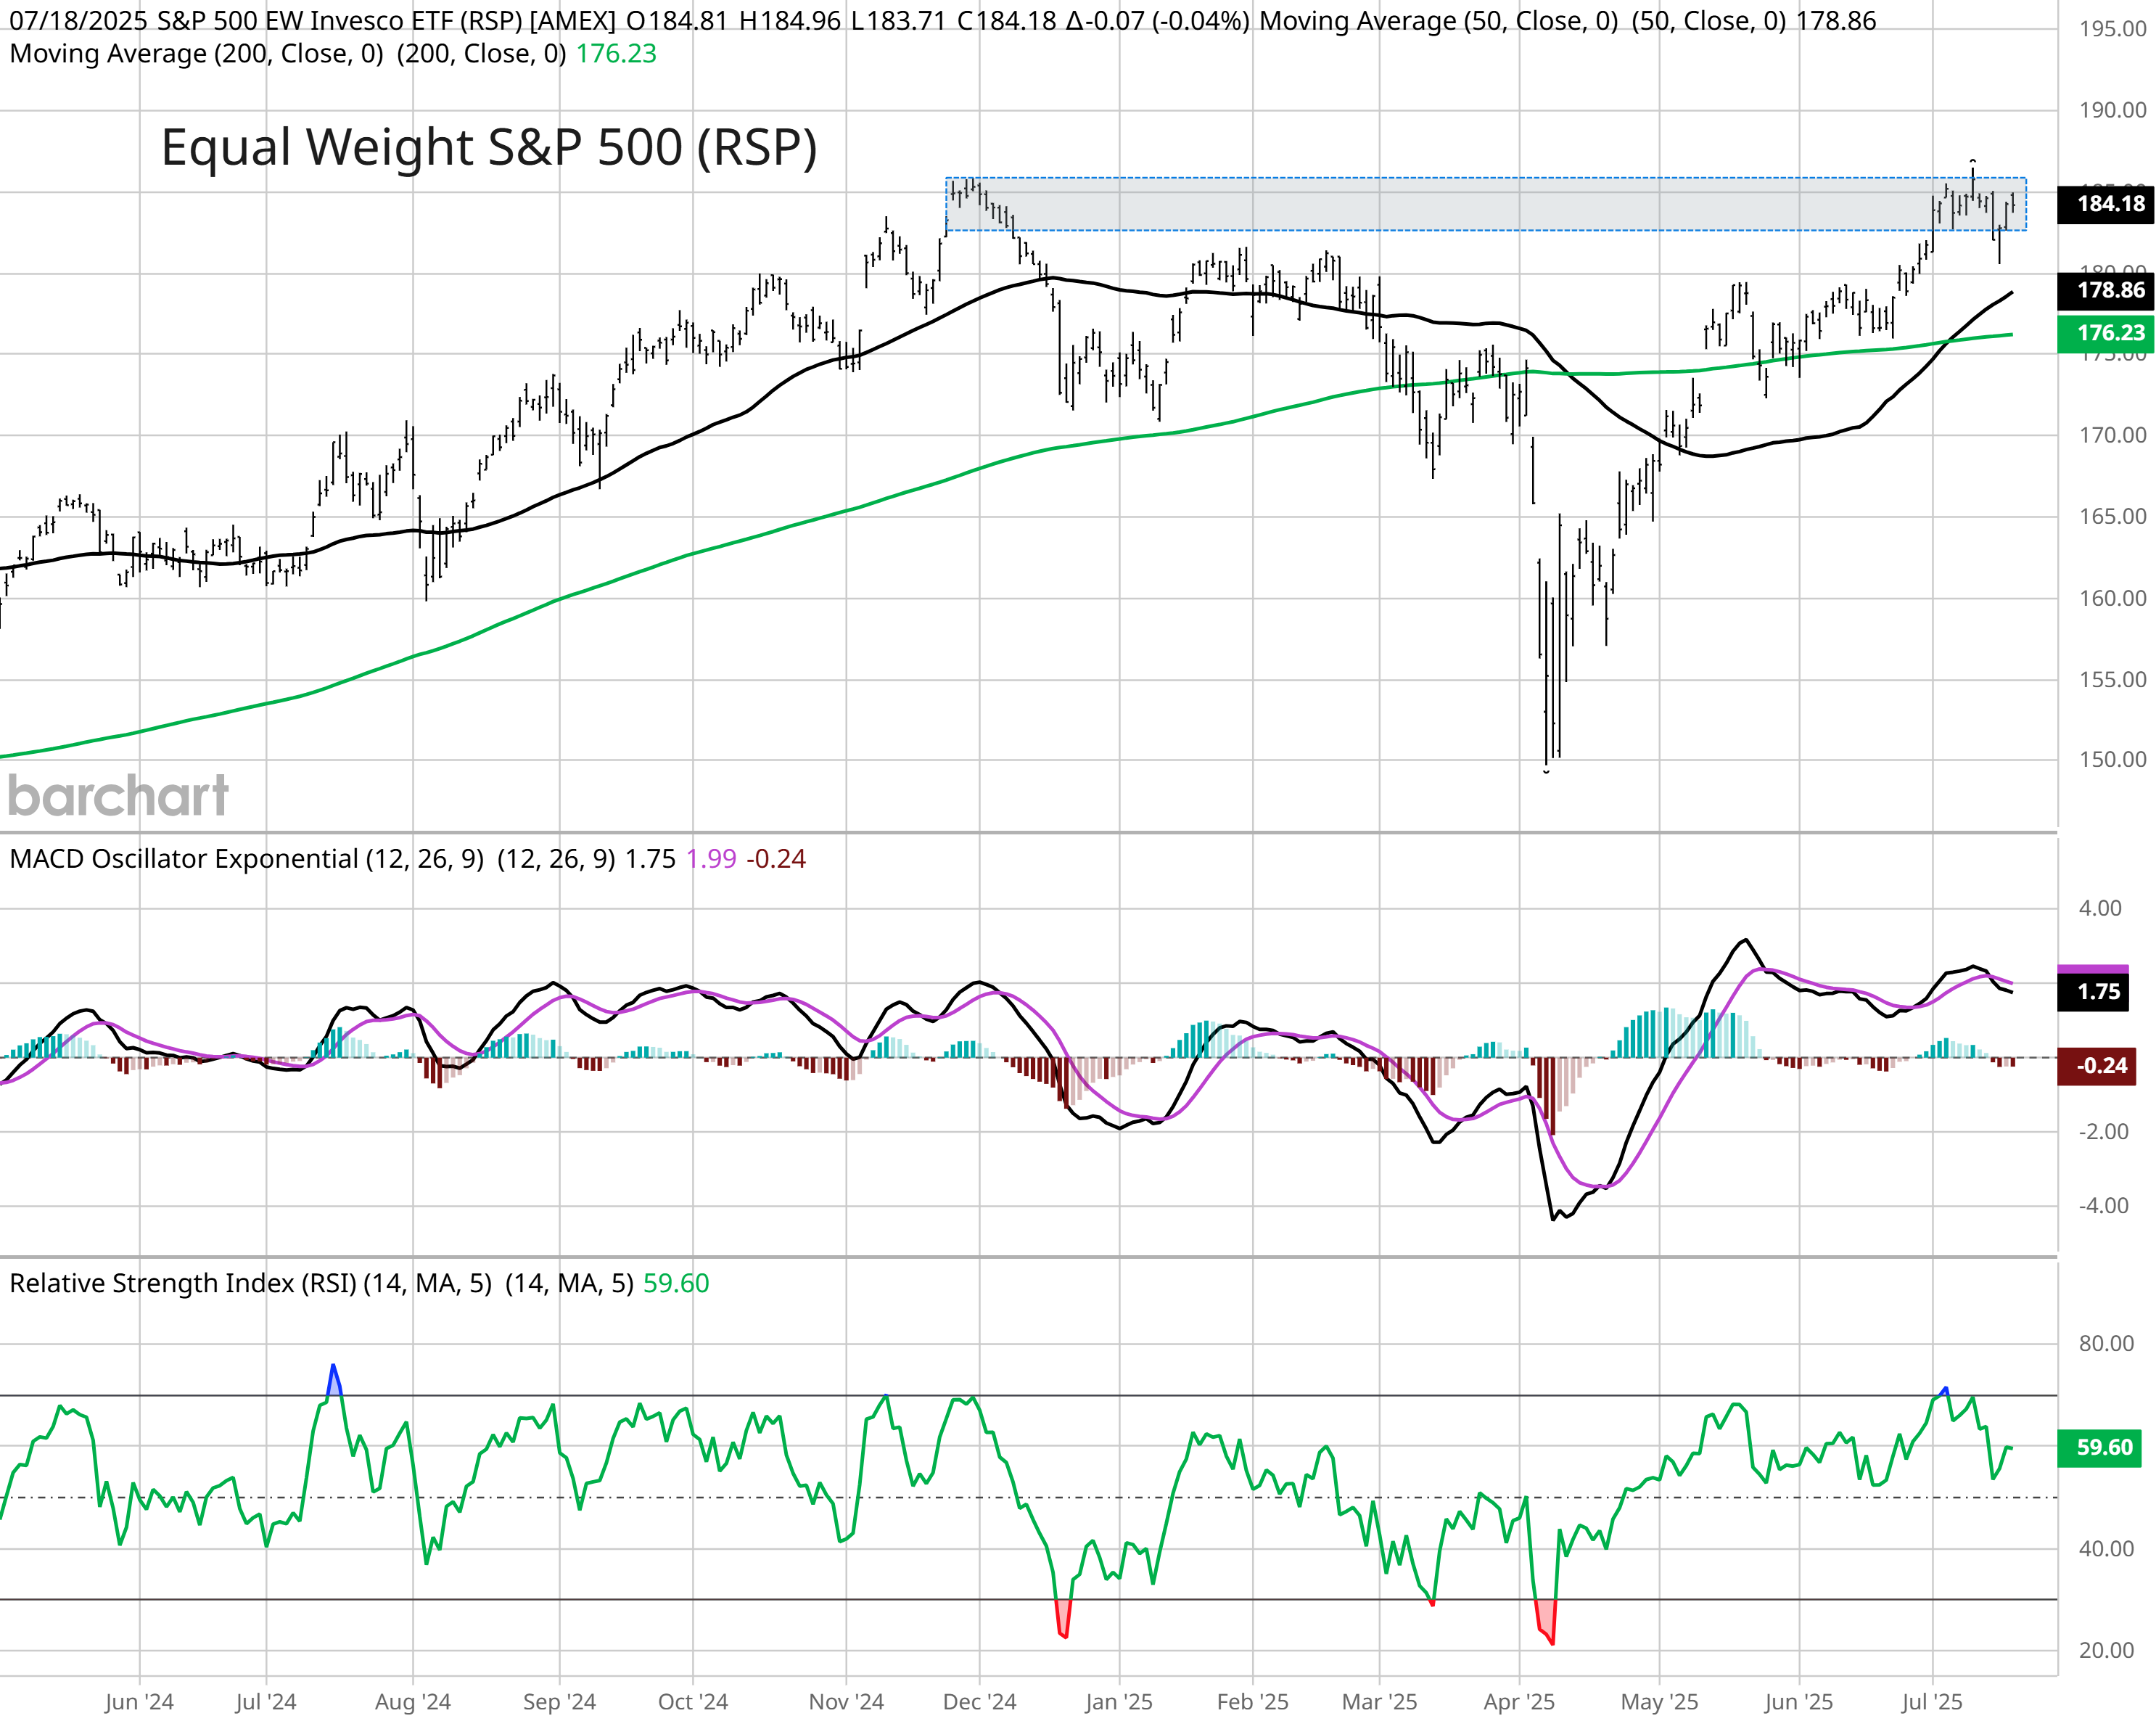
Although the outlook for rate cuts is in question, stocks have continued rallying with the S&P 500 moving out to fresh record highs last week. Stock prices follow earnings over the long-term, and evidence of a strong economy is supporting the earnings outlook. The next chart to watch is for a breakout in the average stock. The Invesco S&P 500 Equal Weight ETF (RSP) tracks an equal-weight version of the index instead of capitalization-weighted. You can see below that RSP is testing the highs from late 2024 and is close to breaking out. That follows a “golden cross” earlier this month when the 50-day moving average (black line) crossed above the 200-day moving average (green line). A move to new highs shows the average stock is keeping up with the S&P 500.
Bearish positioning in the average stock could be another contrarian bullish tailwind. The Russell 2000 Index tracks small-cap stocks, and bearish bets are surging even as markets have rallied off the early April lows. Large speculators have built a large net short position in Russell 2000 Index futures that rivals short positioning around the lows seen during last summer’s market selloff and bearish bets seen coming off 2022’s bear market. If positive momentum persists, short-covering by large speculators could deliver another boost to the average stock.

While some market-cap ranges could see a bullish positioning catalyst, one near-term headwind that could impact stocks has to do with historical seasonality and fund flows. July is historically one of the strongest months for the stock market, but the gains are seen during the first half on average. Seasonal weakness hits later in the month and tends to persist into next month. August is also among the worst months for fund flows (which is a driver of poor seasonality), with the chart below showing median mutual fund and ETF flows by month going back to 1996.

Heard in the Hub
The Traders Hub features live trade alerts, market update videos, and other educational content for members.
Here’s a quick recap of recent alerts, market updates, and educational posts:
More macro trades show promising setups.
Our portfolio boost from Bitcoin, copper, and silver.
The key chart I’m watching around inflation reports.
A new option position in a crypto and AI-linked stock.
How I’m playing the relative strength in Chinese stocks.
You can follow everything we’re trading and tracking by becoming a member of the Traders Hub.
By becoming a member, you will unlock all market updates and trade alerts reserved exclusively for members.
🚨Our recent 142% gain would cover a subscription for two years if you apply this discount found in the link below:
👉You can click here to join now👈
Trade Idea
IONQ Inc (IONQ)
Peaked near the $50 level back in January and started a new basing pattern. Recently testing the $50 area a couple times since May, and making smaller pullbacks on each test. I’m watching for a breakout over $50.

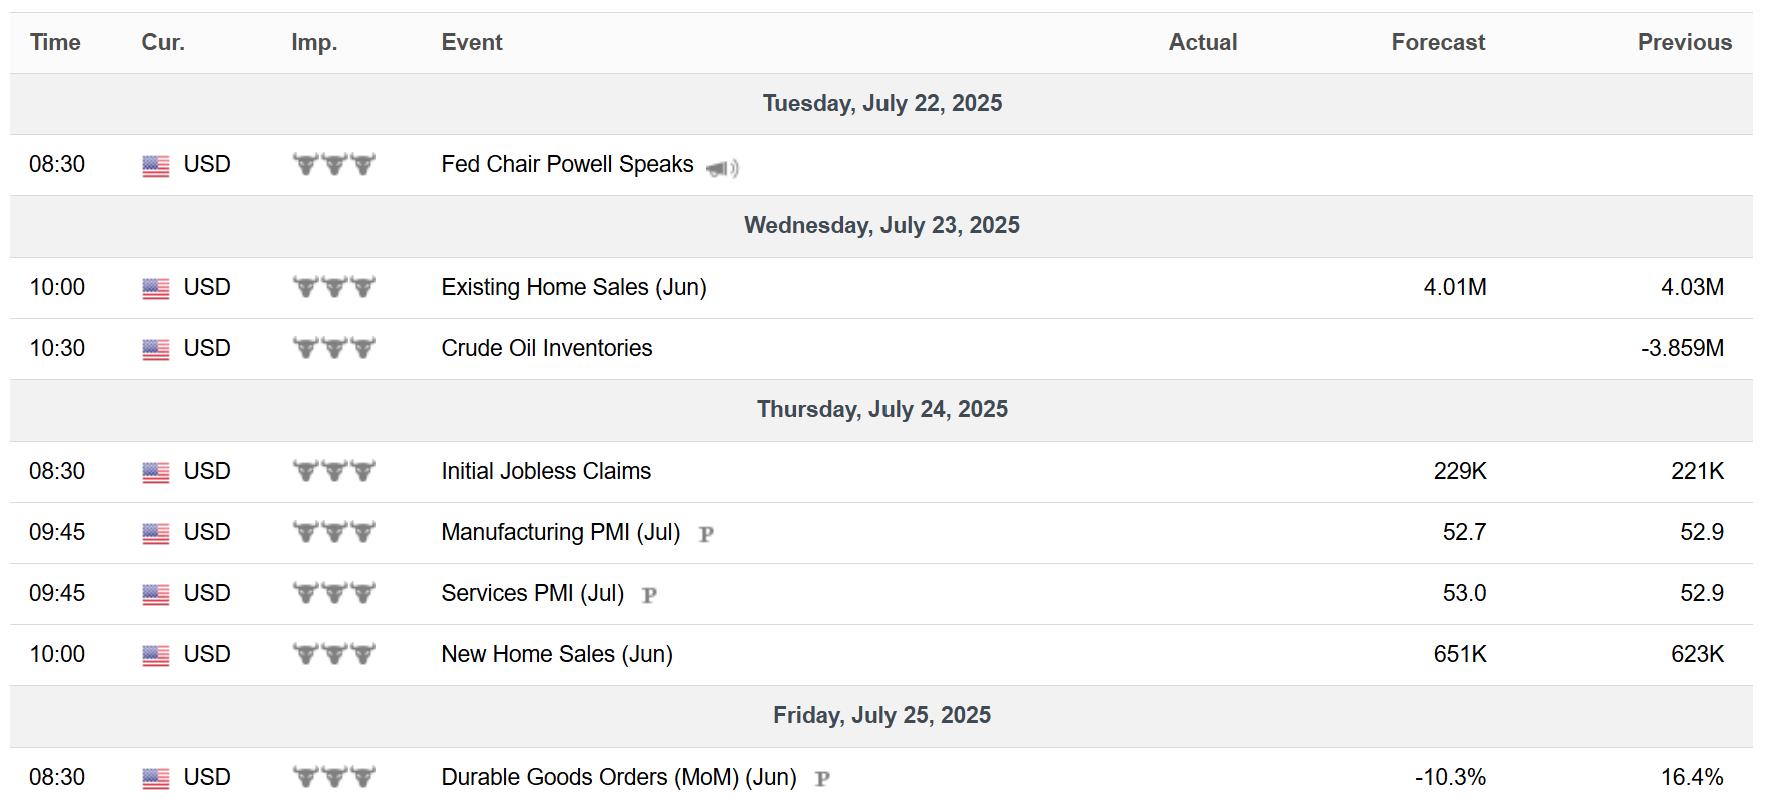
Key Upcoming Data
Economic Reports
Earnings Reports

I hope you’ve enjoyed The Market Mosaic, and please share this report with your family, friends, coworkers…or anyone that would benefit from an objective look at the stock market.
Become a member of the Traders Hub to unlock access to:
✅Model Portfolio
✅Members Only Chat
✅Trade Ideas & Live Alerts
✅Mosaic Vision Market Updates + More
Our model portfolio is built using a “core and explore” approach, including a Stock Trading Portfolio and ETF Investment Portfolio.
Come join us over at the Hub as we seek to capitalize on stocks and ETFs that are breaking out!
And if you have any questions or feedback, feel free to shoot me an email at mosaicassetco@gmail.com
Disclaimer: these are not recommendations and just my thoughts and opinions…do your own due diligence! I may hold a position in the securities mentioned in this report.