The Market Mosaic 7.10.22
Bear market bull? Sentiment and seasonals remain positive.
Welcome back to The Market Mosaic, where I gauge the stock market’s next move by looking at trends, market internals, and the mood of the crowd.
I’ll also highlight one or two trade ideas I’m tracking using this information.
And if you find this content helpful, hit that “like” button (you know, the one that looks like a heart). Because I heart you too…
Please share this post and become a subscriber to this always free newsletter if you haven’t already done so!
First, I have some exciting news for you. I’m expanding The Market Mosaic by adding a midweek update that will specifically cover my best chart setups! It will be a curated list of long and short ideas in the stock market, along with levels that would trigger a trade. It’s called Mosaic Chart Alerts, so be on the lookout for the first issue!
Now for this week’s issue…
In last week’s newsletter, I noted that “my short-term directional bias is leaning bullish” due to positive seasonal trends and a great setup in the VIX index. More on seasonality in a moment, but first here’s an update on that VIX pattern:
The breakdown out of this pattern can drive further tailwinds for the stock market by drawing back institutional flows, at least over the short-term. And that’s helping several long trade ideas that I’ve highlighted over the past couple of weeks.
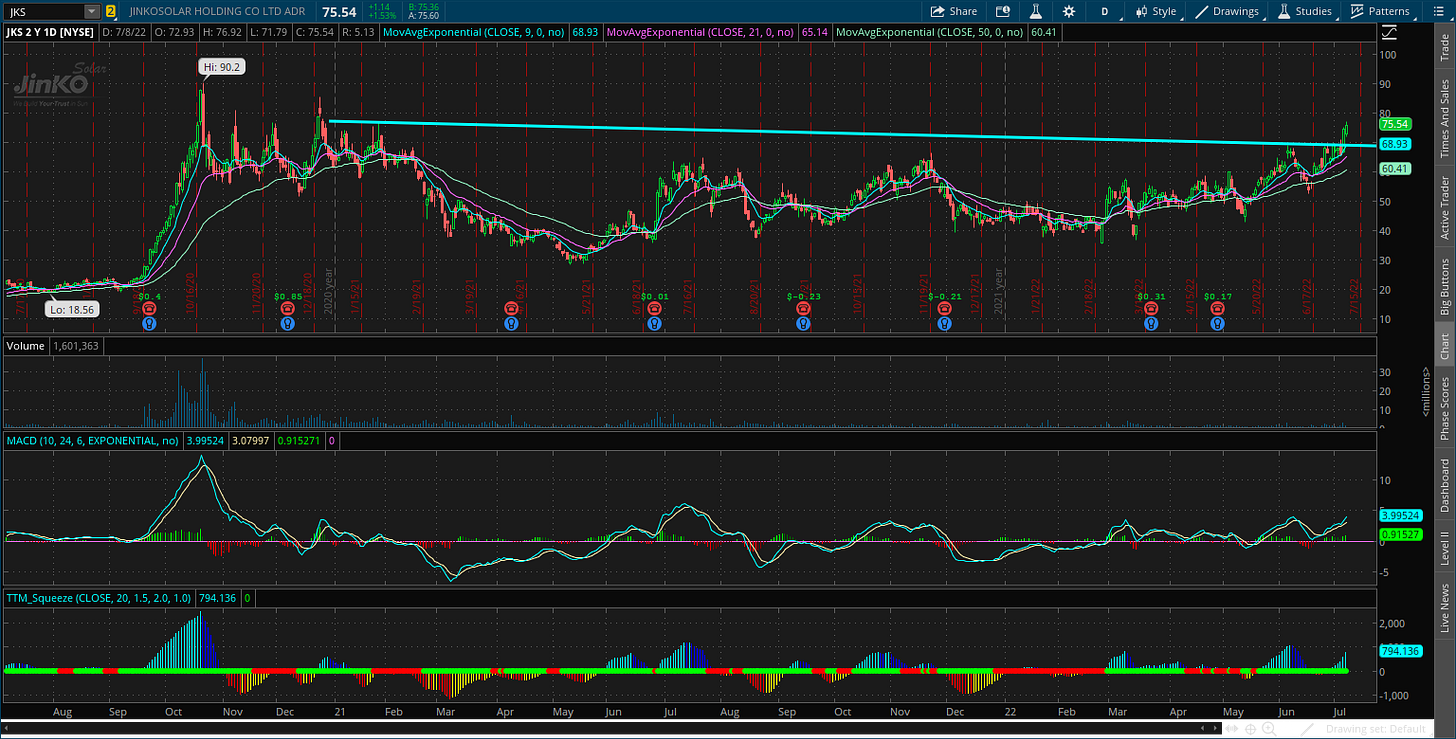
JKS has been a clear standout, with a nice breakout over trendline support. If this stock can clear resistance at the $80 level, then I expect more gains are in store.
Other names like FNKO and IMXI still look to be in the early stages of their setups, and we received news this week that VIVO is being acquired (I exited that position on the news).
I will still highlight a couple trade ideas at the end of this issue, but be sure to watch your inbox this week for a more expansive list of trade ideas I’m monitoring.
Now lets talk about a couple factors that could keep the stock market bullish over the near-term.
Negative Sentiment + Positive Seasonals
Its been awhile since I’ve covered investor sentiment, so lets start there. Perhaps it’s no surprise that most sentiment gauges still reflect an excessive level of pessimism. But by some measures, that amount of fear is reaching extreme levels, which historically is a good thing for stocks.
This post by Jay Kaeppel on Twitter caught my eye:
It shows the AAII bulls as a of percentage bulls plus bears. This measure is now lower than levels seen during the pandemic bear market and even the financial crisis! On its own, this doesn’t mean stocks have to rally from here. But this amount of bearishness is a positive for the bull camp.
I also want to highlight seasonal trends. I mentioned last week that the S&P 500 was in the midst of the best two week calendar period for returns (historically speaking). The chart below from StockTradersAlmanac.com shows an interesting comparison of how the S&P trends under certain scenarios around elections and the political party in power:
The red line reflects the current dynamic, which is the second year of a new democratic president. I wanted to bring this up because of how well the S&P 500 has tracked this pattern so far this year. This would imply more upside into mid-August then a retest of the lows.
Now What…
Bearish sentiment and calendar seasonality are favorable for more upside. But more than anything I follow price action, and right now there are more patterns setting up breakouts than breakdowns based on my screens. There’s not many, but it gives us a few ideas to trade if the upside keeps playing out over the near-term.
DY
One of my favorite setups I posted on twitter with Dycom Industries (DY). Look at how many times this stock has tested the $100 level since March last year. The more a level is tested, the more likely it is to give way in my experiences. That means I’m using a close over $100 to add a position.
HALO
This stock has a huge basing pattern going back to the start of 2021. A close over $52 is the breakout level I’m watching with this one.
Despite some of the positive developments, I’m not being overly aggressive with sizing new long positions. As I keep saying over and over, we are still in a bear market until proven otherwise. And next week kicks off the second quarter earnings season, which could drive a lot of stock market volatility that I discussed here.
Finally, please watch your inbox this week for Mosaic Chart Alerts. After much thought, I believe it is optimal to cover additional trade ideas in a separate issue. That will allow me to focus more on broader stock market developments here in The Market Mosaic, while allocating more time to trade setups in another newsletter. In Mosaic Chart Alerts, I’ll also include more details on the “rules of the game” and how I trade and manage positions.
That’s all for this week. I hope you’ve enjoyed this edition of The Market Mosaic, and please share this newsletter with anyone you feel could benefit from an objective look at the stock market.
Make sure you never miss an edition by subscribing here:
And for updated charts, market analysis, and other trade ideas, give me a follow on twitter: @mosaicassetco
Disclaimer: these are not recommendations and just my thoughts and opinions…do your own due diligence! I may hold a position in the securities mentioned in this newsletter.


