
The Market Mosaic 6.8.26
Strong Job Gains Signal a Robust Economy.

👋Welcome back to The Market Mosaic, where I gauge the stock market’s next move by looking at macro, technicals, and market internals. I’ll also highlight trade ideas using this analysis.
If you find this report helpful please hit that “like” button, share this post, and become a subscriber if you haven’t already done so!
🚨And be sure to check out Mosaic Traders Hub. It’s a members-only platform to alert trade ideas, track a model portfolio of open positions, and further analyze the message coming from the capital markets.
Now for this week’s issue…
A blowout payrolls report for the month of May shows a resilient economy, but investors are choosing to focus on the implications for monetary policy.
The labor market added 172,000 jobs last month compared to expectations for 80,000. At the same time, prior months were revised even higher from an already strong pace of job creation. That brings the three month hiring average to 188,000 jobs (chart below).

The sharp inflection higher in payrolls growth comes at a time when forward earnings estimates are also moving higher. While that bodes well for the outlook for economic growth, it’s also the latest challenge to monetary policy.
The outlook for the Federal Reserve’s interest rate policy has shifted in recent months due to inflation pressures stemming from supply chain upheaval, rising energy costs, and fiscal stimulus. The primary driver behind the most recent rate cuts was front-running any emerging weakness in the labor market.
But the May payrolls report continues a streak of exceptionally strong job growth and shows that concerns over labor market weakness is fading. With jobs and inflation running hot, market-implied odds are quickly repricing the outlook for rates.
Odds are pointing to a rate hike as soon as December, while the 2-year Treasury yield that tends to lead monetary policy jumped to 4.17%. That’s well above the current target for the fed funds rate and shows the bond market is pricing tighter monetary policy.
Stocks reacted to the jobs data and implications for rates by posting one of their worst decline this year. The S&P 500 fell by 2.6% while the Nasdaq dropped by 4.2% in a single session following the jobs data. While the major indexes remain positive on the year, it shows the sensitivity to valuations from interest rates.
This week, let’s look at building evidence that the labor market is seeing positive momentum and what the means for that earnings outlook. We’ll also look at the variables behind the stock market’s reaction and the historic surge in the S&P 500 since April.
The Chart Report
The nonfarm payrolls report isn’t the only sign the labor market is holding up against geopolitical uncertainty. Initial jobless claims continue running near historically low levels while job openings are picking up as well. The monthly government JOLTS report tracks the number of job openings, which showed openings surging to 7.6 million jobs during April. That’s the highest level of openings in nearly two years. Positive data on the labor market is a positive reflection on the state of the economy and also bodes well for the earnings outlook. The chart below plots the rate of change in job openings against the growth rate in S&P 500 earnings.

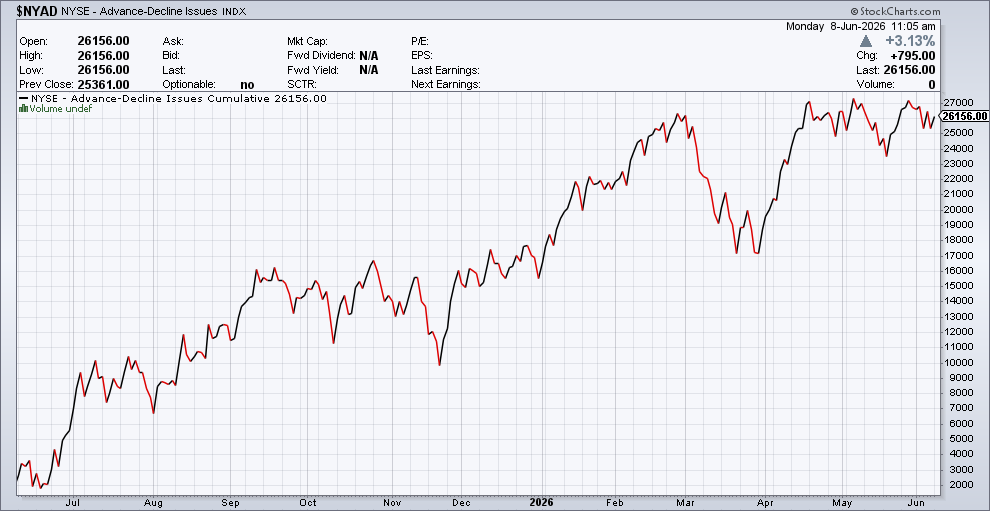
Evidence of solid economic activity is helping the average stock catch up to the gains in the S&P 500 and Nasdaq. The chart below plots the NYSE cumulative advance/decline line and is a way to track the average stock. The A/D line has been lagging cap-weighted indexes in breaking out to new highs, which showed breadth on the rally from late March narrowing. But the A/D line is filling out a pattern that could see the average stock breakout. Since late March, the A/D line is creating an ascending triangle patten with recent pullbacks growing smaller. A breakout from the pattern should translate to relative strength across the average stock and finally see the A/D line confirm the rally in the major cap-weighted indexes.
While fears are easing over the state of the labor market, inflations concerns remain elevated. In addition to the payrolls report, last week features updates on business activity in the manufacturing and services sectors of the economy. While those reports continue showing growth, the prices paid components keep pointing to rising inflation. Surveys on manufacturing and service sector activity from the ISM saw growth accelerate in May compared to April while leading indicators of activity jumped as well. The new orders component of the manufacturing survey was reported at 56.8 while services jumped to 57.3. The surveys are constructed so that a reading above 50 indicates expansion. But in the services report, the pries index rose to 71.3 and is the highest level since August 2022. The prices index tends to lead changes in the Consumer Price Index (CPI) in the chart below.

Rising inflation impacts equity valuations through the impact on interest rates. Higher rates present competition for investor capital and also decreases the present value of future expected corporate profits. Stocks could be especially vulnerable to rising rates as some measures of valuations are near the most expensive levels ever seen. That includes the S&P 500’s cyclically adjusted price-to-earnings ratio (CAPE). The CAPE ratio compares the current level of the S&P to a 10-year average of earnings to smooth out the business cycle. The CAPE ratio currently stands at 42.5 and has only been higher during the internet bubble in the late 1990s.

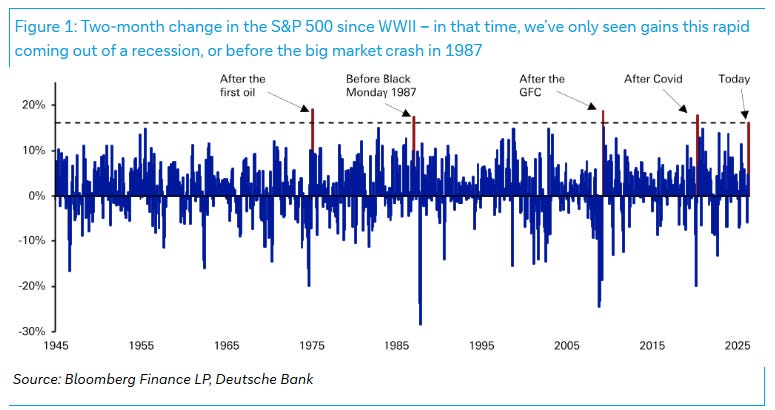
The S&P 500 is coming off a historic two-month return with the index gaining over 16% in April and May. Since the second World War, there’s only been four other instances where the S&P has seen a two-month stretch rivaling that return. During those prior instances, a strong two-month stretch happened when the economy was coming out of recession and stocks were in the early stages of a rally. Another occasion happened ahead of 1987’s stock market crash. With recent narrow breadth and the outlook for monetary policy quickly becoming more hawkish, investors should stay mindful of the bearish outcome in the months ahead.
Heard in the Hub
The Traders Hub features live trade alerts, market update videos, and other educational content for members.
Here’s a quick recap of recent alerts, market updates, and educational posts:
Investor positioning shows there’s room to run.
Valuations compressing as earnings growth surges.
Breadth and investor sentiment supporting recent gains.
A jump in earnings is another warning on the rate outlook.
A pharmaceutical stock trading tight in a base-on-base setup.
You can follow everything we’re trading and tracking by becoming a member of the Traders Hub.
By becoming a member, you will unlock all market updates and trade alerts reserved exclusively for members.
Trade Idea
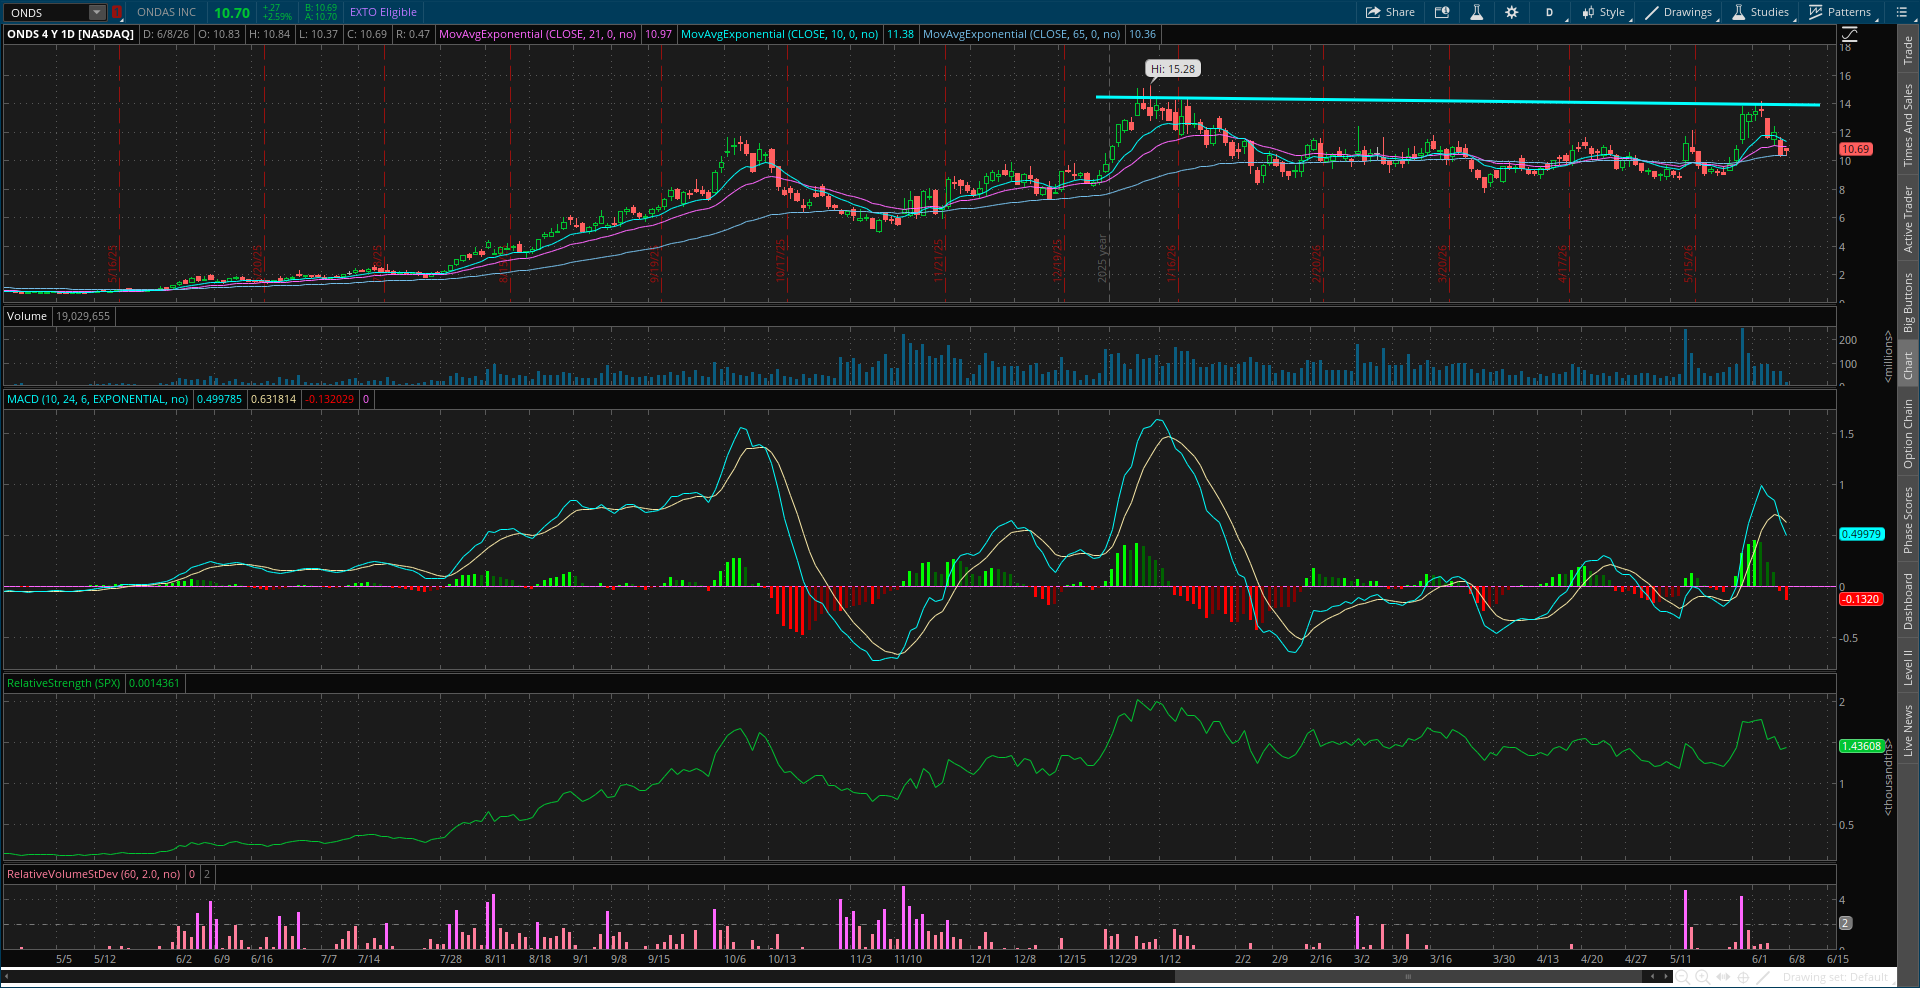
Ondas (ONDS)
Drone stock that peaked at the $15 level in January and now making a new basing pattern. A recent smaller pullback off $15 taking shape which needs to reset the MACD above the zero line. I’m watching for a move over $15.
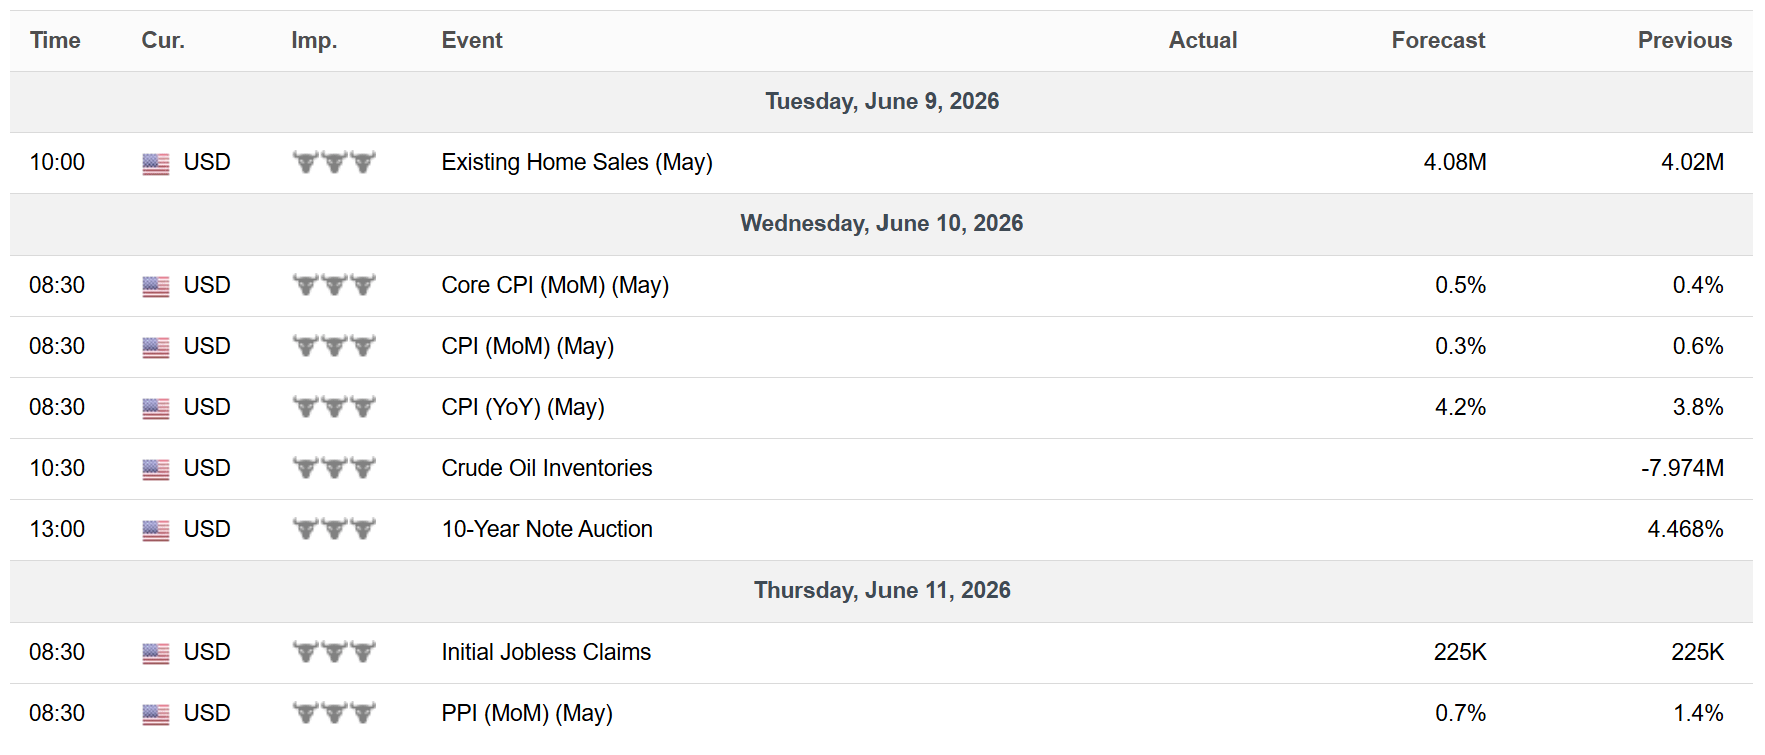
Key Upcoming Data
Economic Reports
Earnings Reports

I hope you’ve enjoyed The Market Mosaic, and please share this report with your family, friends, coworkers…or anyone that would benefit from an objective look at the stock market.
Become a member of the Traders Hub to unlock access to:
✅Model Portfolio
✅Members Only Chat
✅Trade Ideas & Live Alerts
✅Mosaic Vision Market Updates + More
Our model portfolio is built using a “core and explore” approach, including a Stock Trading Portfolio and ETF Investment Portfolio.
Come join us over at the Hub as we seek to capitalize on stocks and ETFs that are breaking out!
And if you have any questions or feedback, feel free to shoot me an email at mosaicassetco@gmail.com
Disclaimer: these are not recommendations and just my thoughts and opinions…do your own due diligence! I may hold a position in the securities mentioned in this report.
A CAPE of 42.5 alongside Q1 earnings growth of 22% year-on-year is the uncomfortable combination that most valuation frameworks were not designed to navigate. The multiple looks extreme by historical standards. The earnings trajectory justifies a premium by almost any forward-looking measure. Both can be true, and the allocation consequence depends entirely on which one you weight more.
What most allocators are signalling, 65% overweight equities in the June consensus, is that the earnings momentum is winning the argument over the valuation concern, at least for now. The dissenting note worth holding is that the overweight has been accumulating while conviction breadth has narrowed. A high multiple supported by broad earnings is durable. A high multiple supported by a handful of AI names compressing while the A/D line lags is a different risk profile.
If the breadth breakout you identify in the A/D ascending triangle confirms, the valuation concern becomes manageable.
If it fails, the 1987 reference earns more attention than most readers will give it today.