
The Market Mosaic 6.8.25
Bullish momentum pushes the S&P 500 near the peak.

👋Welcome back to The Market Mosaic, where I gauge the stock market’s next move by looking at macro, technicals, and market internals. I’ll also highlight trade ideas using this analysis.
If you find this report helpful please hit that “like” button, share this post, and become a subscriber if you haven’t already done so!
🚨And be sure to check out Mosaic Traders Hub. It’s a members-only platform to alert trade ideas, track a model portfolio of open positions, and further analyze the message coming from the capital markets.
Now for this week’s issue…
Economic reports spanning soft and hard data are providing a mixed picture on the state of the economy.
The ISM’s manufacturing PMI surveys purchasing managers at manufacturing firms every month. The report is structured so that a reading above 50 indicates expansion while under 50 points to contracting activity. The reading for May came in at 48.5, which points to shrinking activity and was below expectations.
Details within the report were cause for concern as well, including the imports component sinking to 39.9 which was the lowest level since 2009. The leading new orders component was reported at 47.6, while the employment measure came in at 46.8.
That was followed by the ADP report on private sector payrolls, which showed just 37,000 jobs created for the month of May. It was the lowest monthly job total since March 2023.
But just when it appeared that the trade war was starting to impact economic data, the May payrolls report calmed investors. It showed 139,000 jobs created during the month, which surpassed expectations for 125,000. The unemployment rate held steady at 4.2% as you can see in the chart below.

The beat on payrolls helped drive the S&P 500 to the 6,000 level for the first time since February, putting the prior all-time highs within reach.
This week, let’s dive further into last week’s key economic releases and look at what the details reveal about the state of the economy. We’ll also examine a key tailwind behind the S&P 500’s recent gains, and what the inflation cycle says about precious metals.
The Chart Report
The S&P 500 rallied by 1.5% last week, which took the index back to the 6,000 level and less than 2% below the prior all-time high set back in February. As I’ve discussed since April, I believe risk-parity and other systematic investors using volatility-targeting and trend following are a major factor behind the rally. The CBOE Volatility Index (VIX) has declined by 63% over the past nine weeks, creating room in risk budgets to add stock market exposure. Other momentum factors could be triggering recent buying pressure, including the S&P 500 making a 65-day high last week (chart below). That’s a level frequently used by CTAs as a positive trend following signal.

The monthly nonfarm payrolls report contains two different surveys. One is called the establishment survey, which contains information gathered from businesses. This is the figure typically referenced on monthly total job gains or losses. The household survey is used to generate data behind the unemployment rate and labor force participation rate. While the establishment survey showed 139,000 jobs added during May, the household survey showed a loss of 696,000 jobs (chart below).

While the manufacturing ISM came in less than expected and remains below 50 showing contraction, other details in the report hint that a rebound could be on the way. I like to track the ratio of new orders to customer inventories. A rising ratio indicates rising new orders or low customer inventories. Both conditions are historically favorable for future economic activity. In the May report, the new orders/inventories ratio showed a strong rebound (chart below) following a drop in recent months. That suggests an overall improving ISM figure could be expected in the months ahead.

There are signs of easing inflation across several measures. The most recent Consumer Price Index (CPI) came in at 2.3% compared to last year, which was the smallest gain since February 2021. The Fed’s preferred PCE inflation measure rose by 2.1%, which is close to the Fed’s target. But if history is any guide, then the trend of disinflation since mid-2022 could be coming to an end. The chart below shows the inflation cycle of the 1970s compared to the current cycle. If trends continue to track, then expect to see inflation reaccelerate during the second half of the year with tariffs being a potential catalyst.
")
If inflation does accelerate during the back half of the year, that could be a major tailwind for precious metals including silver. As noted to Hub members last week, silver is breaking out from an eight month consolidation. But based on silver’s long-term momentum, it could still be the early stages of an uptrend. The chart below shows silver’s 10-year rolling return. Rising inflation coupled with the U.S. Dollar Index recently losing key support are factors that could drive a third secular bullish cycle in silver prices.

Heard in the Hub
The Traders Hub features live trade alerts, market update videos, and other educational content for members.
Here’s a quick recap of recent alerts, market updates, and educational posts:
Common technical indicators to identify stage analysis.
How summer seasonality could lead to the next round of breakouts.
Pulling back the curtain on my proprietary trend following system.
What silver’s breakout could mean for the broader commodity trade.
You can follow everything we’re trading and tracking by becoming a member of the Traders Hub.
By becoming a member, you will unlock all market updates and trade alerts reserved exclusively for members.
👉You can click here to join now👈
Trade Idea
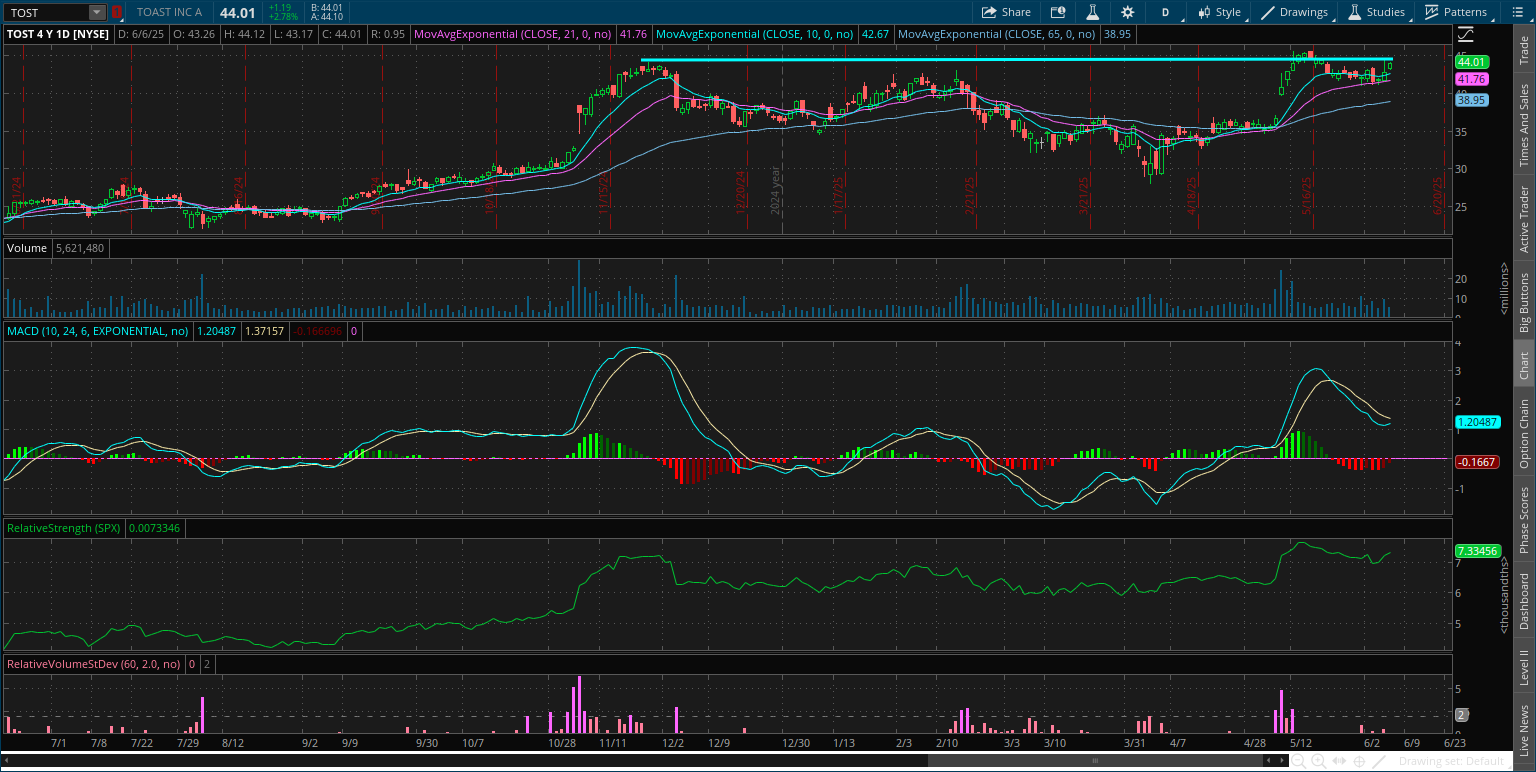
Toast Inc (TOST)
The stock is making a new base after peaking at the $45 area back in November. TOST retested that level in mid-May and is now making a smaller pullback that’s resetting the MACD above the zero line. I’m watching for a move over $45.
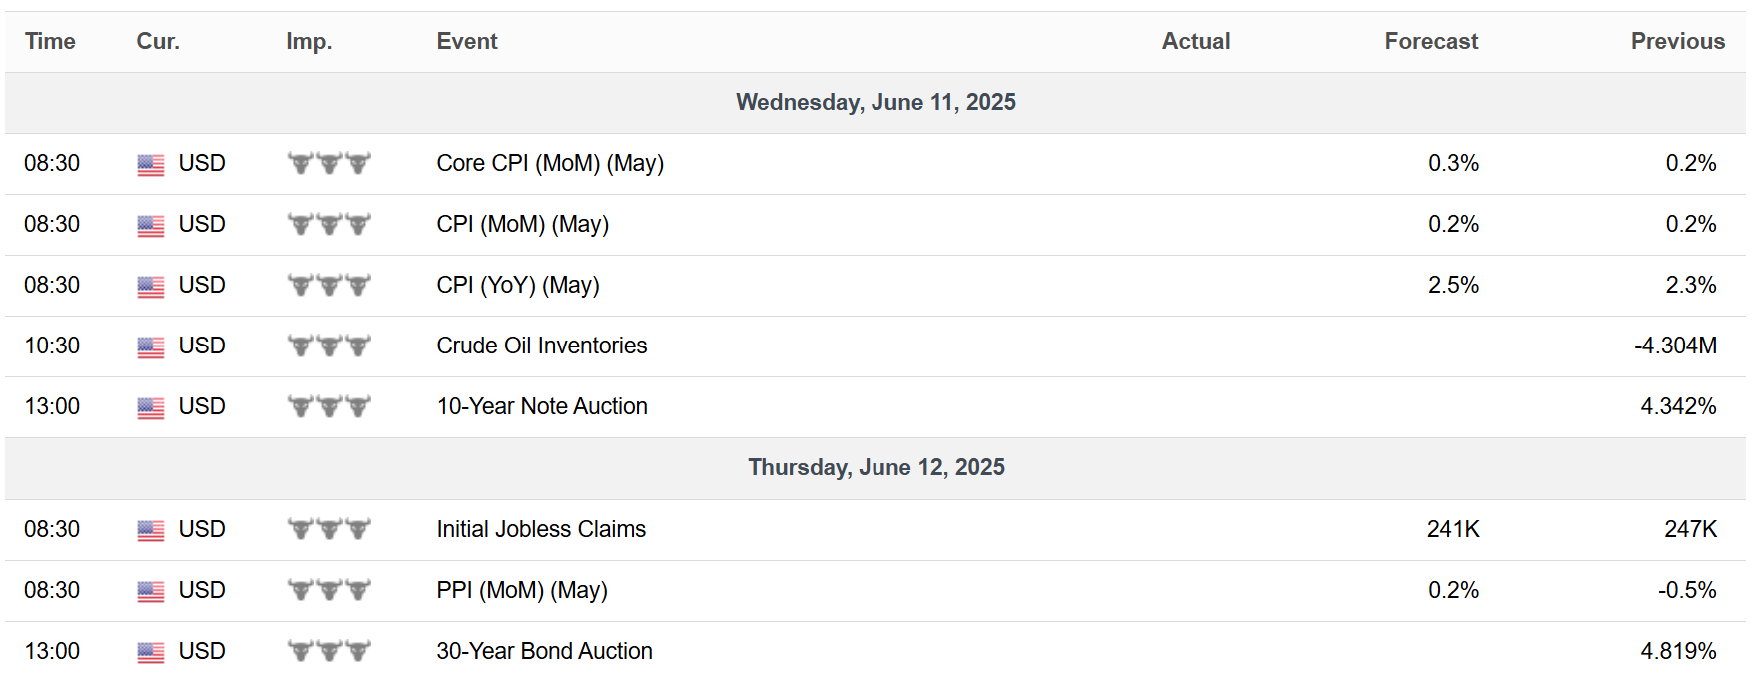
Key Upcoming Data
Economic Reports
Earnings Releases

I hope you’ve enjoyed The Market Mosaic, and please share this report with your family, friends, coworkers…or anyone that would benefit from an objective look at the stock market.
Become a member of the Traders Hub to unlock access to:
✅Model Portfolio
✅Members Only Chat
✅Trade Ideas & Live Alerts
✅Mosaic Vision Market Updates + More
Our model portfolio is built using a “core and explore” approach, including a Stock Trading Portfolio and ETF Investment Portfolio.
Come join us over at the Hub as we seek to capitalize on stocks and ETFs that are breaking out!
And if you have any questions or feedback, feel free to shoot me an email at mosaicassetco@gmail.com
Disclaimer: these are not recommendations and just my thoughts and opinions…do your own due diligence! I may hold a position in the securities mentioned in this report.