The Market Mosaic 6.5.22
The good, the bad, and the ugly...
Welcome back to The Market Mosaic, where I gauge the stock market’s next move by looking at trends, market internals, and the mood of the crowd.
I’ll also highlight one or two trade ideas I’m tracking using this information.
And if you find this content helpful, hit that “like” button (you know, the one that looks like a heart). Because I heart you too…
Please share this post, and become a subscriber to this always free newsletter if you haven’t already done so!
And for updated charts, market analysis, and other trade ideas, give me a follow on twitter: @mosaicassetco
Now for this week’s issue…
I want to start this week with my conclusion from the last newsletter:
“Ever since the relief valve was hit on the downside pressure, I now see opportunities to play both sides of the stock market.”
The bottom line is that we were tracking the potential for a bear market rally, which is exactly what we got…a quick 5% pop since the last week of May. But that rally stalled out in a holiday-shortened trading week.
That’s left the S&P 500 in a precarious position as you can see below. Price has rallied back to the very important breakdown level at 4200, with the 50-day moving average quickly converging with that resistance point. At the same time, the MACD is resetting at the zero line, telling me that a mean-reverting upside move has run its course.
I also noted how quickly overbought conditions arrived in last week’s newsletter, but I’m not ready to call for renewed downside just yet, and I still think there’s opportunities to play both the long and short side of this market. Here’s what I’m watching and a couple ideas.
The Good
In my opinion, one of the most notable developments in the past couple weeks has been on the volatility front. I discussed the breakdown in VVIX, or the “volatility of volatility” last week…and it has continued to plunge. At the same time, the VIX index itself finally broke below 25, which is part of a pattern we’ve tracked for nearly a month now.
Now here’s something important. During a big selloff in stocks on Friday which saw the S&P 500 plunge 1.6%, the VIX barely budged as recapped here:
We’re also seeing relative strength from former downside leaders, including small-caps. I’ve talked about the major support levels coming into play for small-caps here. The chart below shows a ratio of the small-cap ETF (IWM) against the S&P 500 (SPY). It may not look like much, but recent relative strength is a marked change from the overall trend since March 2021.
The Bad
Short-term breadth is still quite oversold, and is at a level that I’m typically hesitant to add new swing long positions. Here’s an updated look at the percent of stocks trading above their 20-day moving average. This was a negative factor noted last week, and it’s not any better now.
The path of interest rates has also been a challenge for stocks overall. I noted a key level in play for the 10-year Treasury yield, and here’s a quick update I posted on Twitter:
There are two reasons why you want to see the 10-year break below that moving average to support stock valuations. First, capital flows to where it can earn the best return, and right now the return on risk-free assets like Treasuries are quickly getting better…so more competition for stocks. Also, higher rates make future corporate cash flows worth less (discounted cash flow explanation), negatively impacting valuations today. Those are two big reasons why you need to watch interest rates right here.
Now What (The Ugly)
The ugly is that I still believe the bigger force in play is a bear market. And based on what I’ve recapped today, there isn’t a clear path forward over the near-term. So I’m being tactical and open to trades on both the upside and downside.
For long positions, look for relative strength and stocks bucking the overall market downtrend. Last week I shared Western Midstream (WES) which continues to emerge from a basing pattern and is hitting the highest levels seen in almost three years. Here’s a chart update below as WES took out key resistance at $27.
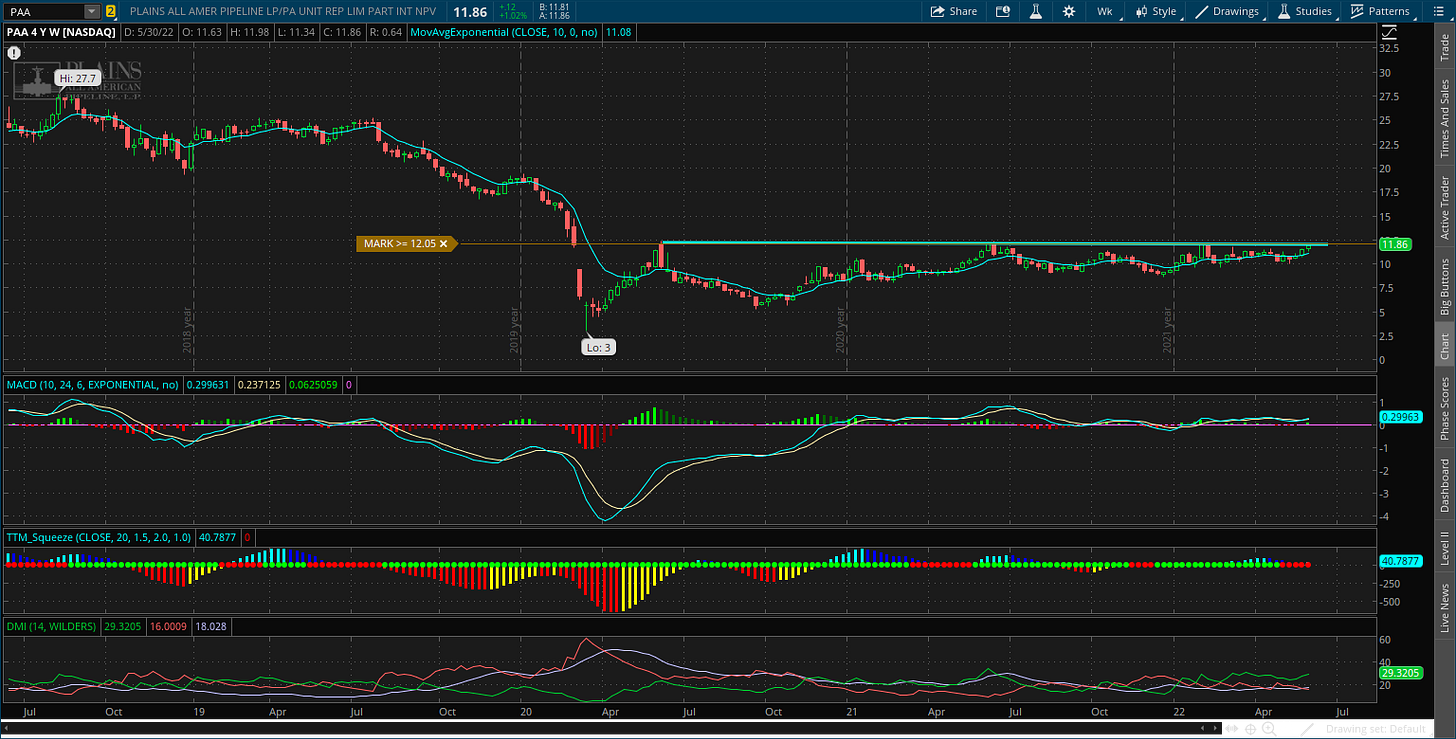
I’m watching other companies in the energy midstream space, including MMP and PAA. Here’s a weekly chart of PAA below, where I’m watching for a move over the $12 level. It’s always a good sign when you see similar breakout patterns taking shape across stocks in the same industry.
On the short side, I still think fertilizer stocks offer one of the best setups. I posted an update here on several stocks I’m watching:
In summary, the stock market remains on a shaky foundation and signs of overbought conditions have emerged recently. But at the same time, finding relative strength (like commodity sectors) have demonstrated that it’s still possible to make money on the long side of the market, you just have to be tactical and selective. I’m still taking small positions in breakouts and breakdowns that meet my criteria, but I’m not being overly aggressive in either direction.
That’s all for this week. I hope you’ve enjoyed this edition of The Market Mosaic, and please share this newsletter with anyone you feel could benefit from an objective look at the stock market.
Make sure you never miss an edition by subscribing here.
Disclaimer: these are not recommendations and just my thoughts and opinions…do your own due diligence! I may hold a position in the securities mentioned in this newsletter.


