The Market Mosaic 6.4.23
A Goldilocks scenario for the stock market.
Welcome back to The Market Mosaic, where I gauge the stock market’s next move by looking at macro, technicals, and market internals. I’ll also highlight trade ideas using this analysis.
If you find this content helpful please hit that “like” button, share this post, and become a subscriber to this always free report if you haven’t already done so!
And be sure to check out Mosaic Chart Alerts. It’s a midweek update covering chart setups among long and short ideas in the stock market, along with levels I’m watching.
Now for this week’s issue…
When the May payrolls report was released on Friday, the numbers absolutely smashed expectations with the addition of 339,000 jobs. That compares to economist expectations for just 190,000, and continues a string of better than expected payrolls data as you can see in the chart below.
But what’s even more notable is what happened with market implied odds for an interest rate hike at the Federal Reserve’s next meeting on June 14th. At last glance, odds for another rate hike stands just 25% as you can see below.
That’s remarkable given core consumer inflation is still 5.5% and the most recent jobs report shows a resilient labor market. Given the Fed’s dual mandate of price stability and full employment, you would think the central bank has the green light for another hike.
But Fed officials spent the past week talking down expectations for another rise in interest rates, solidifying the notion that a pause in hikes has arrived. That makes sense, reflecting the lag time for rate hikes to make their way through the economy.
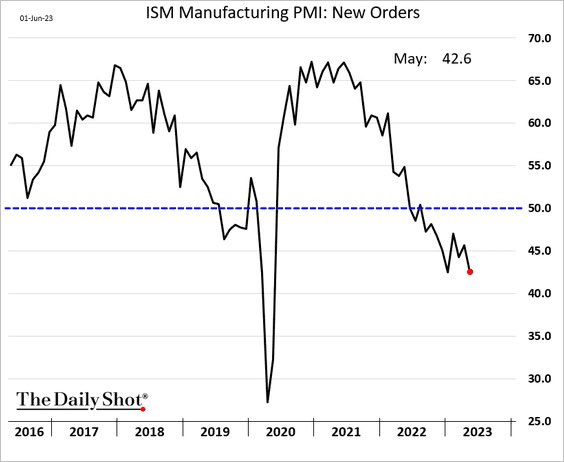
Following the fastest rate hiking campaign in history, leading indicators are still pointing to weakness ahead. You saw more evidence this week with the ISM manufacturing survey, where the leading new orders component sunk to 42.6 and remains firmly in contractionary territory under 50 (chart below).
But for now, the macro and monetary policy backdrop could be setting up a Goldilocks environment for the stock market: a pause in rate hikes accompanied by signs that the economy (at least in its current state) is chugging along.
And the market action that unfolded on Friday delivered evidence that could be the case. Here are some very positive takeaways from market action last week.
Strong Gains Spreading Beyond the S&P 500
I’ve written frequently over the past month about the importance of watching cyclical sectors, and the need for the average stock to catch up to the cap-weighted indexes like the S&P 500.
And at one point last week, the S&P 500 was up nearly 10% year-to-date while the median stock in the index was actually down slightly on the year. That shows narrow leadership in the market.
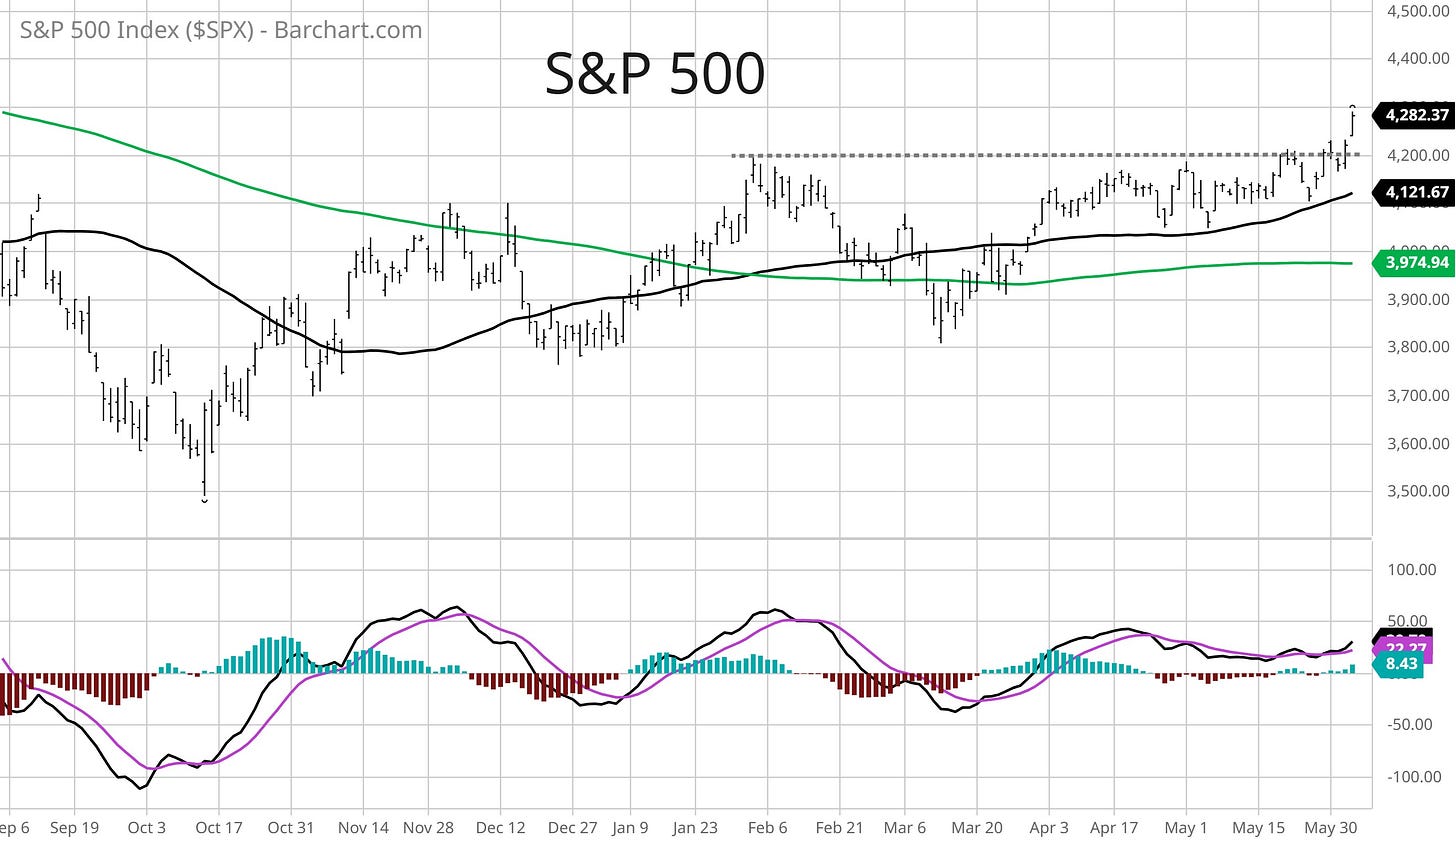
But things can change quickly. Friday delivered strong gains for the S&P, with the index firmly taking out the 4200 resistance area that has held since early February (chart below).
But the gains weren’t just reserved for big tech stocks in the S&P 500. A broad rally across sectors delivered a wave of positive signals. The first is with the ratio of advancing stocks to declining ones. I track the NYSE A/D ratio on a daily basis to measure participation in the trend.
And Friday’s reading clocked in at over 10 to 1 with the S&P up 1.4% on the day. That’s the strongest A/D ratio since last October/November which also accompanied a strong rally in the index as you can see below.
Better participation was also evident in net new highs across the market. This is a great way to track for broadening action in either direction, and the dismal persistence of net new lows over the past three months is finally showing signs of reversing.
Net new highs simply takes stocks making 52-week highs and subtracts 52-week lows, and Friday’s number of net new highs is the best level since early March as you can see below. That’s another sign of expanding participation as the S&P 500 breaks out over 4200.
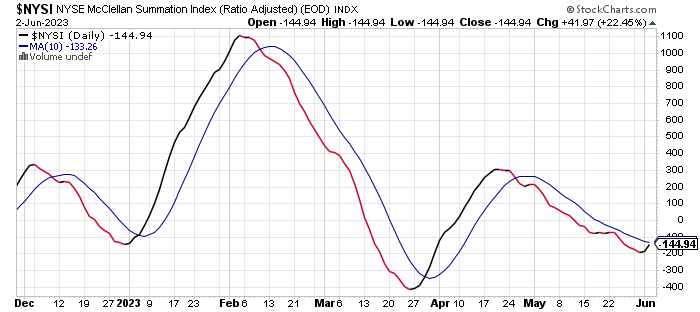
I’m also watching the McClellan Summation Index for further confirmation of expanding breadth. This metric takes a trailing sum of advancing versus declining stocks on the NYSE, and I generate a signal by applying a 10-period moving average. You can see that we are nearing the first positive crossover since March.
There are several early indications that the average stock is ready to catchup to the major indexes. The next thing to watch is with cyclical sectors, and messaging on the earnings outlook.
Now What…
Along with strong breadth late last week, key cyclical sectors are also showing impressive action. Small-cap value is one area of focus with the IWN ETF, especially given its exposure to recent problems areas like regional banks and REITs.
After bouncing off a key support level several times since March, IWN gained over 4% on Friday to close above key short-term moving averages as well (chart below).
Positive action is also unfolding across industrial stocks. This economically-sensitive group is coming up to an important resistance level around the $105 area that you can see with the XLI industrials ETF below (weekly chart). That’s a level that has held since the middle of 2021. A breakout by industrials over that level would be another positive signal from a cyclical sector.
If these sectors can keep rallying and show relative strength, that’s a great sign investors expect the economy will keep growing and shake off some of the concerns coming from leading indicators for now.
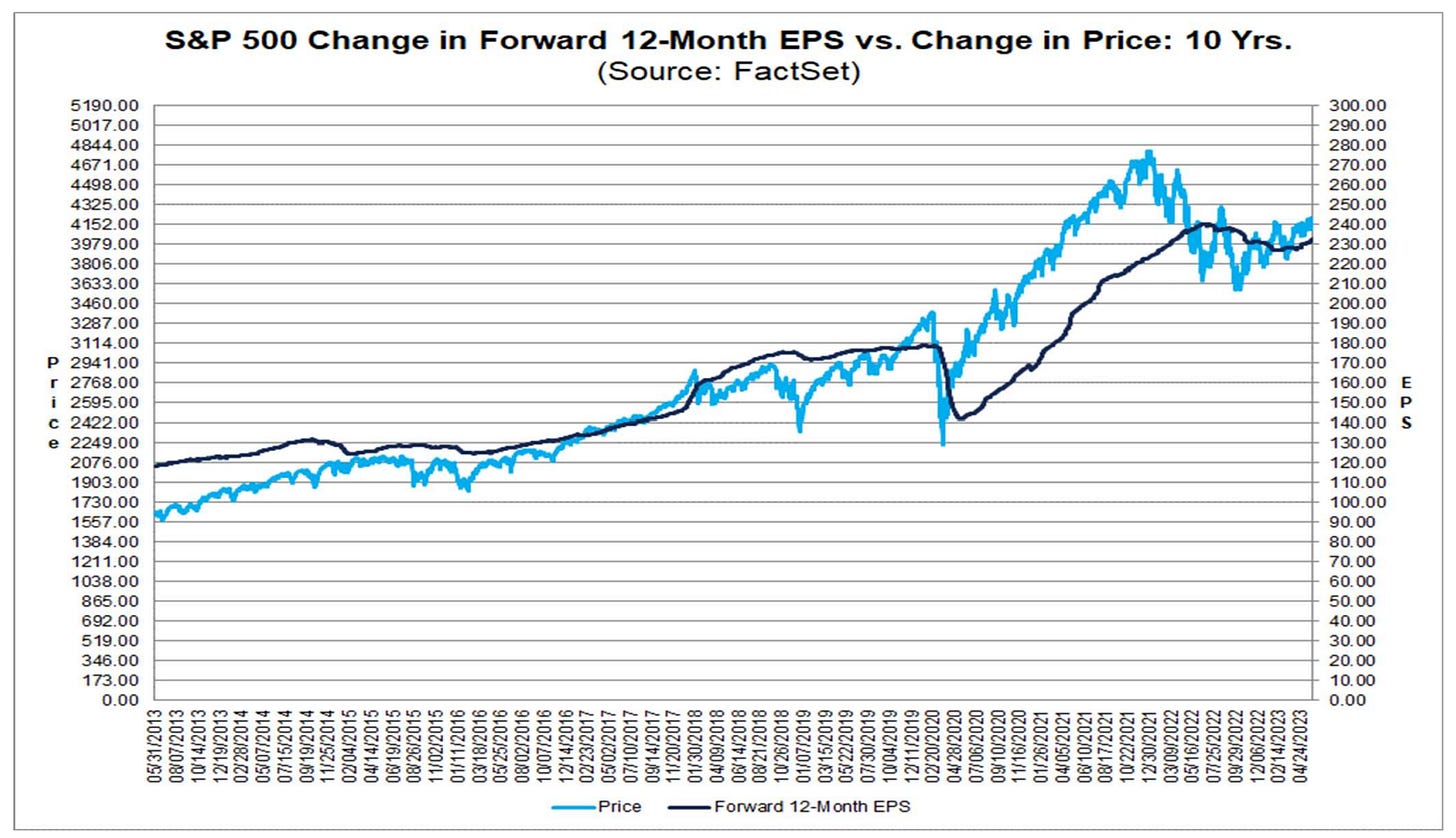
That would help drive an earnings recovery, which is badly needed for the stock market to escape from 2022’s bear market. And based on forward analyst estimates (black line in the chart), there are early signs that earnings are turning the corner as you can see below.
Given the broadening action across the stock market, that means I can be more selective about my trade setups. I’m targeting stocks that are basing just below all-time highs and are experiencing (or expected to experience) strong sales and earnings growth.
LTH is a great example, where the stock is basing just below the highs following the stock’s IPO in 202. The relative strength line is hovering near the highs and the MACD is resetting at the zero line in the chart below.
That’s all for this week. With the debt ceiling also in the rearview, perhaps headwinds to more breakouts are finally out of the way. I will be looking for further expansion in net new highs along with a positive crossover in the McClellan Summation Index for more confirmation that the average stock is ready to rally.
I hope you’ve enjoyed The Market Mosaic, and please share this report with your family and friends…or anyone that would benefit from an objective look at the stock market.
And make sure you never miss an edition by subscribing here:
For updated charts, market analysis, and other trade ideas, give me a follow on Twitter: @mosaicassetco
And if you have any questions or feedback, feel free to shoot me an email at mosaicassetco@gmail.com
Disclaimer: these are not recommendations and just my thoughts and opinions…do your own due diligence! I may hold a position in the securities mentioned in this report.


