The Market Mosaic 6.30.24
Liquidity conditions improving for stocks.
Welcome back to The Market Mosaic, where I gauge the stock market’s next move by looking at macro, technicals, and market internals. I’ll also highlight trade ideas using this analysis.
If you find this content helpful please hit that “like” button, share this post, and become a subscriber to this always free report if you haven’t already done so!
And be sure to check out Mosaic Chart Alerts. It’s a midweek update covering chart setups among long and short trade ideas in the stock market, along with levels I’m watching.
Now for this week’s issue…
***A quick note before this week’s issue. I am traveling through July 8 and will not be publishing my usual reports this coming week. I will still post thoughts on the stock market and trade setups on Notes and in the Chat. Have a great week!***
For today’s update, I want to highlight several key charts I’m watching for the capital markets and how they are impacting the near-term outlook.
I also have a quick summary and links to recent posts that remain impactful for monitoring the markets. And after that, you can find a few trade ideas and chart updates on setups that I’m monitoring.
Big Picture
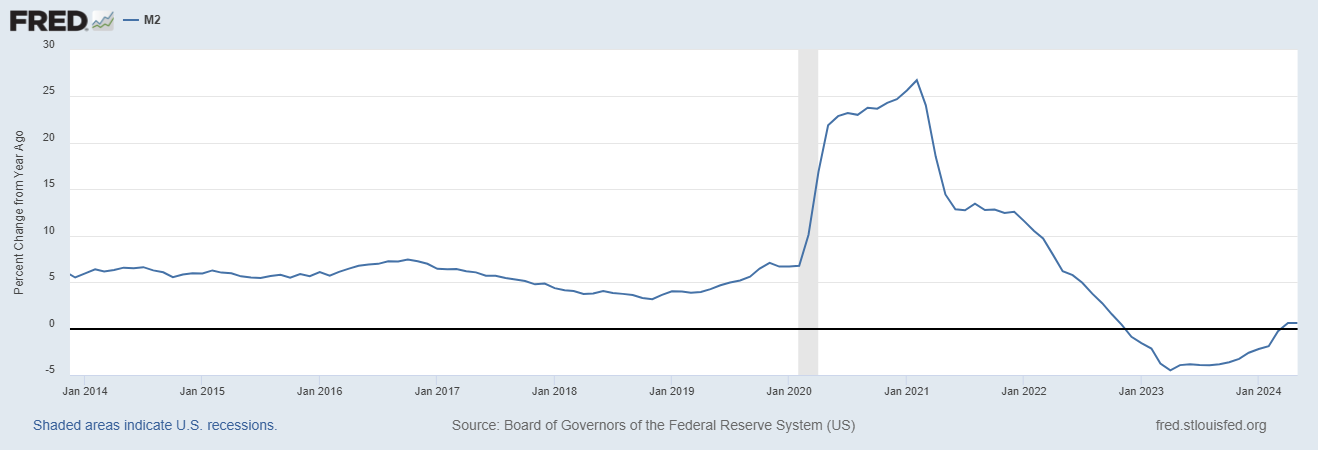
Liquidity is the lifeblood of asset prices, especially speculative ones like stocks and cryptocurrencies. The M2 money supply is one way to monitor liquidity trends, and the year-over-year rate of change in M2 is turning positive this year. That’s significant because M2 surged in the wake of the pandemic, which helped drive good times in stocks. The M2 measure peaked in 2021 and fell through early 2023, which is a time period that captured 2022’s bear market in the S&P 500. After falling into negative territory for the first time ever at the end of 2022, M2 growth went positive in April.
The improvement in M2 money supply is happening at an interesting time against the backdrop of the liquidity cycle. The chart below plots a 65-month cycle in liquidity conditions, where upturns and downturns in the cycle have marked several key stock market inflection points in the past. The most recent upturn in the cycle is projected to last into late 2025, which turned higher near the S&P 500’s bear market bottom in October 2022.

The most recent personal consumption expenditures (PCE) price index for May increased 2.6% year-over-year. The core figure that strips out food and energy prices also increased 2.6% and slowed from the prior month’s gain of 2.8%. But it was the “supercore” measure that delivered the most dovish take. That measure of core services inflation, which Federal Reserve Chair Jerome Powell has highlighted as key for the inflation outlook, rose by 0.1% in May compared to the prior month. It was the smallest monthly increase since last August, with five sub categories actually falling.
A strong outlook for the economy and improving liquidity backdrop is being reflected by high yield bonds. The spread on high yield bonds measures the relative cost that companies of lower credit quality pay to issue debt compared to safer issuers like U.S. Treasury securities. The spread is sensitive to the outlook for economic conditions, since companies issuing high yield debt are most sensitive to defaulting on their debt obligations. That spread has compressed since mid-2022, and is trading near the lowest level of the past 28 years.
A strong period of seasonality is coming up for the S&P 500. The chart below shows the S&P 500’s seasonal trends over the past 20 years, and you can see that the end of June through the month of July has historically been strong for returns. After that, returns for the S&P become more volatile through the end of October and into the elections. And from there, the S&P starts the most favorable six month historical stretch starting in November.
A strong start to the first half of the year has historically set up a strong finish. The table below looks at instances when the S&P 500 is up 10% or more during the first six months of the year, and how the second half has played out during those years. In past instances, the rest of the year has gone on to deliver additional gains of 7.7% on average for a total annual return of 25%. The second half was also higher nearly 83% of the time. With the S&P up 14.9% through the first half of this year, historical tendencies bode well for forward returns.

Mosaic Tidbits
Here are a few of my recent posts that are still impactful and relevant to the stock market’s next move:
Stock market breadth is lagging the indexes like the S&P 500 badly since the end of May. But bullish signs are emerging under the hood for the average stock.
Divergences in the stock market can show up in either breadth or momentum. Here’s how I use both to confirm the stock market’s trend, and look for signs of pending reversals.
A strong economy that boosts the corporate earnings outlook is critical to drive the bull market forward. One economic indicator recently rose to its best level in 26 months.
Following big moves in Apple AAPL 0.00%↑ , Nvidia NVDA 0.00%↑ , and Microsoft MSFT 0.00%↑, the next group of mega-cap stocks are setting up breakouts that can carry the S&P 500 higher.
Chart Updates
Palantir PLTR 0.00%↑
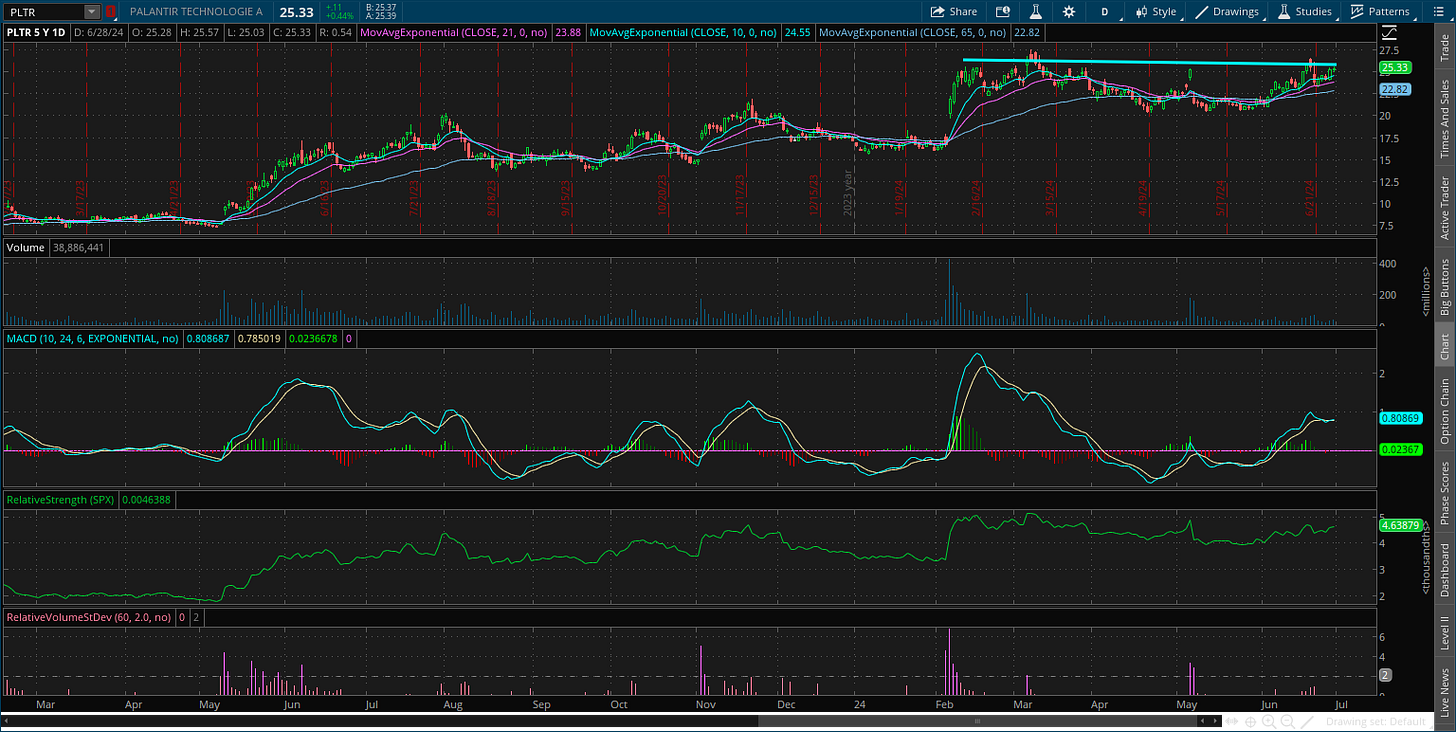
Trading in a new basing pattern since February following a big gap higher. Recently turning back higher toward resistance around the $25 level. Would now like to see the MACD reset at zero on a small pullback in price. Watching for a move over $25 with confirmation by the relative strength (RS) line making a new 52-week high.
Reddit RDDT 0.00%↑
After going public back in March, price is basing near the post-IPO highs while the MACD is turning higher from the “hook” pattern that I’ve described in videos. Now watching for a new high over $70 with the RS line at a new high.
Sezzle SEZL 0.00%↑
Price basing since late March just below the $100 level. Making a series of smaller pullbacks since then, with the MACD starting to turn up from the zero line. The RS line is also near the highs. Watching for a breakout over $95.
I hope you’ve enjoyed The Market Mosaic, and please share this report with your family, friends, coworkers…or anyone that would benefit from an objective look at the stock market.
And make sure you never miss an edition by subscribing here:
For updated charts, market analysis, and other trade ideas, give me a follow on X: @mosaicassetco
And if you have any questions or feedback, feel free to shoot me an email at mosaicassetco@gmail.com
Disclaimer: these are not recommendations and just my thoughts and opinions…do your own due diligence! I may hold a position in the securities mentioned in this report.


Just bought a bag in PLTR at the EOD Friday. I trade this one often but stock held that $25 level so I said let me stay long.
Nice Report Mosaic. Enjoy the Vacation!!