
The Market Mosaic 6.29.25
S&P 500: Seasonal trends and investor positioning can fuel the rally.

👋Welcome back to The Market Mosaic, where I gauge the stock market’s next move by looking at macro, technicals, and market internals. I’ll also highlight trade ideas using this analysis.
If you find this report helpful please hit that “like” button, share this post, and become a subscriber if you haven’t already done so!
🚨And be sure to check out Mosaic Traders Hub. It’s a members-only platform to alert trade ideas, track a model portfolio of open positions, and further analyze the message coming from the capital markets.
Now for this week’s issue…
Easing geopolitical tensions, optimism around trade negotiations, and hopes for interest rate cuts from the Federal Reserve sent major stock indexes to new record highs.
The S&P 500 finished the week up more than 3%, and has gained nearly 28% from the early April lows. The initial spark for last week’s gains followed a ceasefire between Israel and Iran.
Tensions looked set to escalate after the U.S. joined strikes against Iran, hitting three nuclear facilities. Iran retaliated with missile launches against a U.S. base in Qatar. But those strikes turned out to be more symbolic with a pause in hostilities announced a short while later.
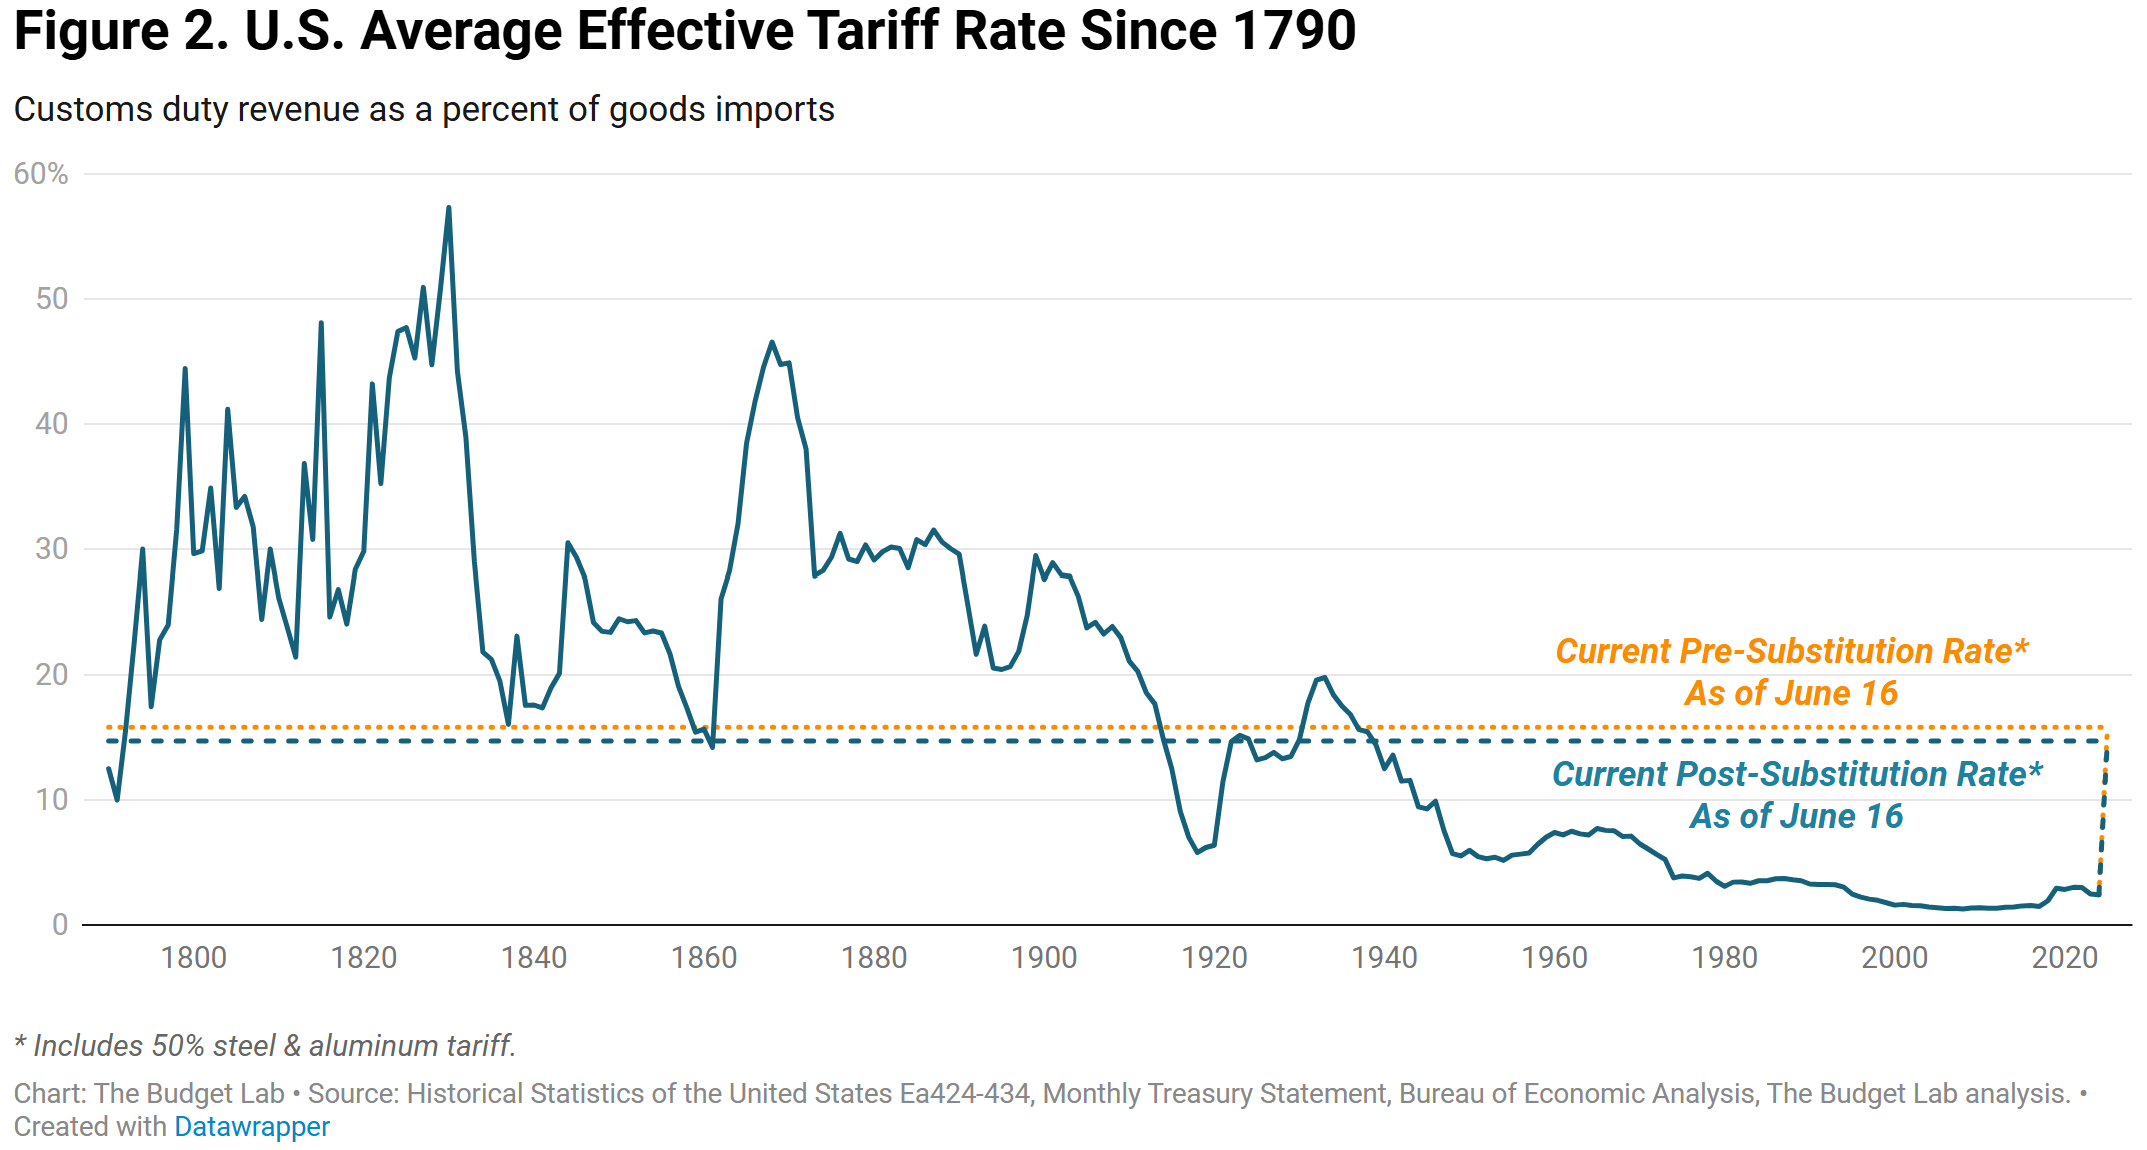
Investors also received some relief from uncertainty around tariffs and trade negotiations. President Trump announced that a trade deal has been signed with China, while another White House official stated that 10 more deals are imminent. The effective tariff rate currently sits at 15.8% (chart below), which is the highest level since 1936.
While the 90-day pause on reciprocal tariffs is fast approaching its end, the White House signaled flexibility on the deadline to allow further progress on trade talks.
Due to the potential impact of tariffs on the inflation outlook, the Federal Reserve has been reluctant to budge on interest rates until more clarity is gained. But with growing optimism on the trade front, market-implied odds are now pointing to three 0.25% rate cuts this year.
This week, let’s dive further into bullish conditions that can keep the rally in the S&P 500 intact over the near-term. We’ll also look at evidence that inflation could be a problem in the second half of the year despite the good news on the tariff front.
The Chart Report
The S&P 500 hit a new all-time record high when the index closed the week at 6173. That surpassed the February 19 peak in the market, when the index briefly fell into bear market territory on April 7. That means it only took 89 trading days for the S&P 500 to reach another new record high. That’s the fastest recovery to new highs following a decline of at least 15%. And there could be more gains in store based on seasonality. Historically, July has been one of the strongest calendar months of the year (chart below), and has seen gains for 10 years in a row.

Despite the recovery in the S&P 500 to new record highs, bearish investor moods are prevailing across several measures of sentiment and positioning. In the most recent update, the AAII survey of retail investors showed bearish views at 40.3% compared to bullish views at 35.1%. That’s the second week in a row where bears have outnumbered bulls, with bearish views running well above the historical average of 31.0%. Bearish positioning is also showing up in data tracking stock index futures exposure. Net positioning in S&P 500 futures by hedge funds and large speculators is showing an increase in short exposure. Short exposure relative to open interest is the largest since early 2024 (chart below).

The outlook for interest rate cuts is recently becoming a positive catalyst for the stock market. There’s been much debate on the appropriate level of rates following the Fed’s latest meeting. Fed Chair Jerome Powell stated that “we expect a meaningful amount of inflation to arrive in coming months.” President Trump has launched several verbal attacks on Powell, and has called on the Fed to cut rates to 1.0% as inflation has dropped near the Fed’s 2.0% target. Given the Fed’s concern around tariffs, recent good news on trade front is stoking investor hopes that more rate cuts could be in store for this year. The chart below shows that market-implied probabilities points to three 0.25% cuts by the end of the year, with a greater than 50% chance that the target rate is 3.50% - 3.75% or lower versus the current range of 4.25% - 4.50%. That’s up from two cuts recently being priced.

The most recent personal consumption expenditures (PCE) price index, which is the Fed’s preferred inflation gauge, rose by 2.3% in May compared to last year. But several leading indicators of inflation warn of accelerating inflation ahead. The chart below plots the prices paid component of the ISM’s manufacturing survey against the Consumer Price Index (CPI) and shows rising inflation could be an issue in the second half of the year. The prices paid component is primarily reflecting the impact of tariffs, while a recent jump in commodity prices could present upward pressure on prices as well.

There are other reasons why Fed officials are reluctant to cut interest rates. Waiting to see the impact of tariffs might be one of them. Another factor is evidence that the economy is holding up against the current level of fed funds thus far. While the final report on first quarter GDP showed an annualized decline of 0.5%, the decline was largely driven by a surge in imports ahead of expected tariffs (which counts against GDP’s calculation). In the same report, real final sales to private domestic purchasers rose by 1.9% (chart below). That’s a better way of gauging underlying demand and has stayed in positive territory.

Heard in the Hub
The Traders Hub features live trade alerts, market update videos, and other educational content for members.
Here’s a quick recap of recent alerts, market updates, and educational posts:
Taking partial profits on a gold mining stock.
Why retirement portfolios are exposed to inflation.
The setup in CYBR and its bullish accumulation pattern.
Adding several breakouts to take advantage of relative strength.
You can follow everything we’re trading and tracking by becoming a member of the Traders Hub.
By becoming a member, you will unlock all market updates and trade alerts reserved exclusively for members.
👉You can click here to join now👈
Trade Idea
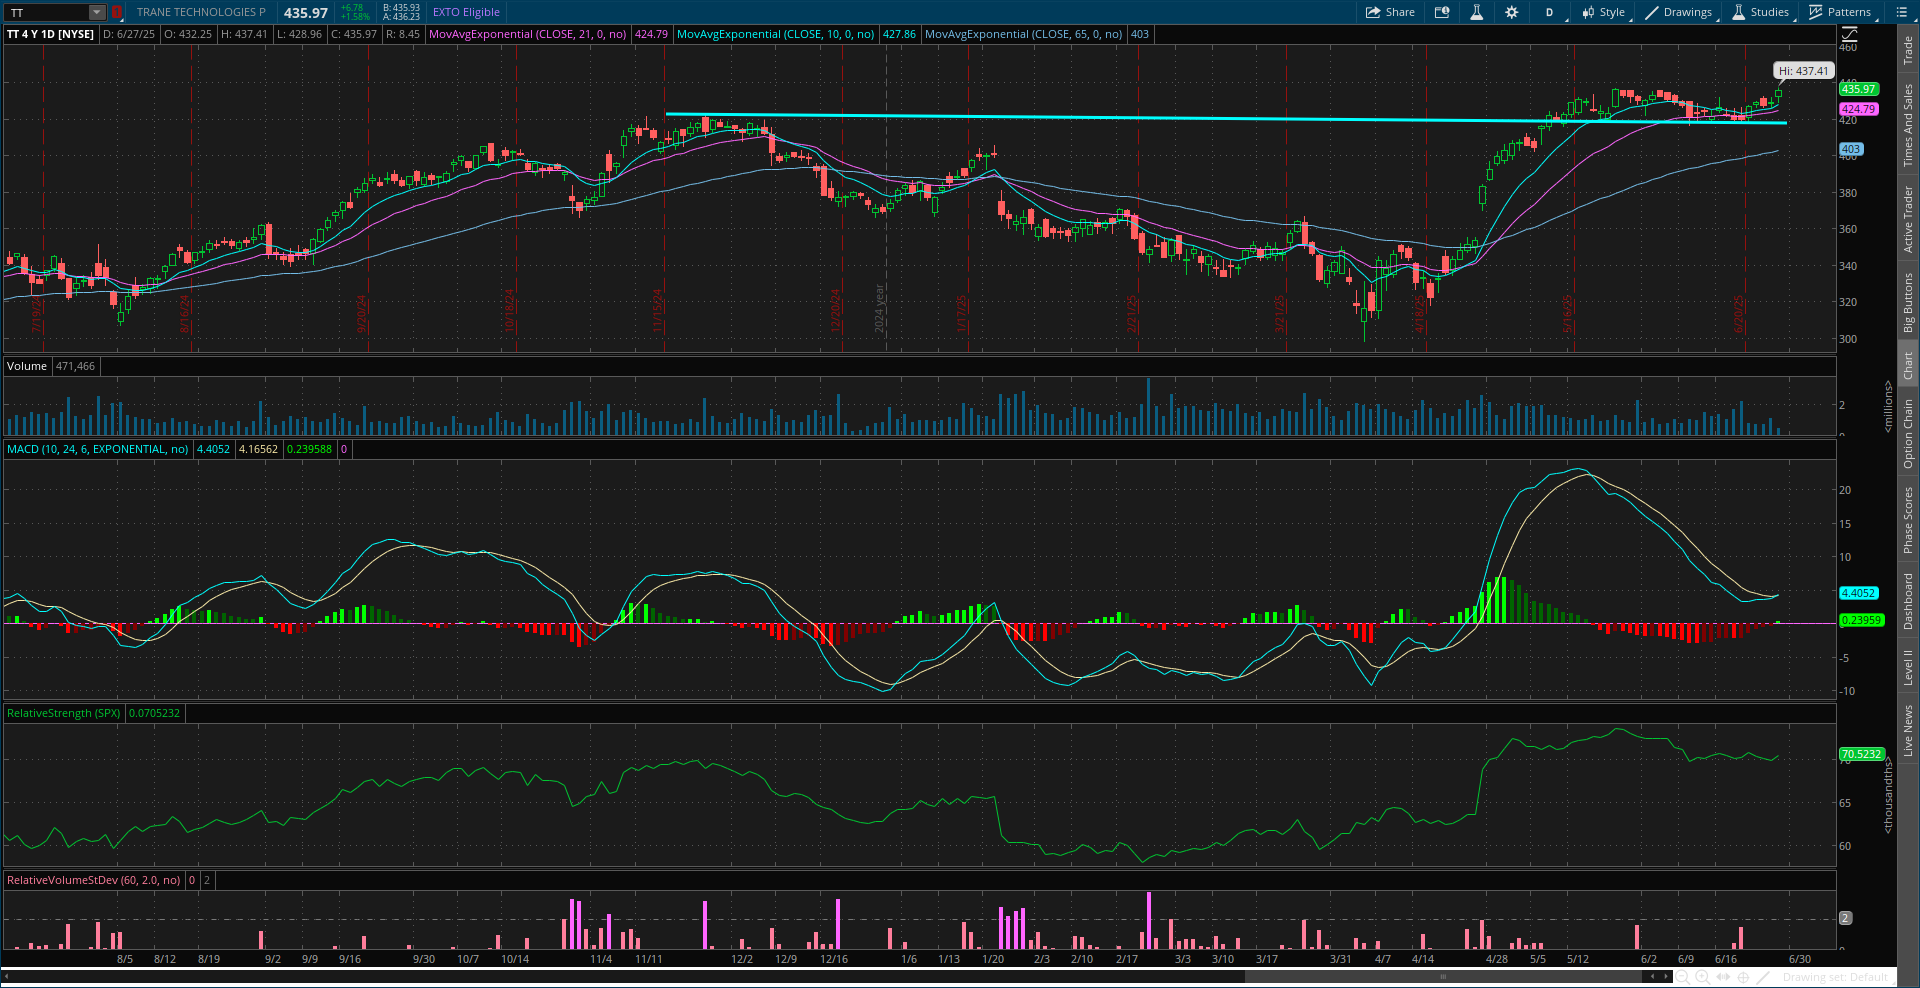
Trane Technologies (TT)
The stock recently jumped to a new high above the $420 level first hit back in November. The stock is trading in a tight range and consolidating the recent move higher, which is creating a base-on-bas pattern. I’m now watching for a move over $440.
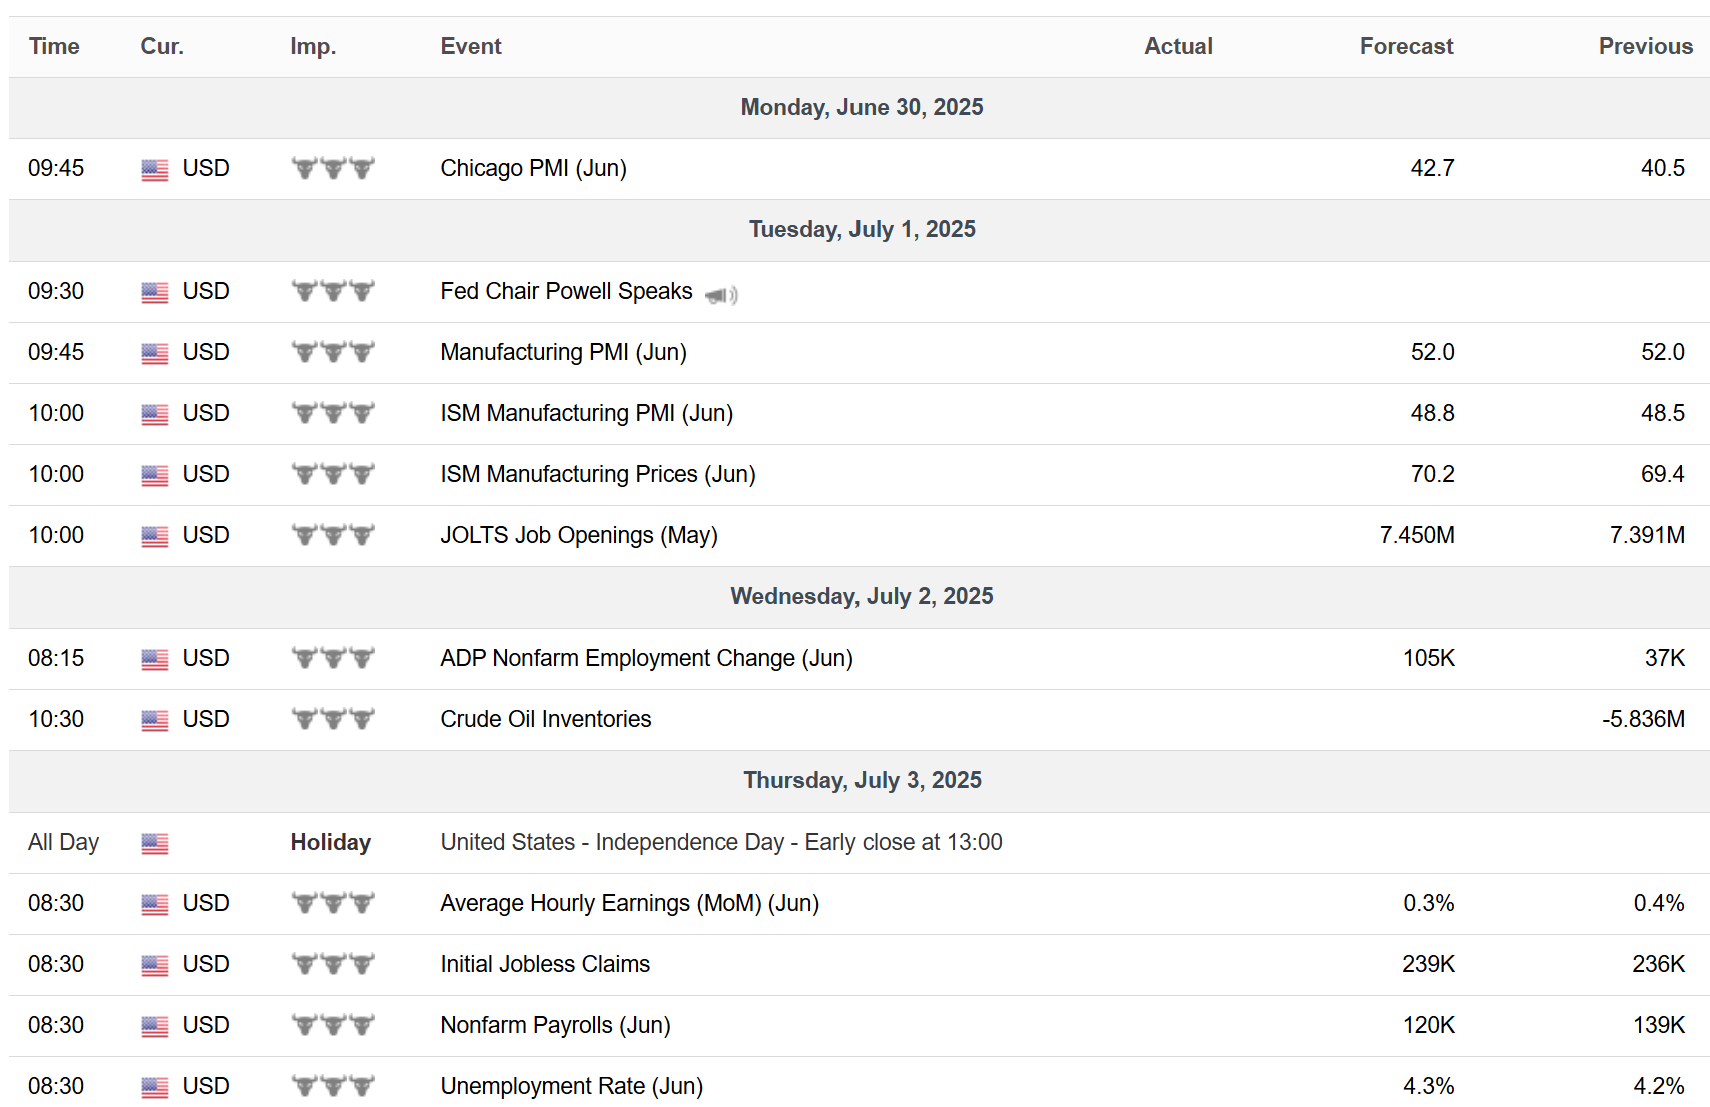
Key Upcoming Data
Economic Reports
Earnings Releases

I hope you’ve enjoyed The Market Mosaic, and please share this report with your family, friends, coworkers…or anyone that would benefit from an objective look at the stock market.
Become a member of the Traders Hub to unlock access to:
✅Model Portfolio
✅Members Only Chat
✅Trade Ideas & Live Alerts
✅Mosaic Vision Market Updates + More
Our model portfolio is built using a “core and explore” approach, including a Stock Trading Portfolio and ETF Investment Portfolio.
Come join us over at the Hub as we seek to capitalize on stocks and ETFs that are breaking out!
And if you have any questions or feedback, feel free to shoot me an email at mosaicassetco@gmail.com
Disclaimer: these are not recommendations and just my thoughts and opinions…do your own due diligence! I may hold a position in the securities mentioned in this report.