
The Market Mosaic 6.28.26
Beyond the AI Hype: Average Stocks Are Winning.

👋Welcome back to The Market Mosaic, where I gauge the stock market’s next move by looking at macro, technicals, and market internals. I’ll also highlight trade ideas using this analysis.
If you find this report helpful please hit that “like” button, share this post, and become a subscriber if you haven’t already done so!
🚨And be sure to check out Mosaic Traders Hub. It’s a members-only platform to alert trade ideas, track a model portfolio of open positions, and further analyze the message coming from the capital markets.
Now for this week’s issue…
Despite blockbuster earnings from Micron Technology (MU), the AI trade and Magnificent 7 pressured the major indexes this past week.
While Micron blew past analyst estimates and forecast current quarter revenue at $50 billion compared to analyst estimates for $43 billion, it wasn’t enough to lift AI stocks with the Nasdaq-100 Index falling over 4% on the week.
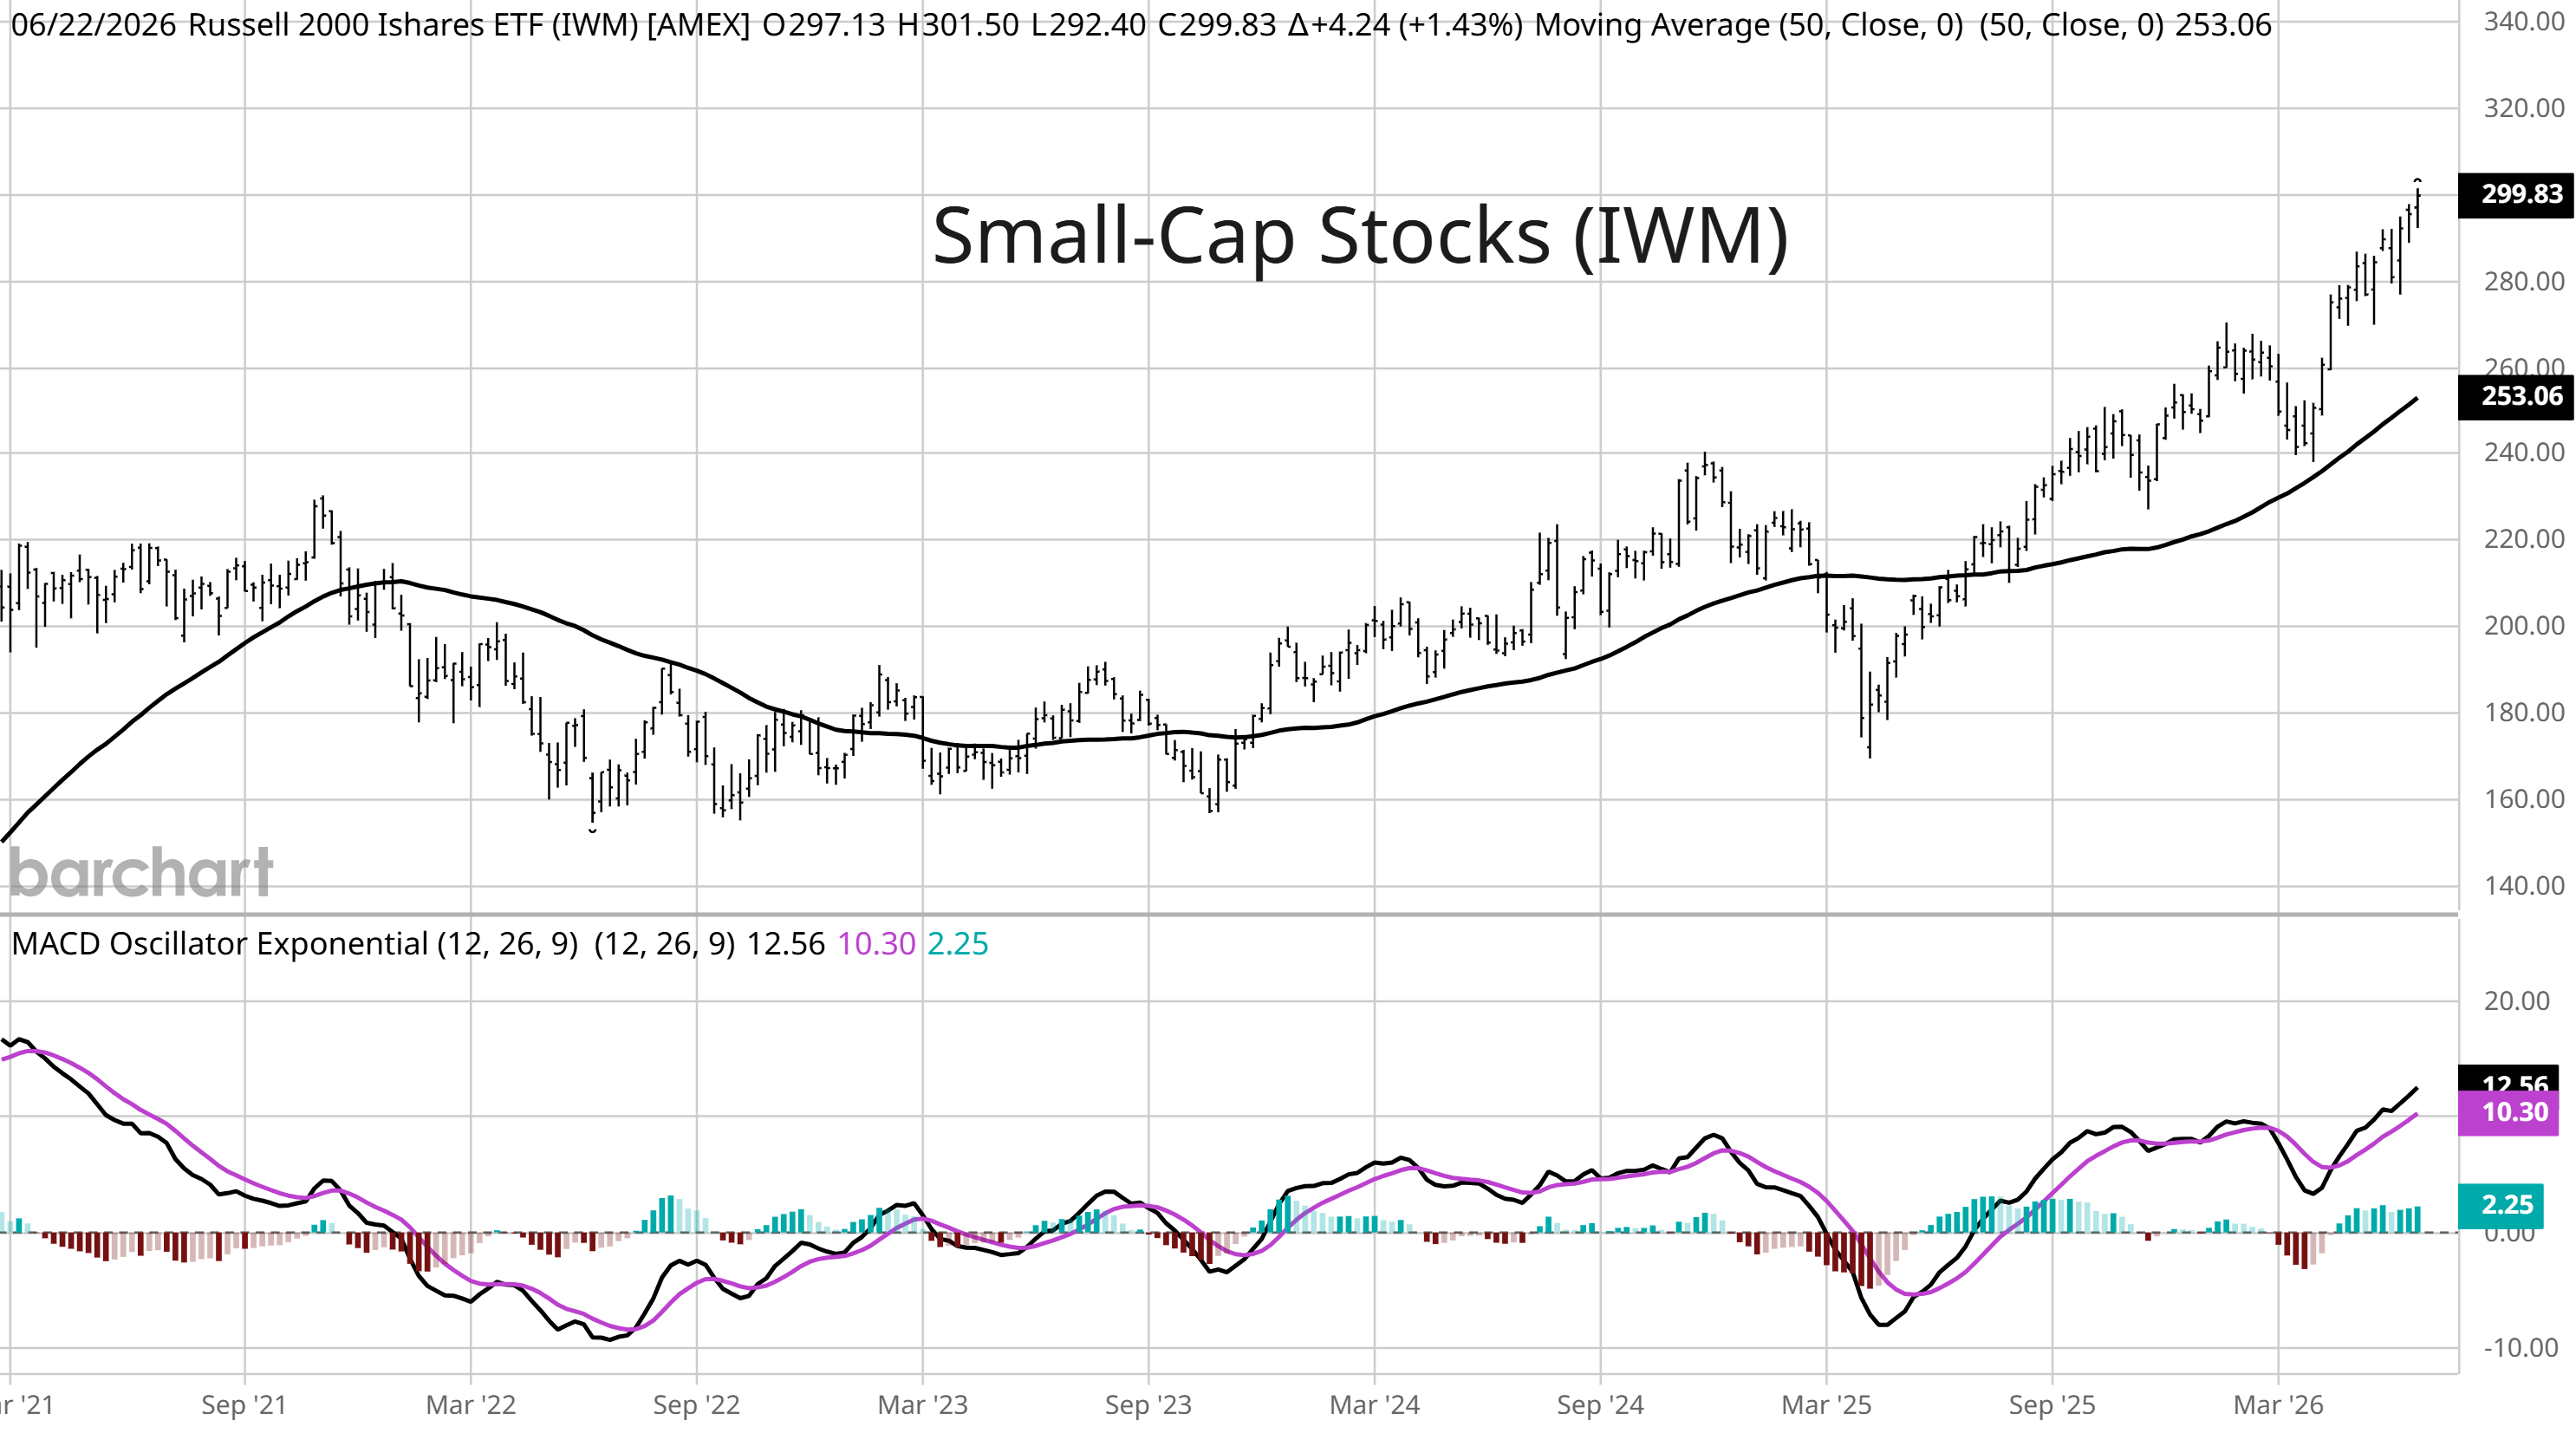
While AI and technology stocks were among the largest losers during the week, there’s evidence that a rotation into the average stock continued to characterize market action. The Dow Jones Industrial Average finished slightly higher on the week while small-caps rallied to a new high (5-year weekly chart below).
Signs of broadening economic strength is helping boost the earnings outlook for the average stock. At the same time, inflation pressures and the implications for the interest rate outlook could have an outsized impact on expensive growth stocks.
The PCE price index, which is the Federal Reserve’s preferred inflation gauge, jumped by 4.1% in May compared to last year. The core figure that strips out food and energy prices rose by 3.4% and hasn’t been below the Fed’s 2% inflation target in over five years.
While energy prices have captured the headlines, rising costs for technology components are starting to bite as well. Due to escalating costs for semiconductors, both Apple and Microsoft announced a round of price increases for everything from the iPad to the Xbox.
This week, let’s look at a bearish short-term pattern forming on the QQQ ETF tracking the Nasdaq-100, and one chart showing the Mag 7 trading below an important top made last year. We’ll also look at an upcoming period of bullish seasonality, and how sentiment could fuel gains for the average stock.
The Chart Report
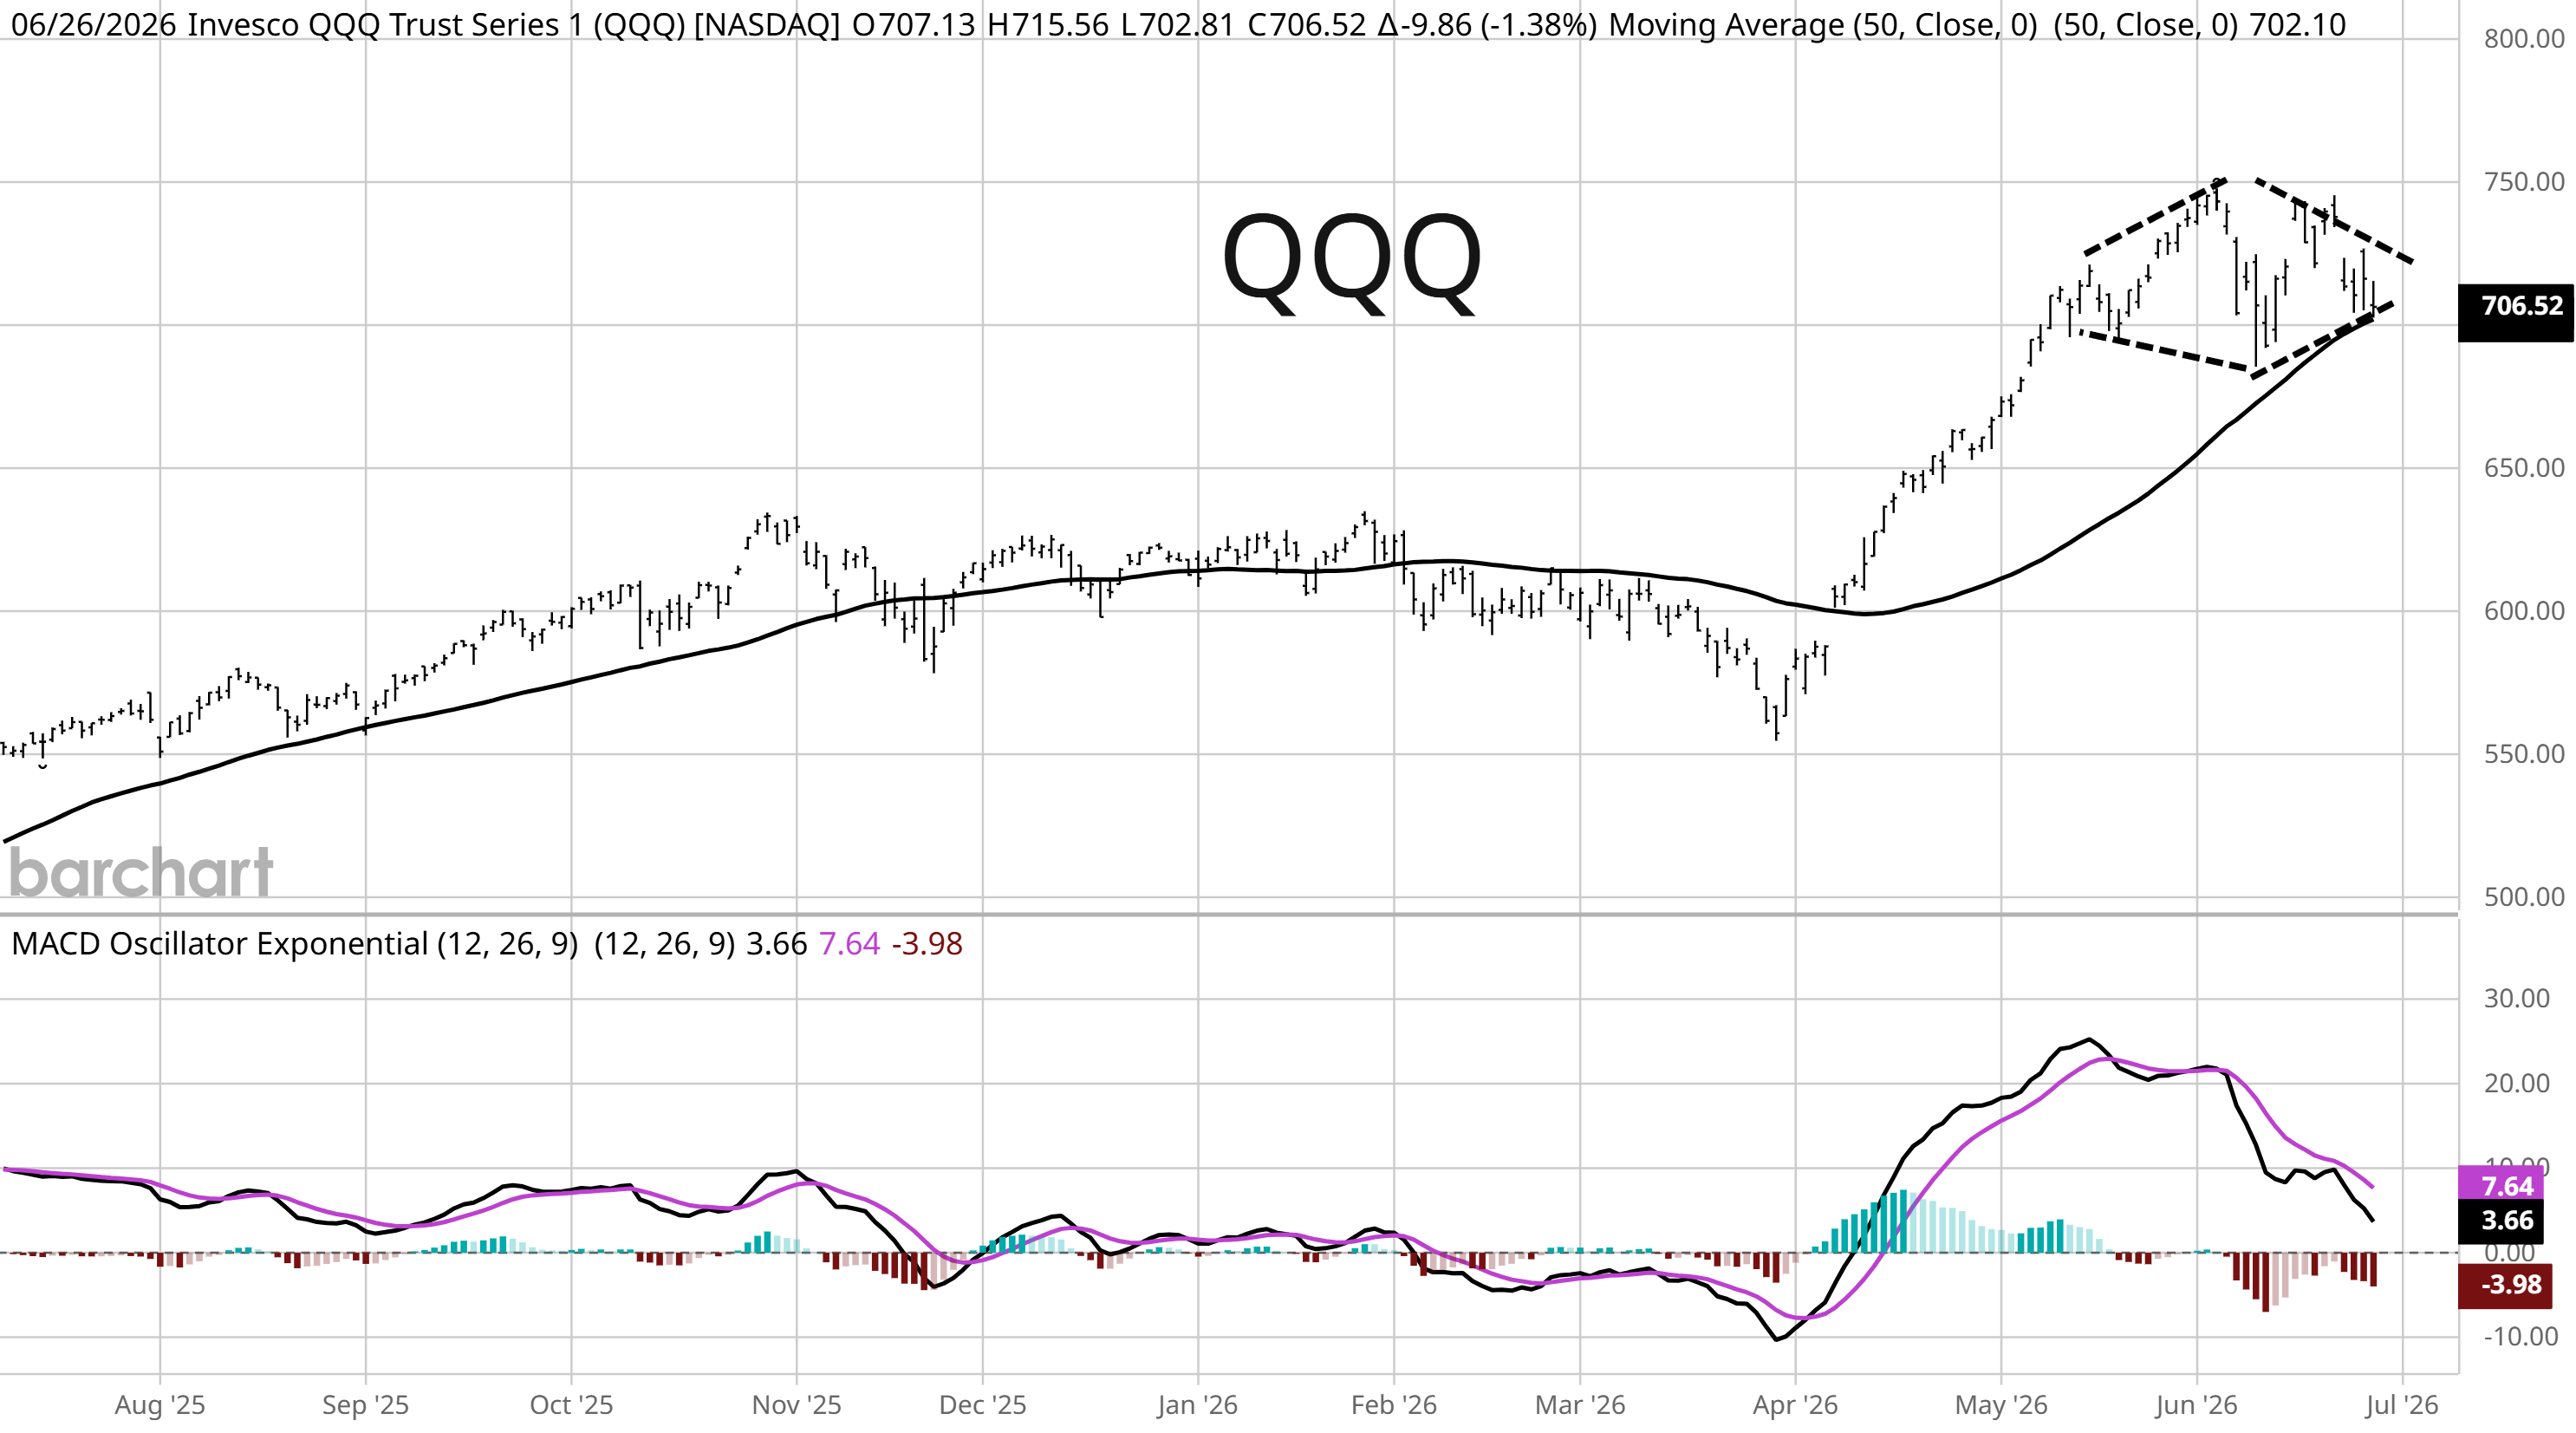
An explosive rally since late March saw the biggest gains narrowly concentrated in stocks leveraged to AI capex spending, especially semiconductor stocks. But since the start of June, there has been a rotation away from technology and into the average stock. While small-caps are rallying out to new record highs, the QQQ ETF tracking the Nasdaq-100 is filling out a bearish pattern in the chart below. QQQ is making a diamond pattern shown with the dashed trendlines, which can often times be a bearish topping pattern. The key level to watch over the near term is at the $700 level, which is trendline support in the pattern along with the 50-day moving average. A break below would suggest the pullback in tech stocks has more to run.
The current cyclical bull market emerged in late 2022 alongside the introduction of generative AI tool ChatGPT. Companies most leveraged to developments in AI include the “Magnificent 7”, which had been the stand out leaders in driving both price and earnings gains. But the momentum behind the Mag 7 is weakening compared to the average stock. The chart below plots a ratio of the Mag 7 price index to the equal-weighted S&P 500, which peaked out in late 2025. While the ratio turned higher off the late March rally, the average stock is once again outperforming which is sending the ratio back toward the lowest levels of the past year.

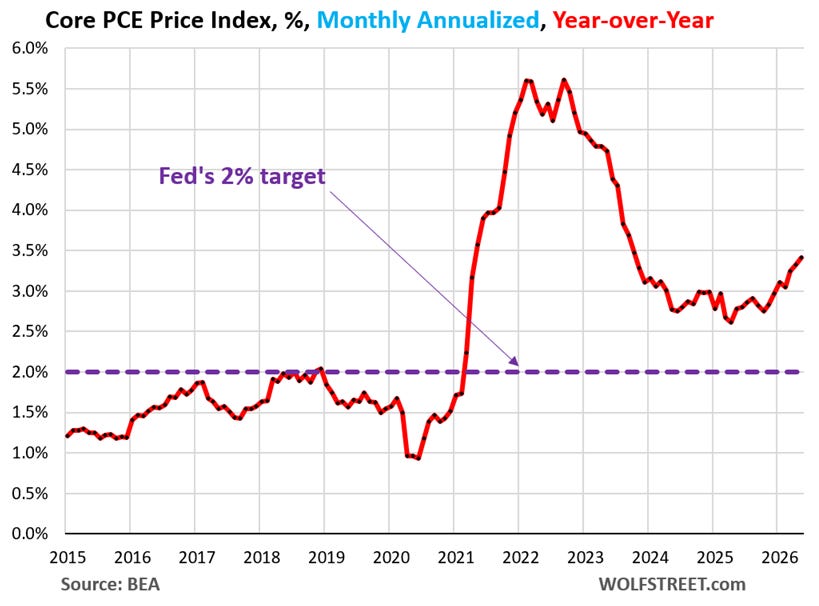
The technology and growth trade could be feeling the weight of recent inflation reports and the outlook for monetary policy. An updated look at the Fed’s preferred inflation gauge jumped to levels not seen in over three years. The PCE price index increased by 4.1% in May compared to last year. The core figure that strips out the impact of food and energy prices rose by 3.4% and hasn’t been at the Fed’s 2% inflation target since early 2021 (chart below). Market implied probabilities currently point to a Fed rate hike at the September meeting, while the 2-year Treasury yield is trading at 4.07% which is well above the fed funds upper target of 3.75%.
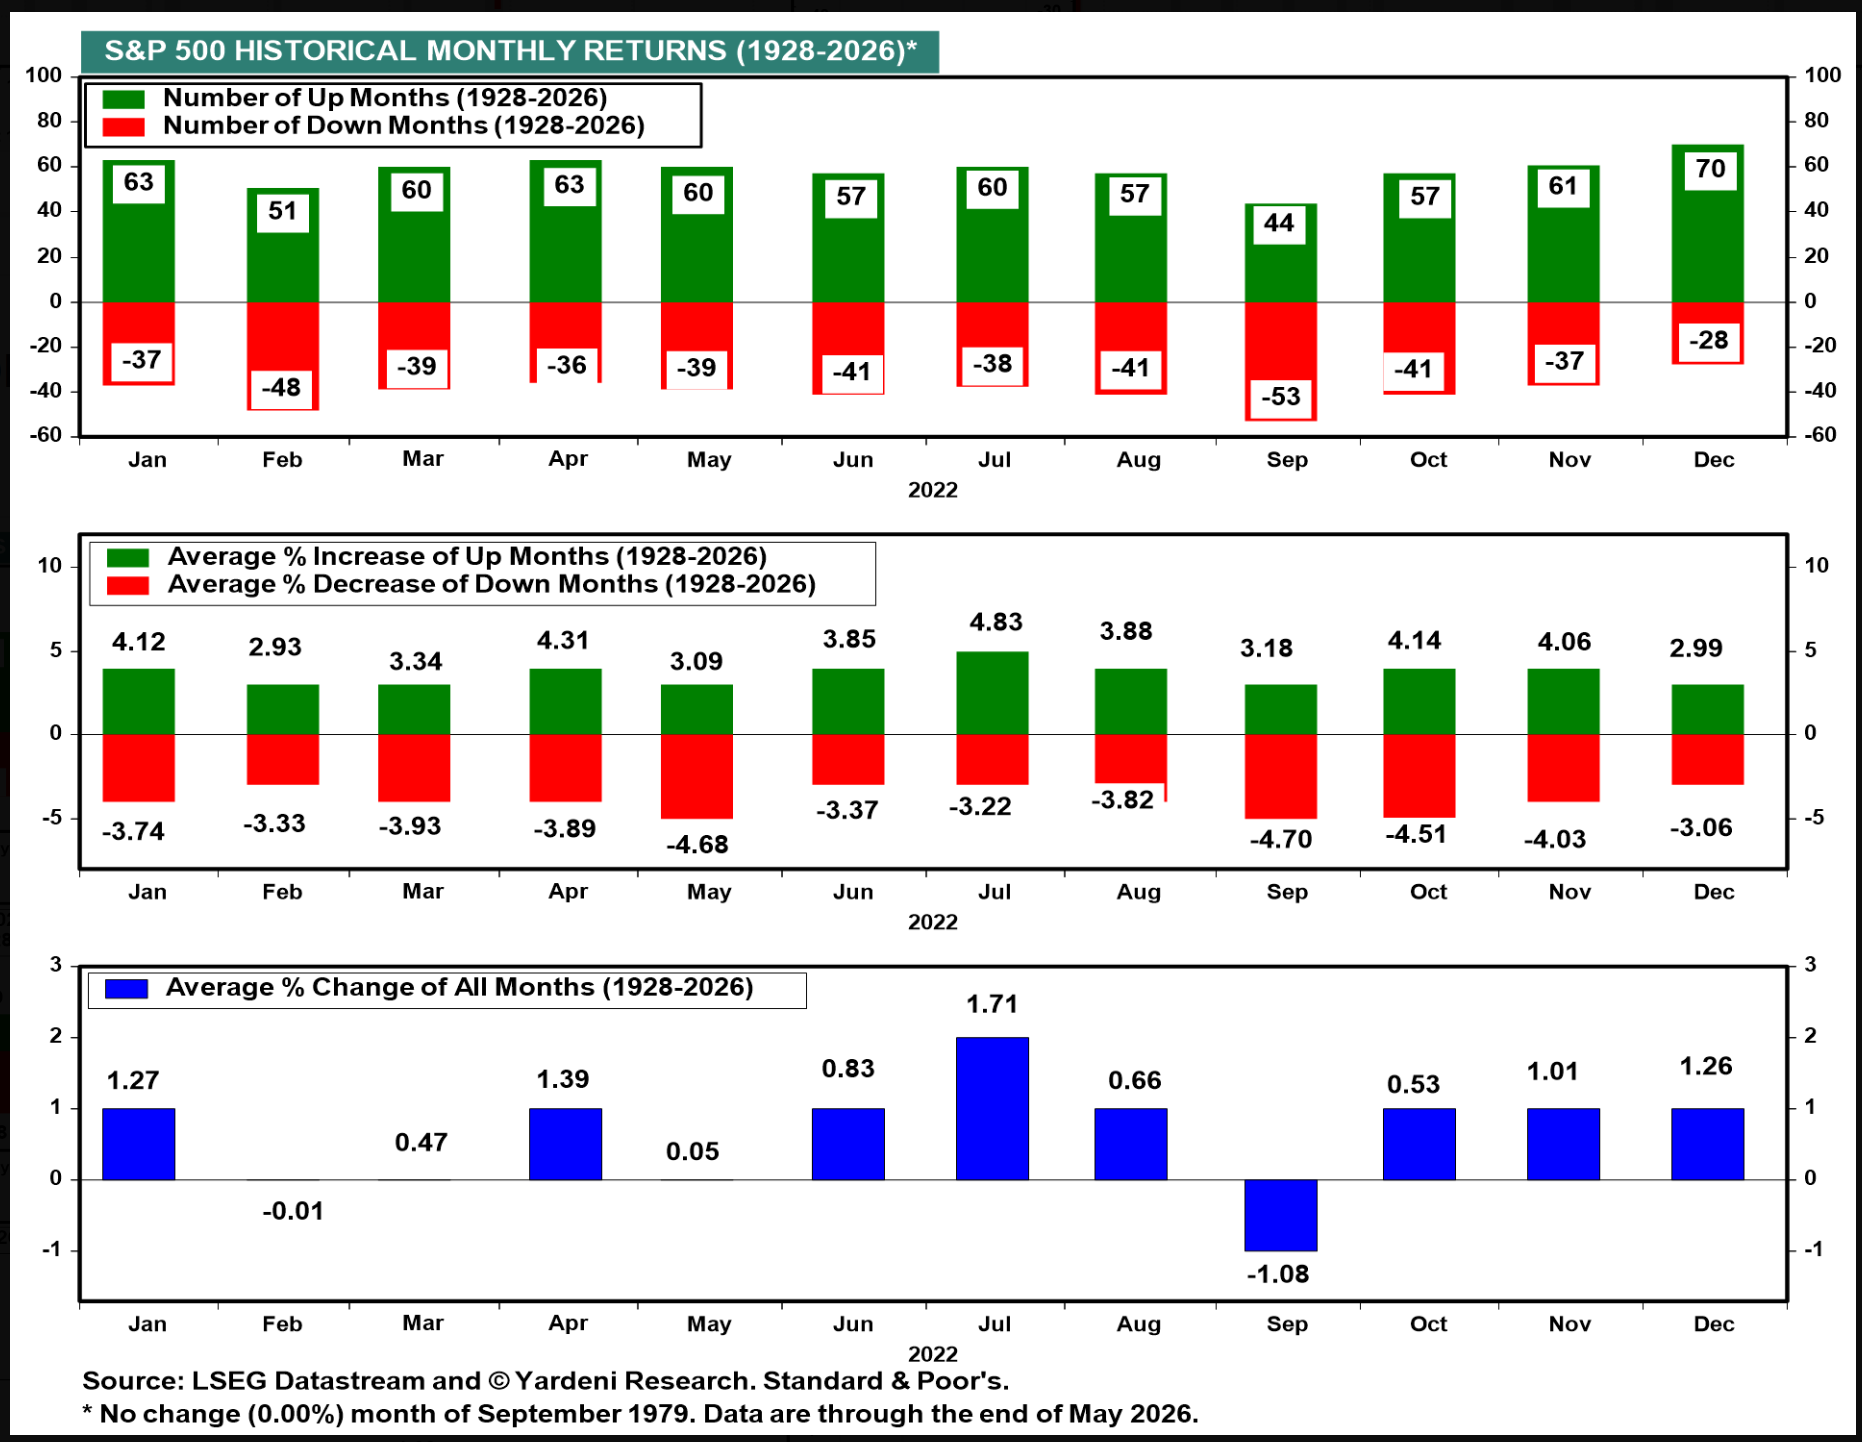
The S&P 500 is about to enter one of the best months of the year for calendar seasonality. While weakness in the back half of June is common, July ranks as the best performing month based on data going back nearly 100 years. The table below plots S&P 500 return data by month going back to 1928. July tends to produce the best overall average monthly gain at 1.71% and is positive about 61% of the time. As the S&P approaches a strong seasonal period, it’s also worth noting that several measures of investor sentiment are showing elevated levels of fear like the AAII report on retail investors showing bearish views running above the historical average while CNN’s Fear & Greed Index tips into “extreme fear” territory.
Heard in the Hub
The Traders Hub features live trade alerts, market update videos, and other educational content for members.
Here’s a quick recap of recent alerts, market updates, and educational posts:
The power of earnings behind stock prices.
Why the calendar is about to turn very bullish.
Investor sentiment and positioning are a tailwind.
One sector showing relative strength and a setup to trade.
Why the stock market can shrug off rate hike fears for now.
You can follow everything we’re trading and tracking by becoming a member of the Traders Hub.
By becoming a member, you will unlock all market updates and trade alerts reserved exclusively for members.
Trade Idea
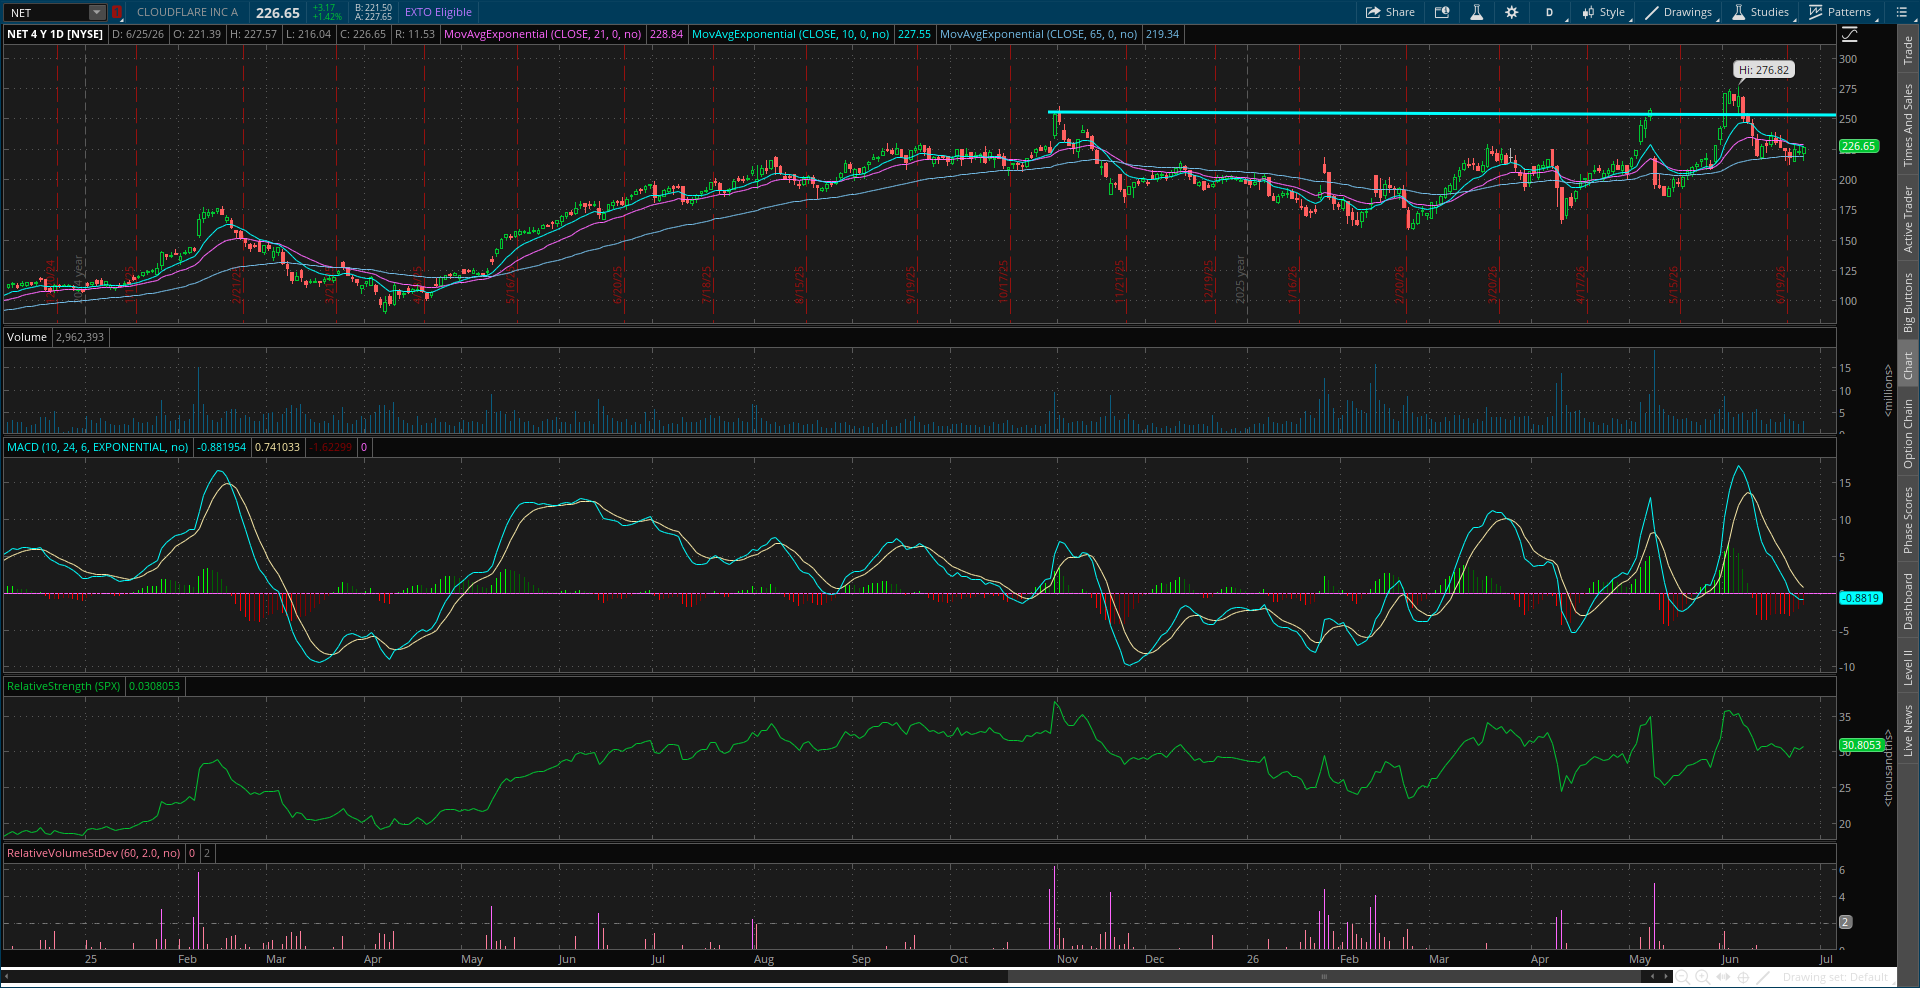
Cloudflare (NET)
Watching a new pattern after a failed break above the $250 level. The weekly chart shows this level is still in play as the stock makes a smaller pullback and resets the MACD above the zero line. I’m watching for an initial move over $250.
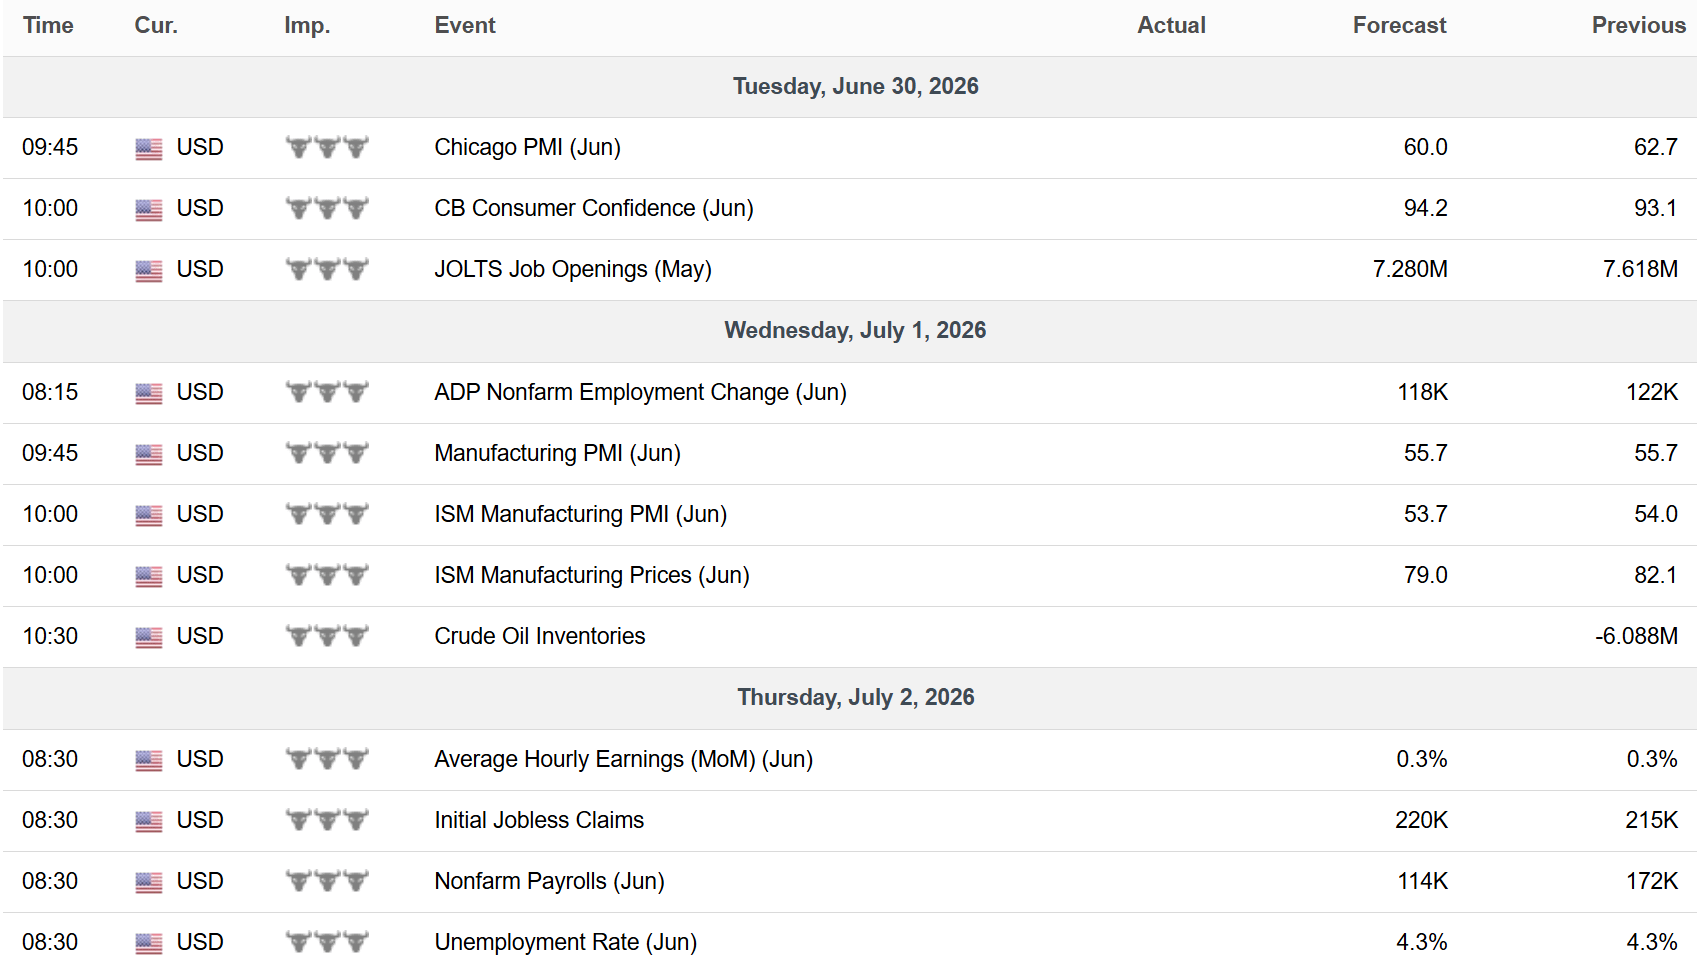
Key Upcoming Data
Economic Reports
Earnings Reports

I hope you’ve enjoyed The Market Mosaic, and please share this report with your family, friends, coworkers…or anyone that would benefit from an objective look at the stock market.
Become a member of the Traders Hub to unlock access to:
✅Model Portfolio
✅Members Only Chat
✅Trade Ideas & Live Alerts
✅Mosaic Vision Market Updates + More
Our model portfolio is built using a “core and explore” approach, including a Stock Trading Portfolio and ETF Investment Portfolio.
Come join us over at the Hub as we seek to capitalize on stocks and ETFs that are breaking out!
And if you have any questions or feedback, feel free to shoot me an email at mosaicassetco@gmail.com
Disclaimer: these are not recommendations and just my thoughts and opinions…do your own due diligence! I may hold a position in the securities mentioned in this report.