The Market Mosaic 6.22.25
Rising risks to the inflation outlook.
👋Welcome back to The Market Mosaic, where I gauge the stock market’s next move by looking at macro, technicals, and market internals. I’ll also highlight trade ideas using this analysis.
If you find this report helpful please hit that “like” button, share this pxost, and become a subscriber if you haven’t already done so!
🚨And be sure to check out Mosaic Traders Hub. It’s a members-only platform to alert trade ideas, track a model portfolio of open positions, and further analyze the message coming from the capital markets.
Now for this week’s issue…
A holiday-shortened week still featured plenty of key reports on the economy, the path of monetary policy, and ongoing tensions in the Middle East.
The conflict between Israel and Iran remains a focal point for investors, especially as President Trump announced U.S. strikes against Iranian nuclear facilities. That should keep oil prices elevated and drive commodity indexes near key breakout levels.
There’s also evidence that rising tariff rates are impacting consumer spending patterns. Retail sales during the month of May fell 0.9% from April, which was the largest monthly drop in over two years.
Part of the drop reflects a give back in automotive sales, where consumers pre-bought ahead of expected tariffs. But excluding autos, sales still fell by 0.3% which was worse than expectations for a gain of 0.1%.
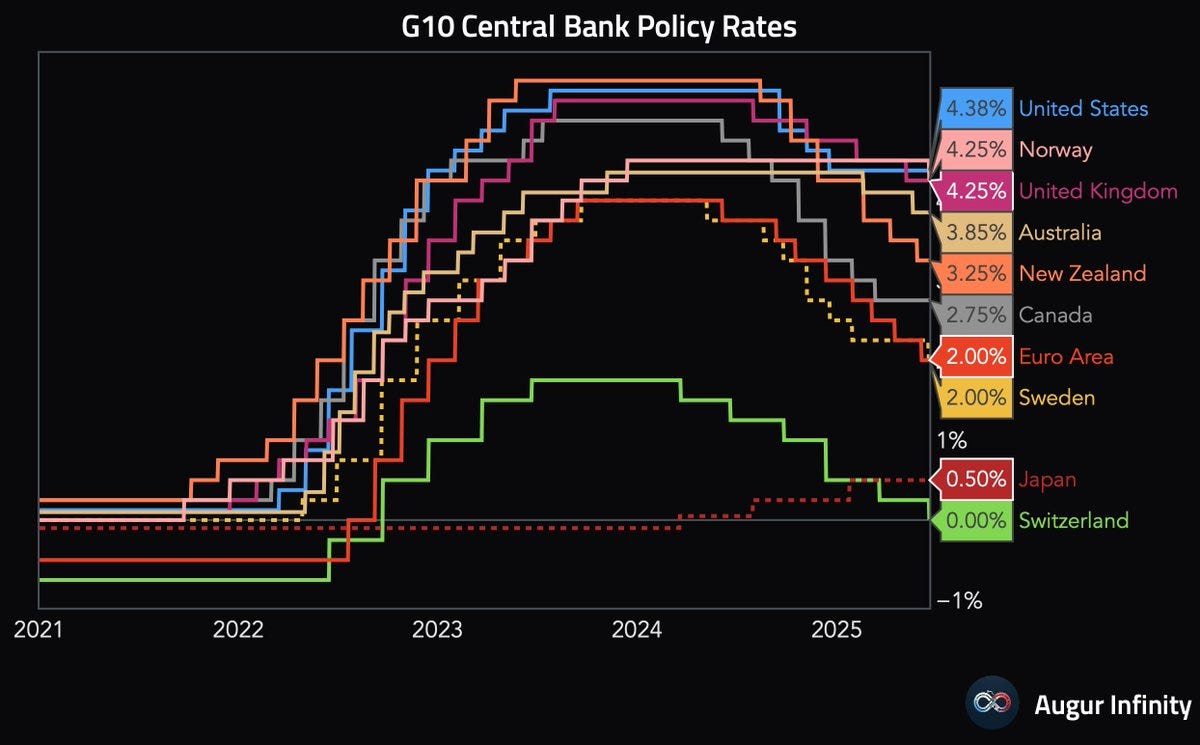
Uncertainty over the impact of tariffs is putting the Federal Reserve in a tough spot. Last week, the central bank elected to keep the short-term fed funds rate unchanged at a range of 4.25% - 4.50%. That means the U.S. policy rate is the highest above other developed economies (chart below), and nearly double the rate of consumer inflation.
But the Fed is anxious over the impact of tariffs on inflation, with Fed Chair Jerome Powell commenting that “we expect a meaningful amount of inflation to arrive in coming months.”
This week, let’s dive further into evidence that inflation could be inflecting higher, and why you need to keep close watch on commodity prices. We’ll also look at the historically bad year for the U.S. dollar, and another positive catalyst for energy sector stocks.
The Chart Report
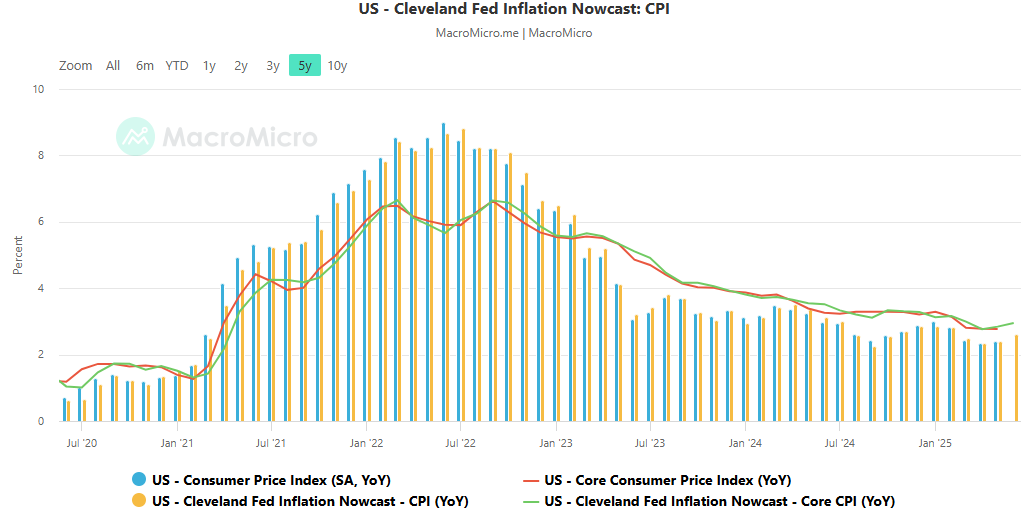
The annual gain in the Consumer Price Index (CPI) peaked in mid-2022 at 9.0%. Since then, a trend of disinflation has taken hold with smaller gains in the yearly rate of change in CPI. But the concern is that rising energy prices and the impact of tariffs could drive inflation to accelerate again. There’s some emerging evidence with the Cleveland Fed’s inflation “nowcast” report that provides a real time estimate of several inflation measures. The estimated annual gain in June CPI currently stands at 2.6% (green line in the chart below), which is up from May’s 2.4% figure. While one month doesn’t make a trend, it’s worth watching closely given several inflationary catalysts.
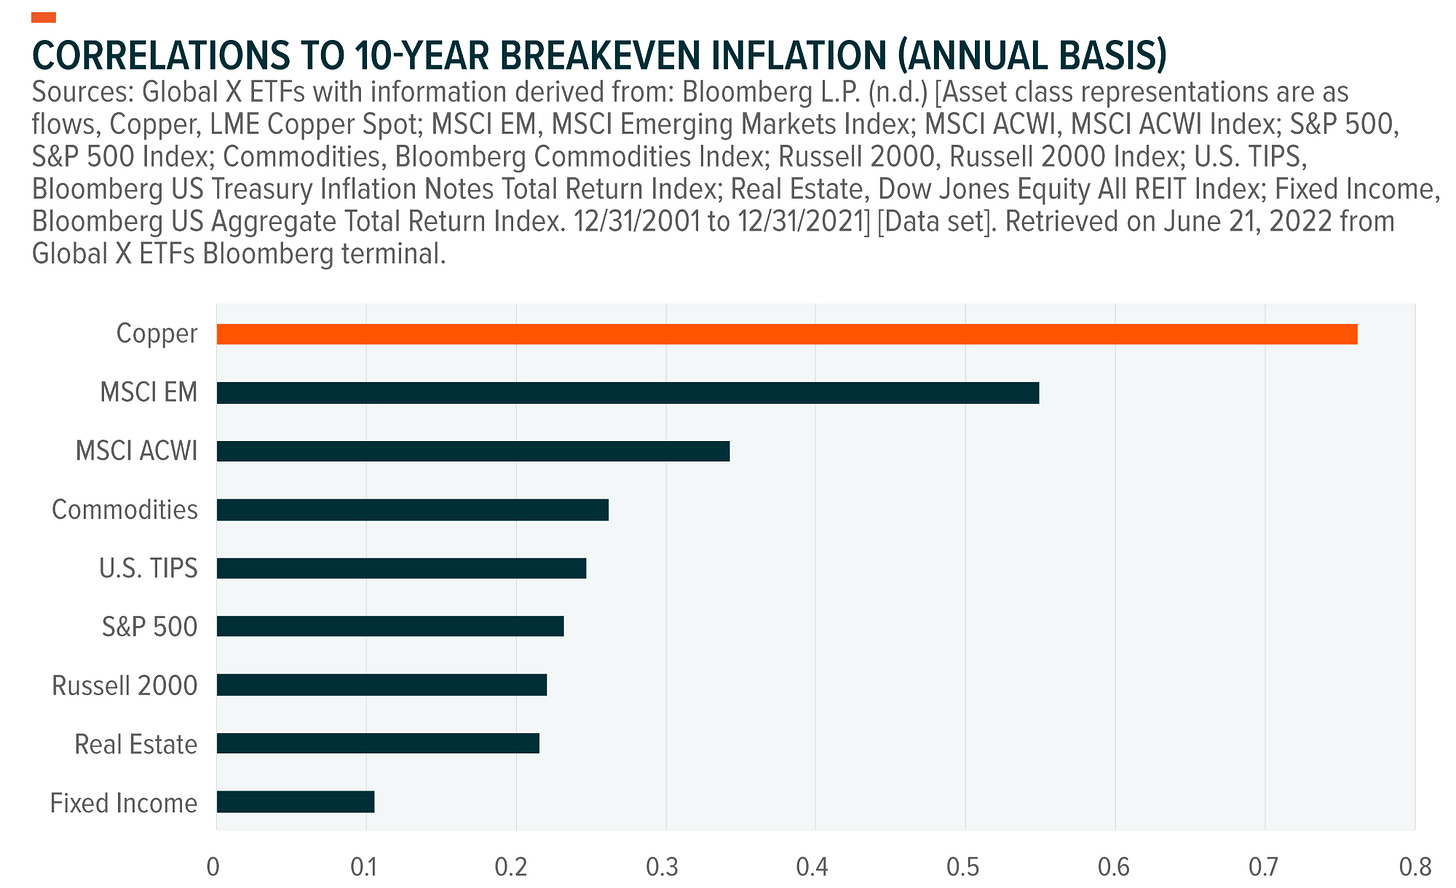
Rising energy prices could be another factor behind an increase in inflation. Since the start of June, oil prices are up $13 per barrel. The Fed estimates that a sustained $10 increase in oil prices adds 0.4% to inflation. Investors should closely follow the action in copper prices as well. That’s because copper has one of the highest correlations to 10-year breakeven inflation levels as you can see below. Copper prices are trading just shy of the $5.00 per pound level, which has been tested on a couple occasions over the past year. A breakout would put copper prices at record high levels.
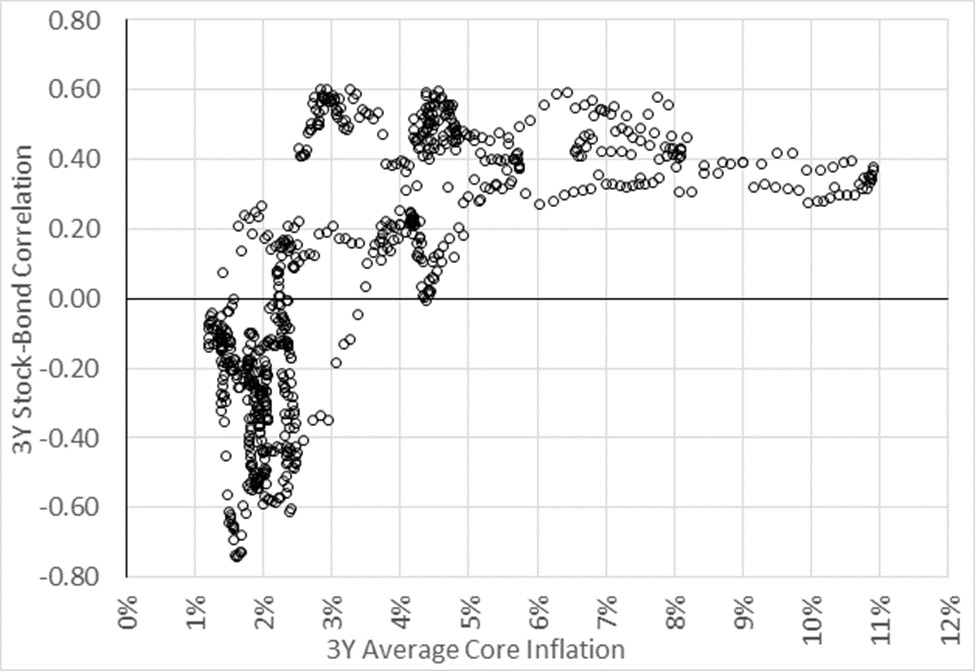
Rising inflation levels could pose a significant problem to traditional asset allocation. Back when inflation surged into 2022, the cornerstone 60/40 retirement portfolio consisting of 60% stocks and 40% bonds had one of its worst returns ever. While the S&P 500 fell 25% from its peak to the low, bond prices fell as longer-term yields jumped higher. Bonds are supposed to offer a diversification benefit when equity market volatility is rising. But the chart below shows that the correlation between stocks and bonds turns positive as inflation levels rise, especially when core inflation jumps above 4%.
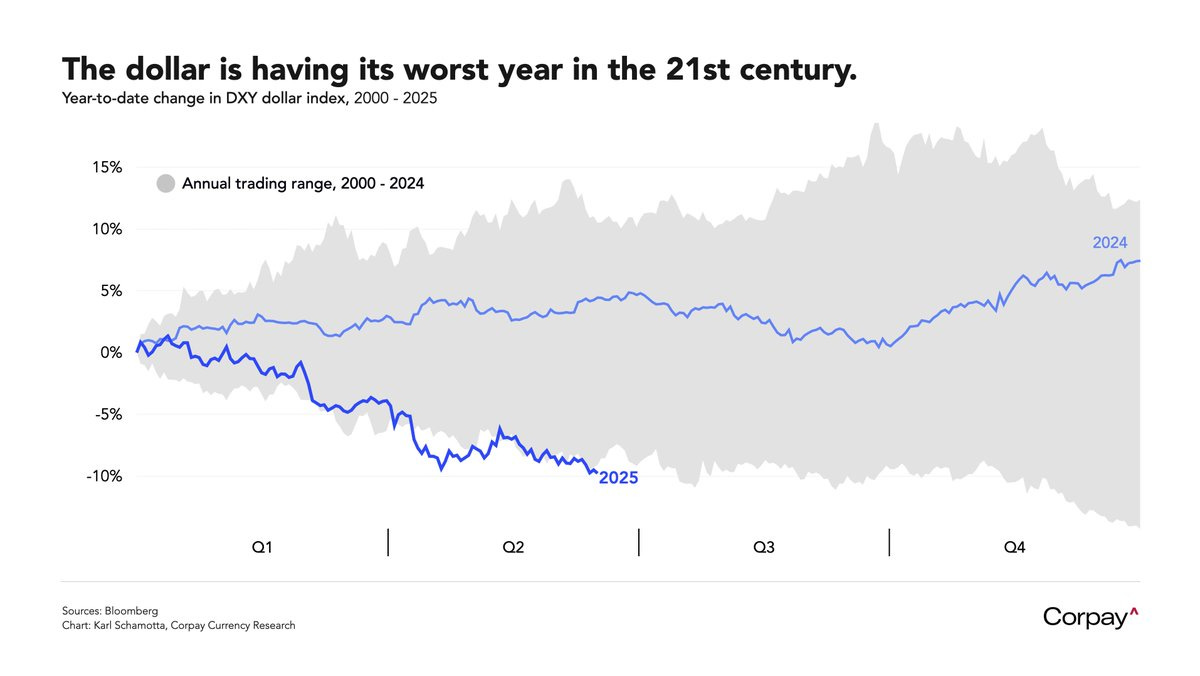
Following a post-election rally, the U.S. Dollar Index (DXY) peaked in mid-January and took a sharp turn lower. Back in early April following uncertainty around tariffs, DXY took out support at the $100 level, which has been tested and held several times since 2023. After breaking down, DXY back tested the 100 area as resistance and is once again trading near the lows. Since 2000, the dollar is having its worst year-to-date performance as you can see below. That’s despite the U.S. having the highest short-term rates among developed economies, and could point to concerns over the economic growth or fiscal outlook.
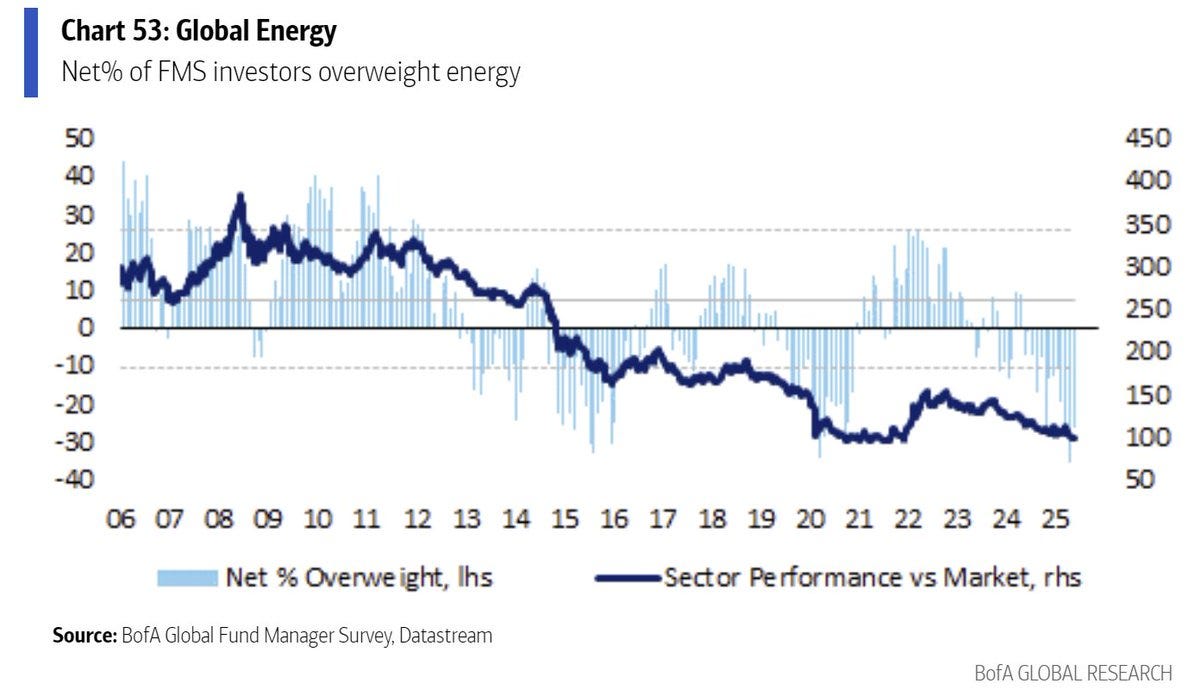
The weakening U.S. dollar is a bullish factor for commodity prices. That’s because commodities are commonly priced and traded in dollars. When the dollar is weakening, that increases the purchasing power of non-U.S. buyers, which can boost demand. Rising commodity and energy prices should benefit the revenues and earnings of producers. Another demand catalyst for energy sector equities could come from institutional money managers. The bars in the chart below shows funds managers’ positioning in the sector from BofA’s Fund Manager Survey. Fund managers currently have one of the largest underweights spanning the past 20 years. Past instances of similar underweights has seen the energy sector outperform on a short-term basis.
Heard in the Hub
The Traders Hub features live trade alerts, market update videos, and other educational content for members.
Here’s a quick recap of recent alerts, market updates, and educational posts:
S&P 500 entering a period of poor seasonality.
The setup in TOST and why the fundamentals are a tailwind.
The inflationary cycle of the 1970s and what it predicts is next.
Adding a new position in the energy sector to leverage commodity tailwinds.
You can follow everything we’re trading and tracking by becoming a member of the Traders Hub.
By becoming a member, you will unlock all market updates and trade alerts reserved exclusively for members.
👉You can click here to join now👈
Trade Idea
Cyberark Software (CYBR)
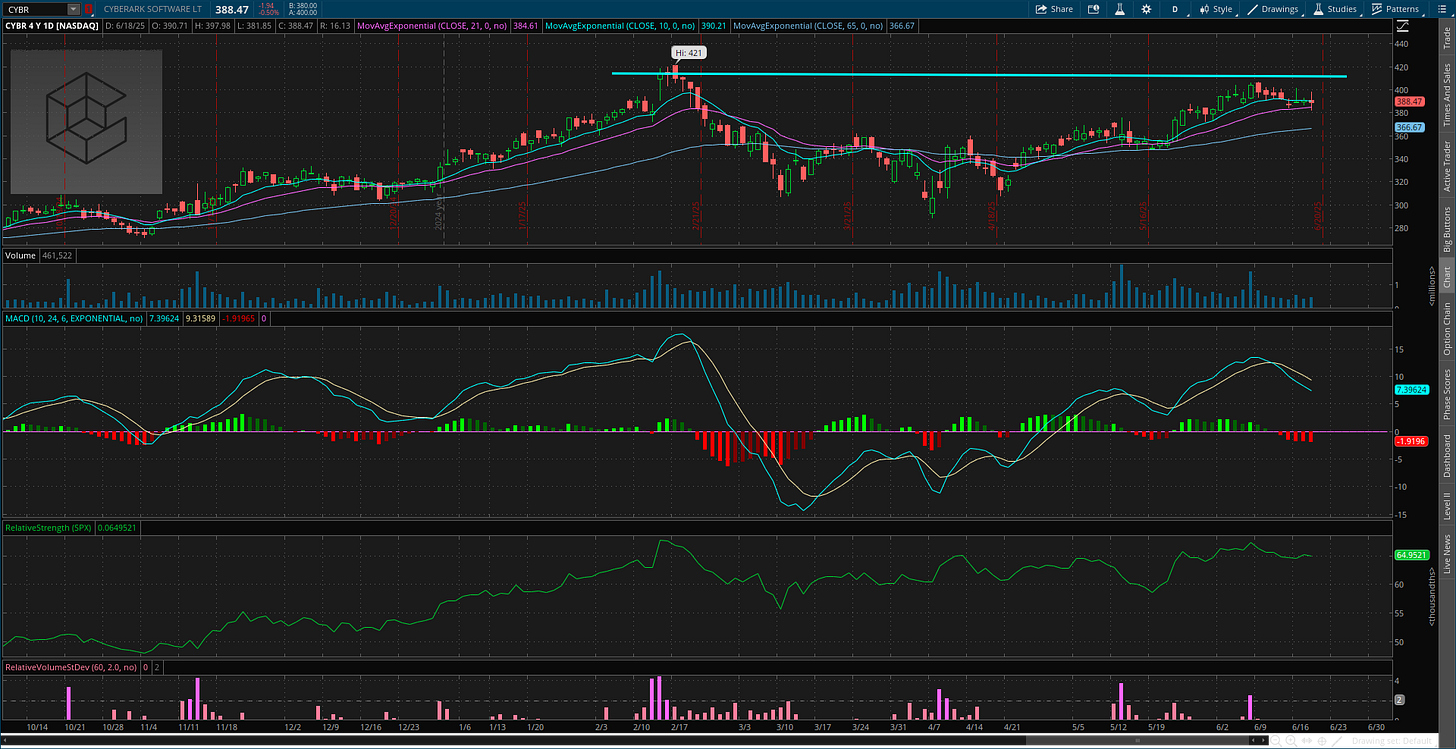
The stock ran up to the $420 level in February and returned to that level again this month. CYBR is seeing a smaller pullback off resistance so far, which is allowing the MACD to reset above the zero line. I’m watching for a breakout over $420.
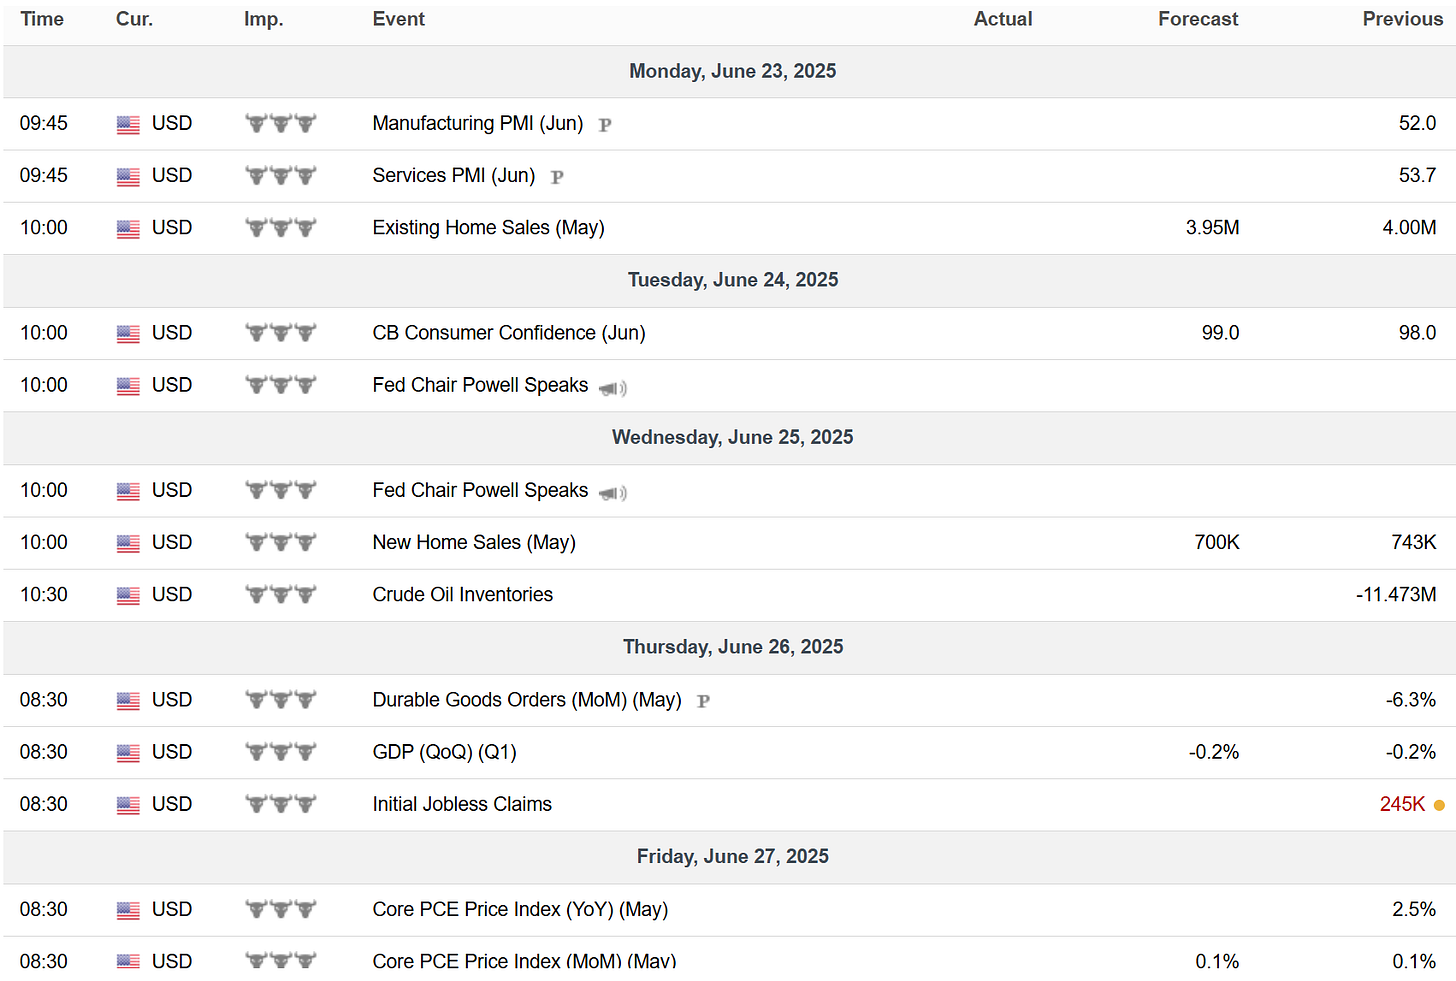
Key Upcoming Data
Economic Reports
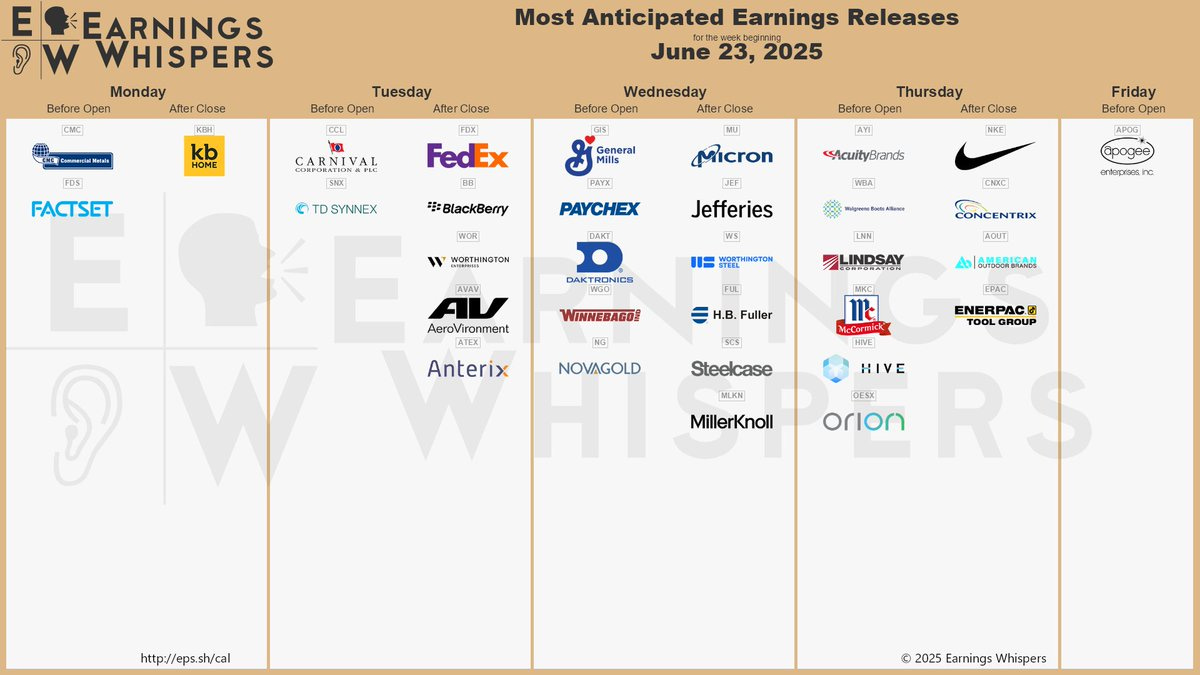
Earnings Releases
I hope you’ve enjoyed The Market Mosaic, and please share this report with your family, friends, coworkers…or anyone that would benefit from an objective look at the stock market.
Become a member of the Traders Hub to unlock access to:
✅Model Portfolio
✅Members Only Chat
✅Trade Ideas & Live Alerts
✅Mosaic Vision Market Updates + More
Our model portfolio is built using a “core and explore” approach, including a Stock Trading Portfolio and ETF Investment Portfolio.
Come join us over at the Hub as we seek to capitalize on stocks and ETFs that are breaking out!
And if you have any questions or feedback, feel free to shoot me an email at mosaicassetco@gmail.com
Disclaimer: these are not recommendations and just my thoughts and opinions…do your own due diligence! I may hold a position in the securities mentioned in this report.


