
The Market Mosaic 6.21.26
Robust Economic Data Powers Broader Market Rally.

👋Welcome back to The Market Mosaic, where I gauge the stock market’s next move by looking at macro, technicals, and market internals. I’ll also highlight trade ideas using this analysis.
If you find this report helpful please hit that “like” button, share this post, and become a subscriber if you haven’t already done so!
🚨And be sure to check out Mosaic Traders Hub. It’s a members-only platform to alert trade ideas, track a model portfolio of open positions, and further analyze the message coming from the capital markets.
Now for this week’s issue…
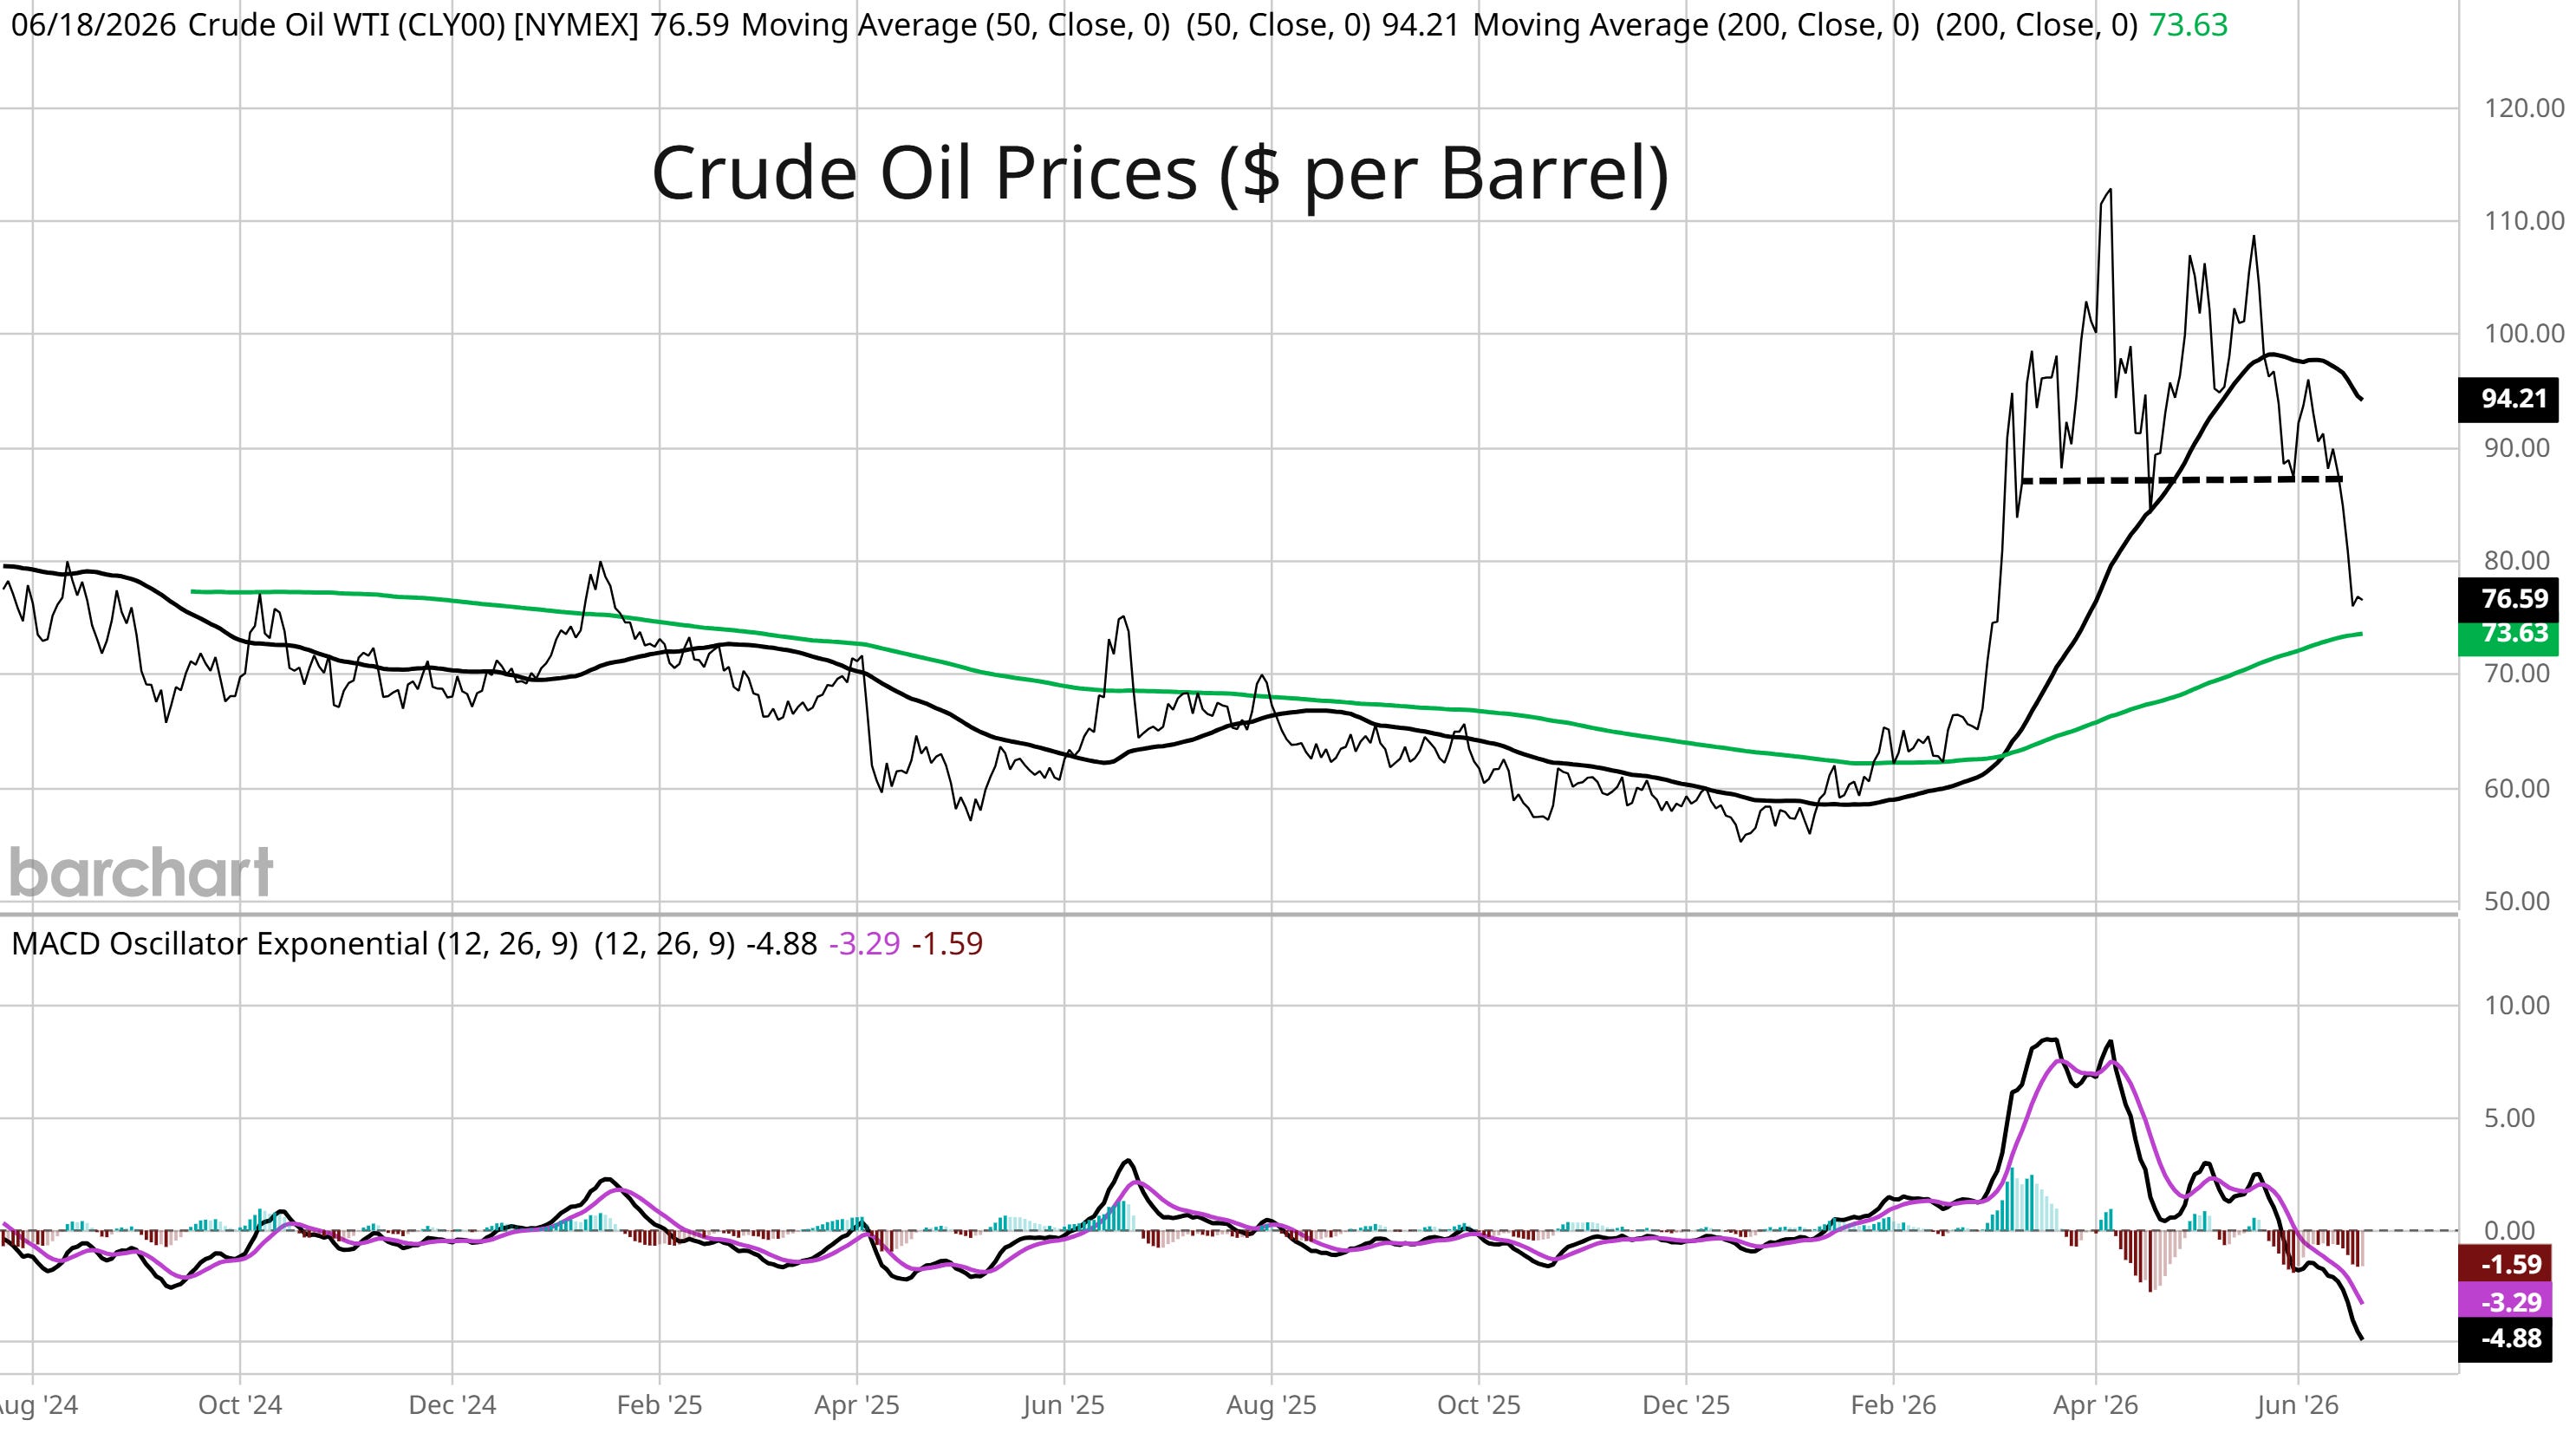
Easing geopolitical tensions between the U.S. and Iran kept downward pressure on oil prices and helped drive major indexes to strong gains last week.
The most durable sign yet of a lasting peace deal between the U.S. and Iran greeted investors to start the week. While President Trump has touted a coming deal for some time, an actual agreement containing details of a ceasefire was signed by both sides.
Part of the deal involves getting oil markets back to normal, including reopening the Strait of Hormuz while the U.S. will end its naval blockade and allow Iranian oil to be sold on the open market for the first time since 2018.
Oil prices have continued dropping in response (chart below) and are nearing levels seen before the war which is fueling hopes for inflation relief. But Kevin Warsh’s first meeting as the new Federal Reserve chair contained hawkish surprises.
Warsh was appointed under intense political pressure to lower interest rates. But among the rate-setting committee, nine of 18 members providing projections anticipated a rate hike this year. Warsh even came across as hawkish in his comments to restore price stability.
While market-based signals continue pointing to rate hikes in the months ahead, the average stock has been gaining ground on strong economic data. Market breadth is broadening from the technology and semiconductor trade driving gains off the late March lows.
More evidence of a solid economy arrived with the May retail sales report, which showed a gain of 0.9% compared to estimates of 0.5% and marks the fourth consecutive month of strong activity.
This week, let’s look at the bond market’s signals on the shifting rate outlook following the latest Fed meeting. We’ll also look at measures of expanding stock market breadth and evidence of strong economic growth, and why that’s a good sign for the rally looking ahead.
The Chart Report
While investors are hoping that the deal between the U.S. and Iran and corresponding pullback in oil prices will temper inflation, price pressures are spreading beyond energy. That’s because multiple catalysts are coming together at the same time to drive a jump in inflation. Catalysts include not just higher energy prices following the conflict in the Middle East, but also includes stimulus from large federal budget deficits that are running near 6% of GDP this year. At the same time, a measure of price pressures from supply chain bottlenecks is increasing that you can see in the chart below. Cost increases from energy prices and upheaval following last year’s trade war are likely playing a key role. You can see that supply chain pressures tends to lead changes in producer prices.

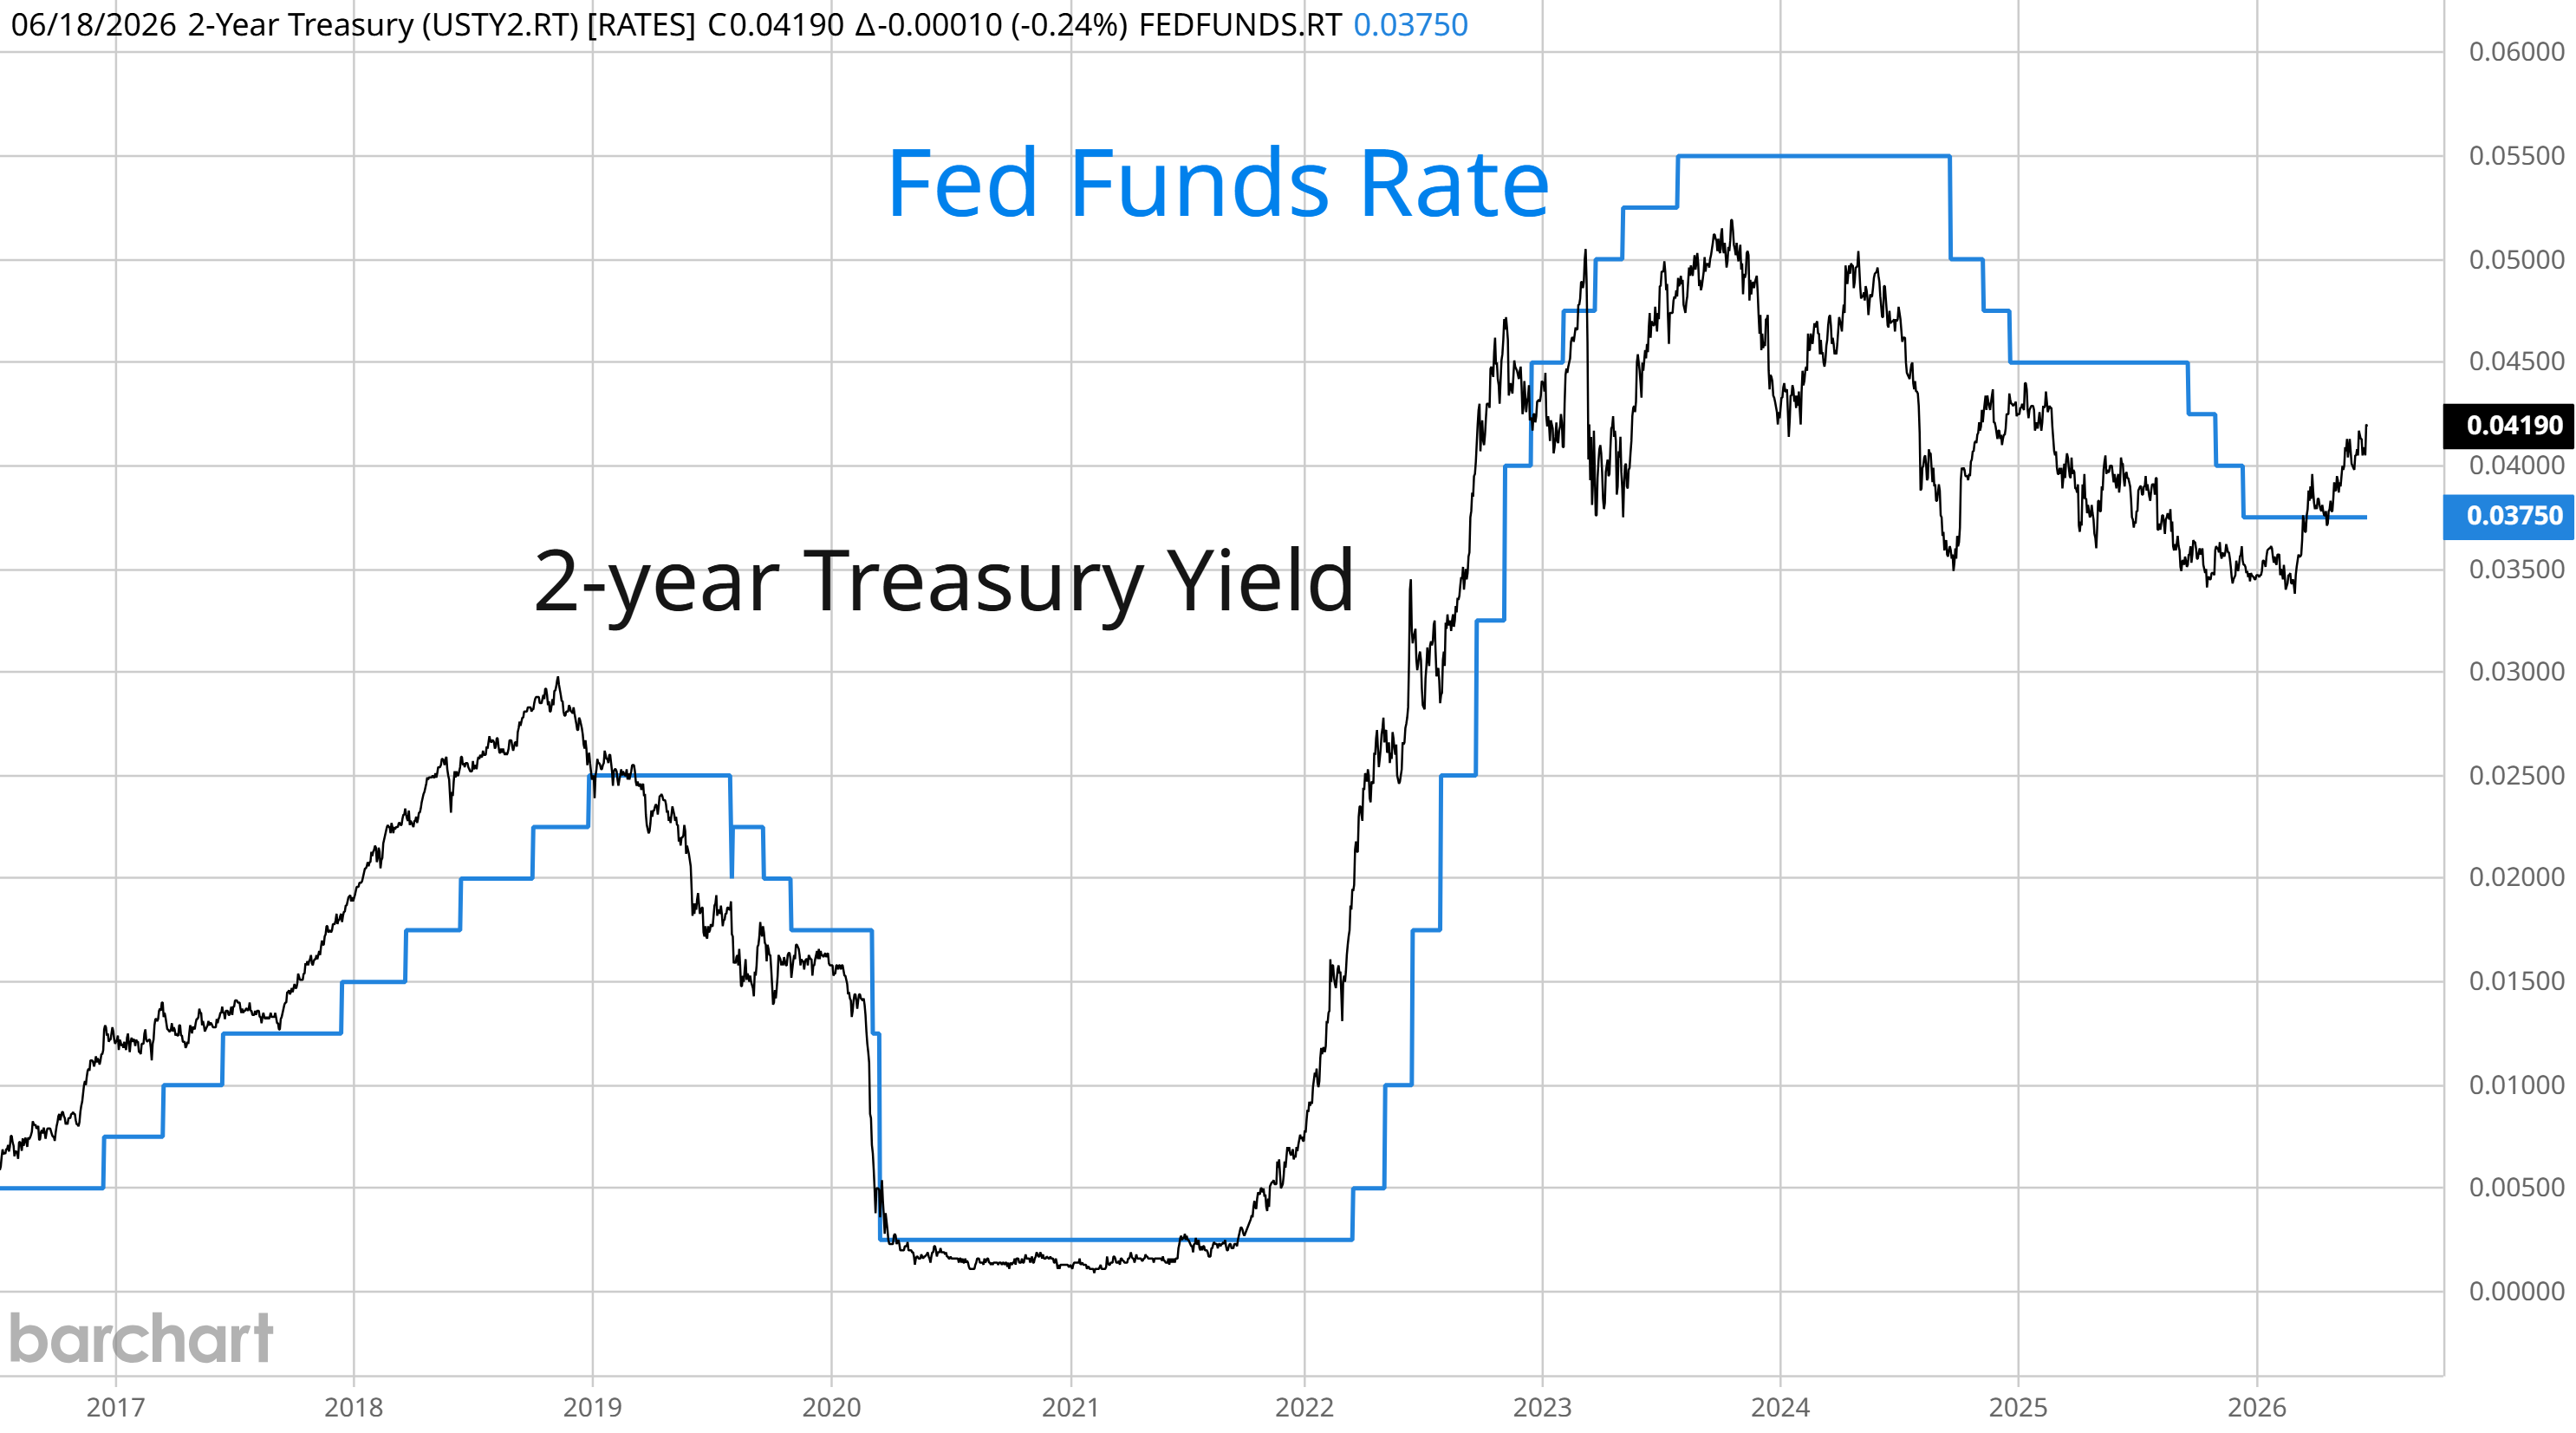
The first Fed rate-setting meeting under new chairman Kevin Warsh contained more hawkish surprises than investors expected. Warsh is under intense pressure from President Trump to lower interest rates, but that prospect was always going to be difficult given the Fed sets interest rates by committee. Across the committee, nine of 18 members providing projections saw at least one rate hike this year which brought forward market-implied probabilities for a rate hike to the September meeting. Even Warsh came across as being hawkish in his commitment in bringing inflation down to the Fed’s 2% target while removing the easing bias from the Fed’s meeting statement. Following the meeting, the 2-year Treasury yield that tends to lead changes in fed funds jumped to the highest level in over a year and is well above the current fed funds rate (chart below).
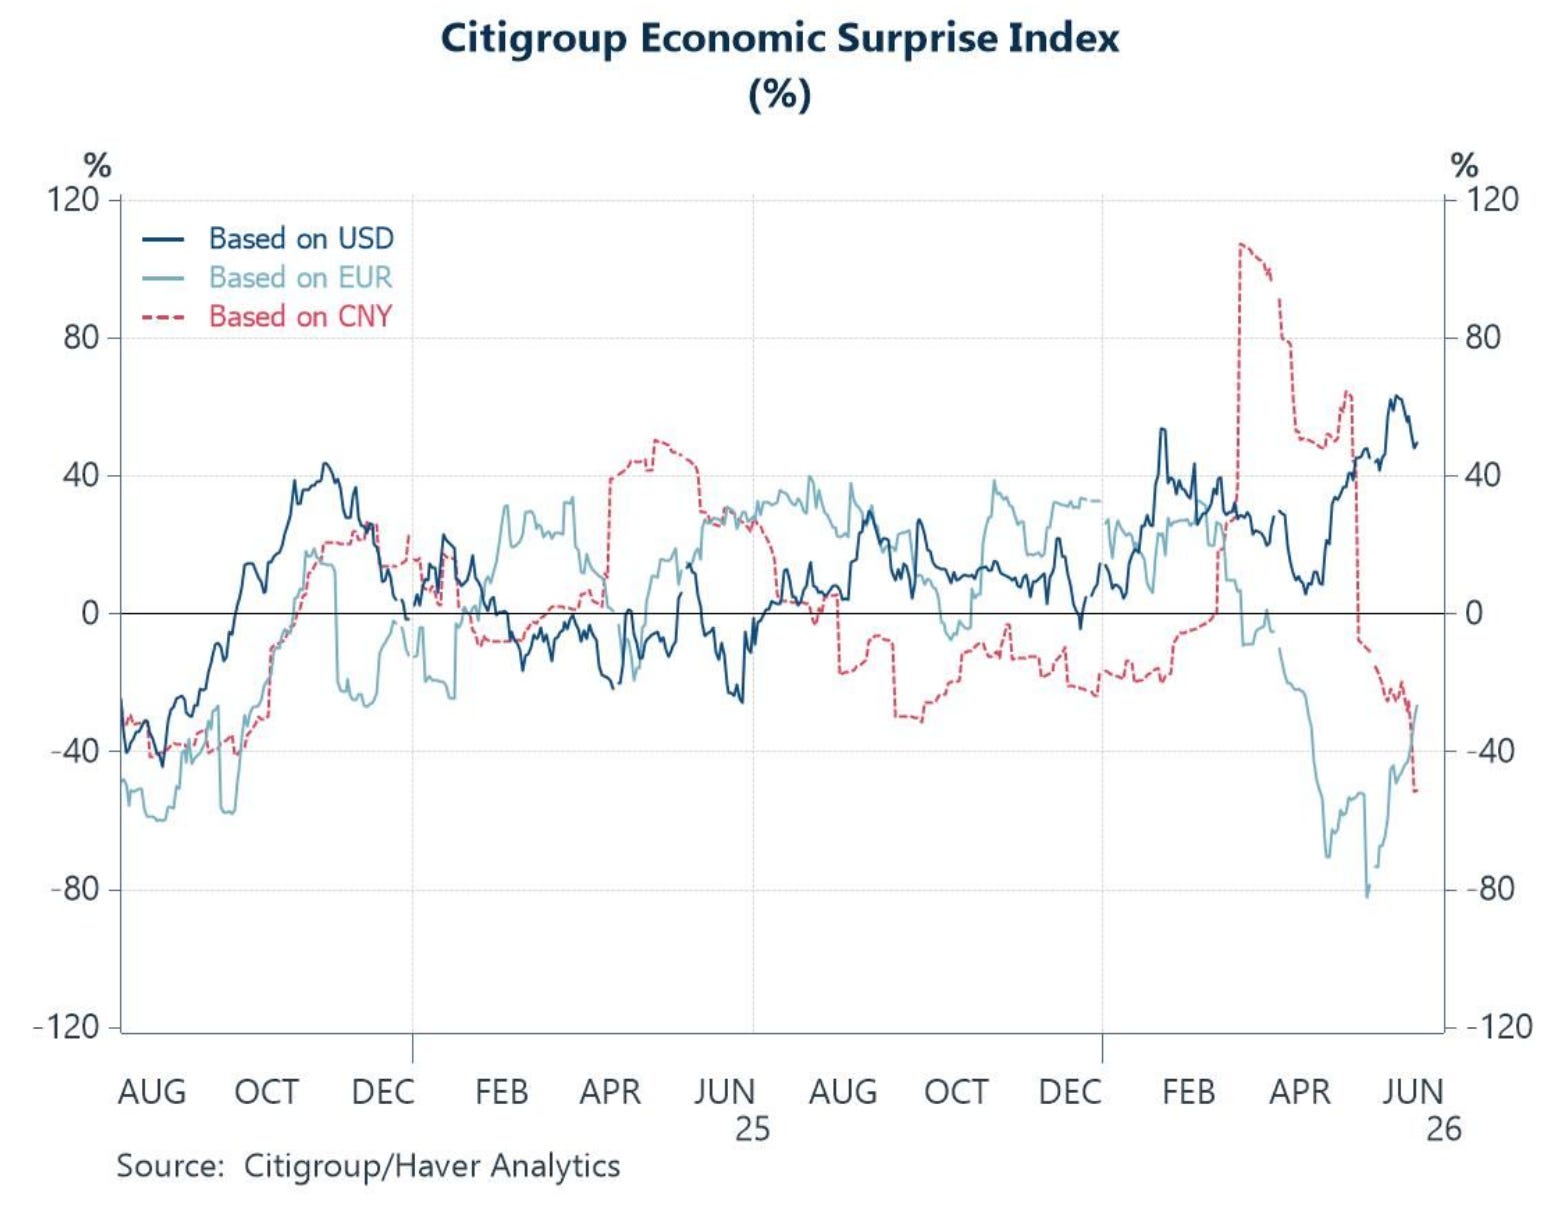
Concerns over persistently high inflation isn’t the only reason for the Fed to consider hiking interest rates. Recent economic data has been surprising to the upside as well. When the Fed cut rates last year, it was to get ahead of anticipated weakness in the labor market. But not only have recent payrolls reports surprised to the upside, other consumer data like retail sales along with measures of business activity are pointing to growth as well. The chart below plots an economic surprise index across different economic regions. You can see that positive U.S. surprises are near the highest level seen in several years.
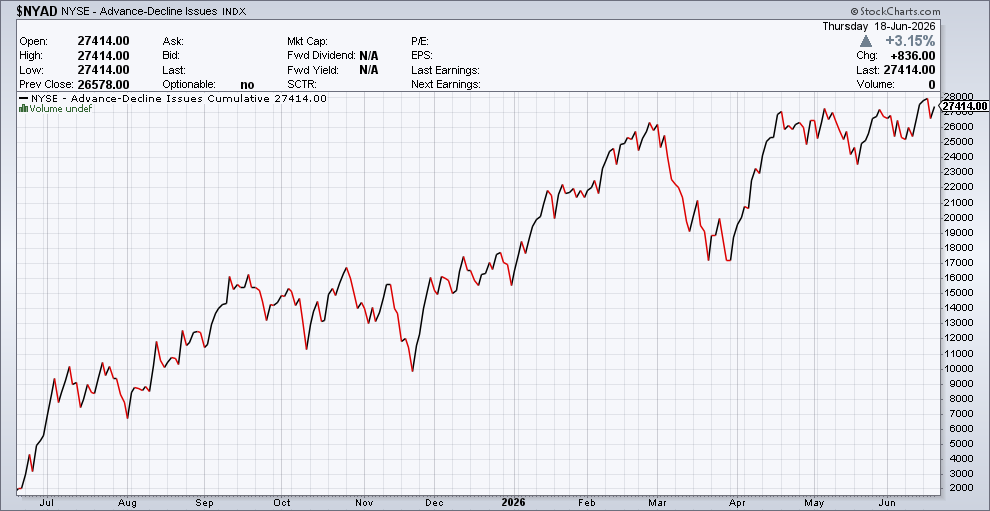
Signs of broadening economic growth is helping the average stock catch up to the capitalization weighted indexes. The rally off the late March lows saw the S&P 500 recover to make fresh record highs. But the gains were being driven by technology stocks, especially in semiconductors that are leveraged to the AI capex trade. Meanwhile, the average stock lagged as evidenced by the NYSE advance/decline line in the chart below. While the S&P started making new record highs in April, the NYSE A/D line struggled to reach new high ground. That trend is being flipped in June, where a pullback in the S&P 500 has seen capital rotate into the average stock with the NYSE A/D line breaking out from a bullish ascending triangle pattern. The combination of a broadening rally and strong economic data is positive for the corporate earnings outlook.
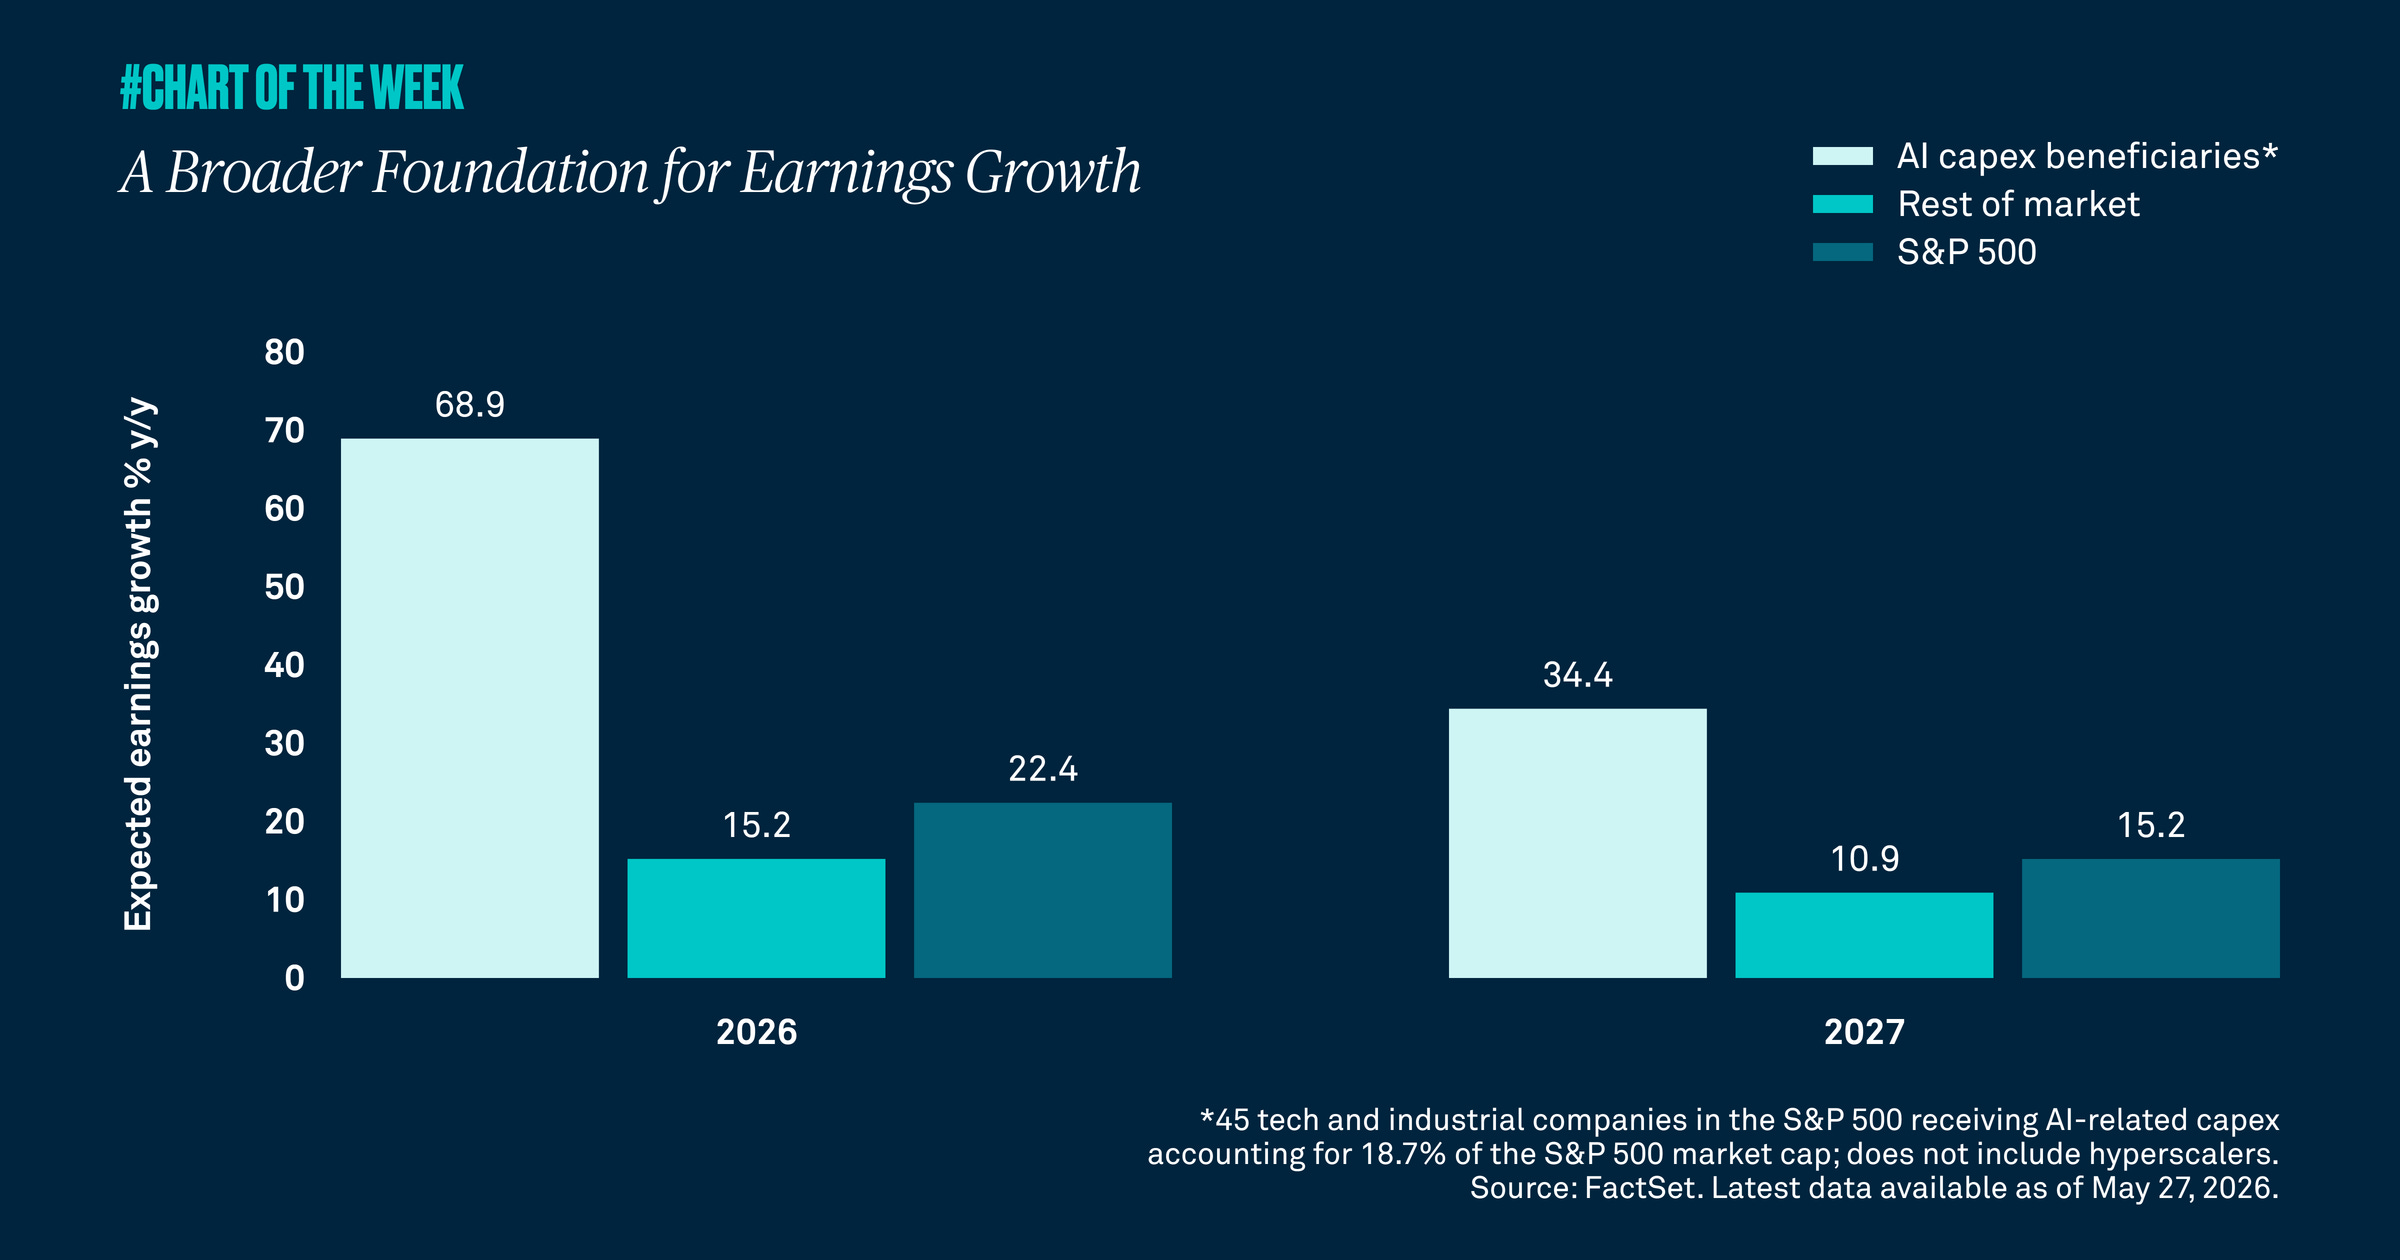
While companies leveraged to AI capex spending are dominating the outlook for earnings growth, the outlook for earnings gains across the rest of the market remains above the long-term trend. You can see in the chart below that AI capex beneficiaries are projected to grow earnings by nearly 69% this year and 34% next year. Although AI-linked companies are experiencing a surge in earnings, the rest of the market is expected to post above average growth as well. The broader segment of the market is expected to grow earnings by 15% this year and 11% next year, which are both above the roughly 10% average annualized growth rate for overall S&P 500 earnings since 2010.
Heard in the Hub
The Traders Hub features live trade alerts, market update videos, and other educational content for members.
Here’s a quick recap of recent alerts, market updates, and educational posts:
Market breadth is staging a bullish breakout.
Evidence that inflation pressures are spreading.
Why the rally can keep pushing higher…for now.
One measure of liquidity that remains supportive of asset prices.
An infrastructure stock setting up a new base-on-base breakout pattern.
You can follow everything we’re trading and tracking by becoming a member of the Traders Hub.
By becoming a member, you will unlock all market updates and trade alerts reserved exclusively for members.
Trade Idea
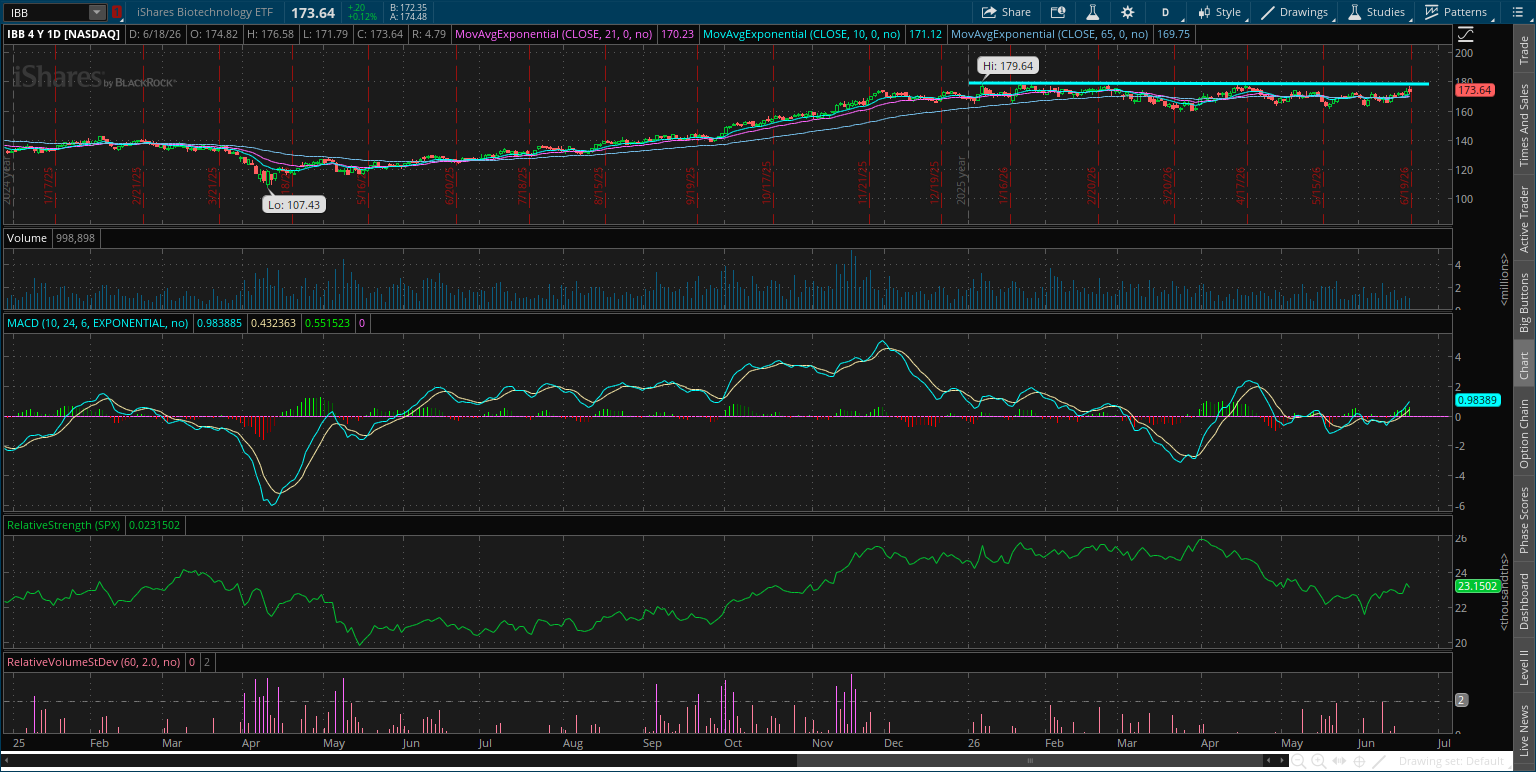
iShares Biotechnology ETF (IBB)
The biotech ETF is trading in a relatively tight basing pattern since January. The MACD is recovering back above the zero line. I would like to see one smaller pullback off resistance before breaking out over $180.
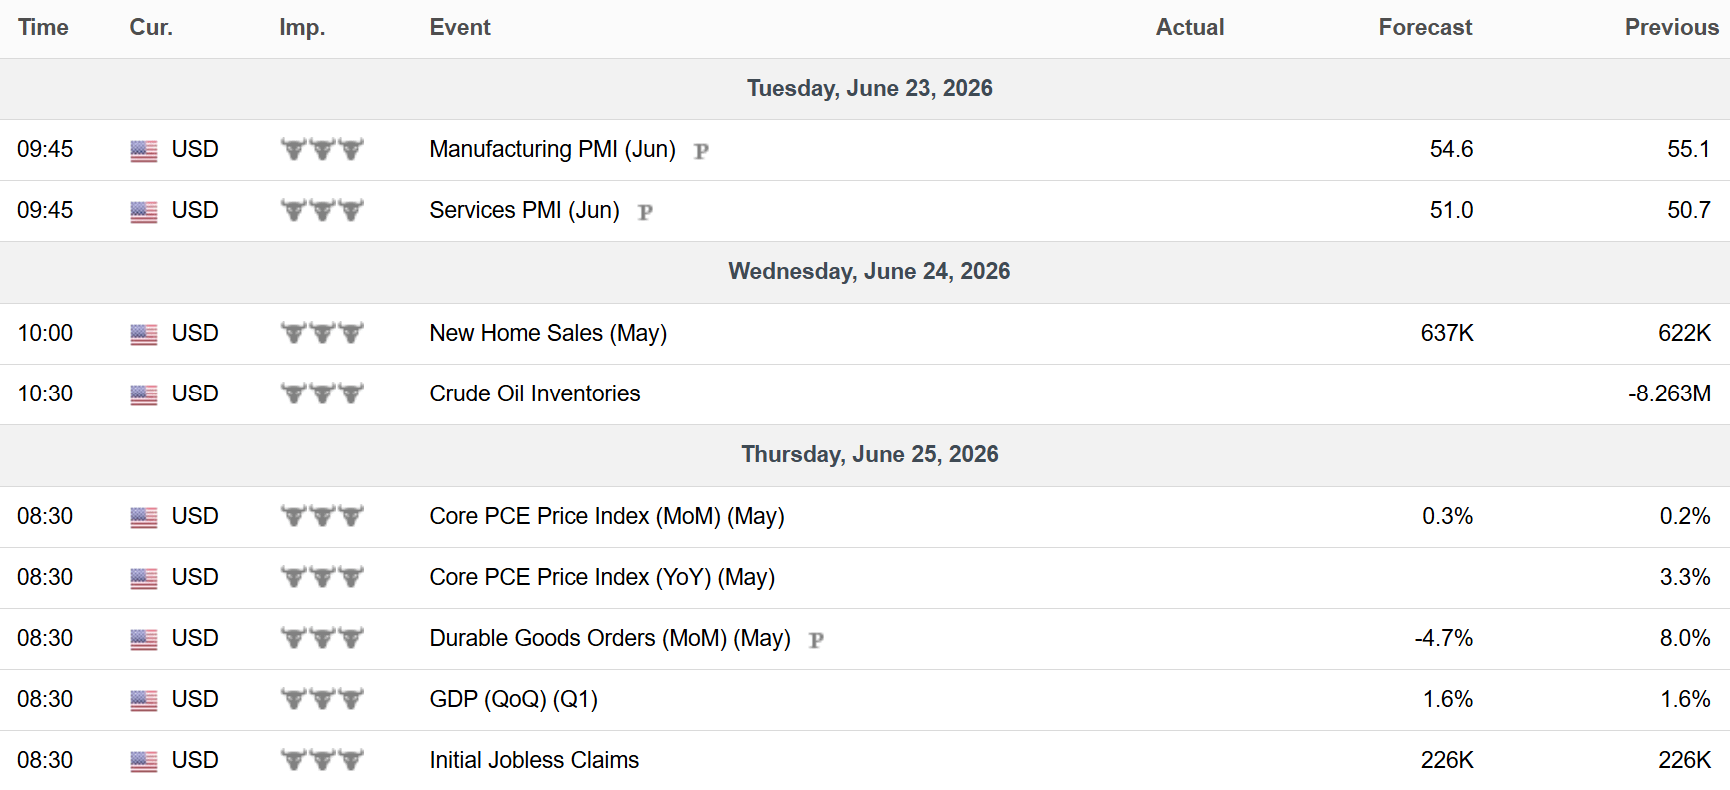
Key Upcoming Data
Economic Reports
Earnings Reports

I hope you’ve enjoyed The Market Mosaic, and please share this report with your family, friends, coworkers…or anyone that would benefit from an objective look at the stock market.
Become a member of the Traders Hub to unlock access to:
✅Model Portfolio
✅Members Only Chat
✅Trade Ideas & Live Alerts
✅Mosaic Vision Market Updates + More
Our model portfolio is built using a “core and explore” approach, including a Stock Trading Portfolio and ETF Investment Portfolio.
Come join us over at the Hub as we seek to capitalize on stocks and ETFs that are breaking out!
And if you have any questions or feedback, feel free to shoot me an email at mosaicassetco@gmail.com
Disclaimer: these are not recommendations and just my thoughts and opinions…do your own due diligence! I may hold a position in the securities mentioned in this report.