The Market Mosaic 6.18.23
The Fed is on the sidelines...earnings comes next!
Welcome back to The Market Mosaic, where I gauge the stock market’s next move by looking at macro, technicals, and market internals. I’ll also highlight trade ideas using this analysis.
If you find this content helpful please hit that “like” button, share this post, and become a subscriber to this always free report if you haven’t already done so!
And be sure to check out Mosaic Chart Alerts. It’s a midweek update covering chart setups among long and short ideas in the stock market, along with levels I’m watching.
Now for this week’s issue…
Following the Federal Reserve’s decision to leave rates unchanged for the first time in 15 months, the S&P 500 is coming full circle…
The index has climbed right back to where it started when the central bank first started raising rates as you can see below. And with the S&P 500 now up 23% from the October lows, it appears that 2022’s bear market is now firmly in the rearview.
This week’s updated readings on inflation also supports the view that the Fed can finally move toward the sidelines on rate hikes. The chart below shows the Consumer Price Index (CPI - blue line) gained 4.0% in May compared to last year, while the Producer Price Index (PPI - red line) increased just 1.1% and is the smallest since 2020.
If there’s one negative aspect from recent inflation reports, it’s that core CPI inflation remains stubbornly high, and perhaps that’s why the Fed implied another two rate hikes before year end.
But at the very least, inflation is trending in the right direction and that means monetary policy is becoming less of a headwind (though definitely not a tailwind yet!) to stock prices.
As a result, I believe the future path of the stock market will now come down to one question: what toll are rate hikes having on economic activity.
Because the answer ties directly to the corporate earnings picture. With trailing measures of economic activity mostly holding up okay, there are some positive developments unfolding with the earnings outlook.
Earnings Becoming a Tailwind
Assessing the drivers of stock prices is quite simple. It all comes down to earnings and what investors are willing to pay for those earnings via valuation multiples like the price-to-earnings ratio.
While the latter can be a bit noisy, it’s the former that’s the key driver of stock prices over the long-term. Just look at the long-term chart below (h/t to Macrotrends) of the S&P 500 (blue line) overlaid with trailing 12 months earnings per share (orange line).
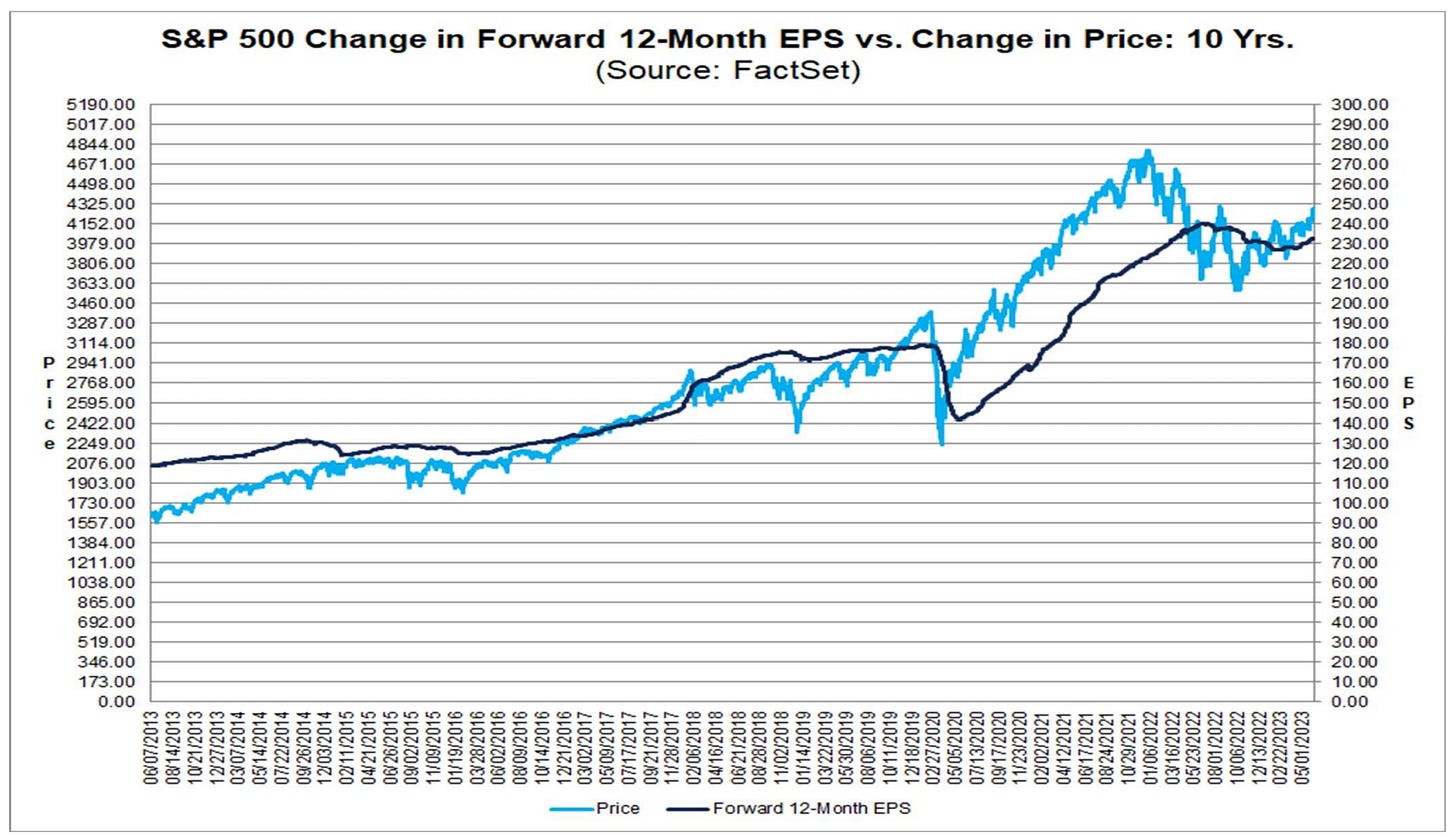
Zooming into 2022’s bear market, the S&P 500 had a peak to trough earnings drawdown of 13%. But earnings appear to be stabilizing and there are several positive developments on the outlook as well.
Forward earnings estimates for the next 12 months have been turning higher for the S&P over the last couple months. You can see that in the chart below, with forward estimates inflecting higher since February.
But we’re also seeing positive analyst revisions at the company level as well. No one has a better take on their business outlook than corporate insiders, and sell-side analysts adjust earnings estimates largely based on the guidance delivered by management during quarterly earnings releases.
You can see below that earnings upgrades versus downgrades have flipped back to positive territory for the first time in at least a year, and this is happening on a global scale. If rate hikes were denting the outlook for business activity, I would expect corporate management teams to reflect that in their recent guidance and outlooks.
So for now, it looks like the earnings drawdown that started in 2022 has run its course, with earnings estimates now turning higher and becoming a tailwind for stock prices.
And with the calendar second quarter close to wrapping up, we’ll get another round of earnings releases soon and hopefully more positive analyst revisions.
Now What…
The stock market has been on the best run we’ve seen in quite some time. The Nasdaq just notched its eighth consecutive weekly gain, which is the longest streak since 2019.
Even the Russell 2000 Index of small-caps are on a three week win streak. But that’s leaving market stretched in the near-term by a number of measures. First, short-term breadth is becoming overbought and is starting to display a few minor negative divergences.
The percent of stocks trading above their 20-day moving average jumped to around 75% on this recent rally. That’s a great sign of broadening participation in short-term trend. But now I would start to monitor for negative divergences, which has helped pinpoint downside in the indexes on several occasions over the past year.
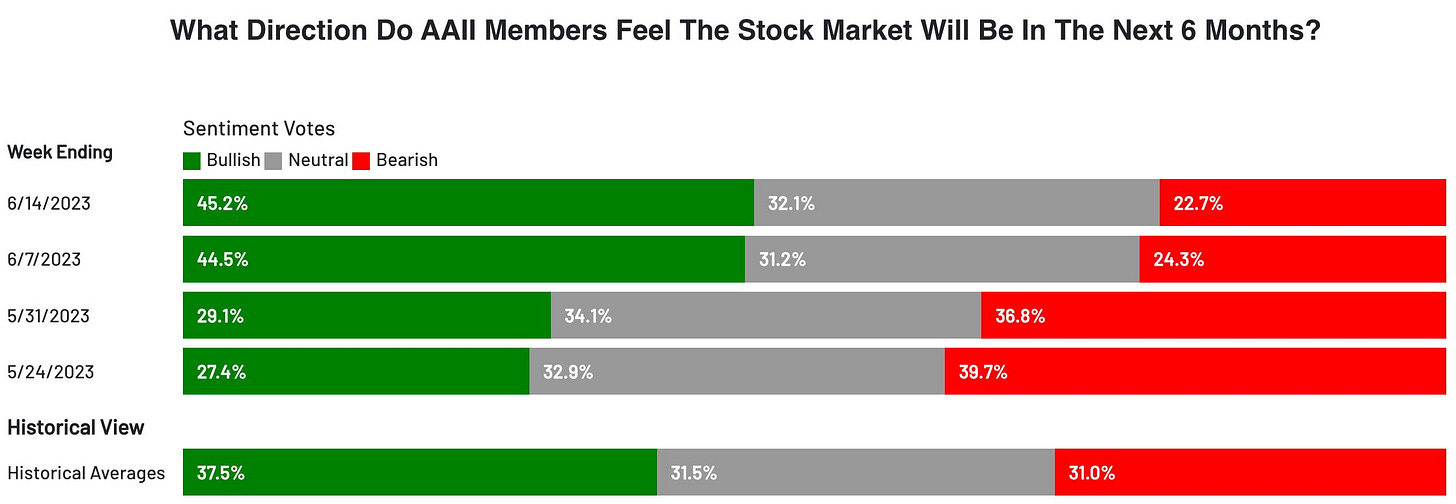
The bullish bandwagon is also filling up quickly. The AAII’s latest report shows bullish investors now at 45%, which is the highest level since November 2021. That echoes CNN’s Fear & Greed Index that is squarely in “extreme greed” territory.
Given positive developments with recent broadening participation in the stock market’s trend, I would expect any pullback to be a pause in the uptrend. That’s especially the case if the earnings picture continues improving.
I’m trailing open positions with a moving average stop, and slowly taking partial gains along the way as well. I’ve previously outlined how I manage my trades here.
I’m also eyeing other trade ideas among companies showing strong sales and earnings growth that are still setting up in their chart patterns. That includes SWAV which is still consolidating just below the $310 area.
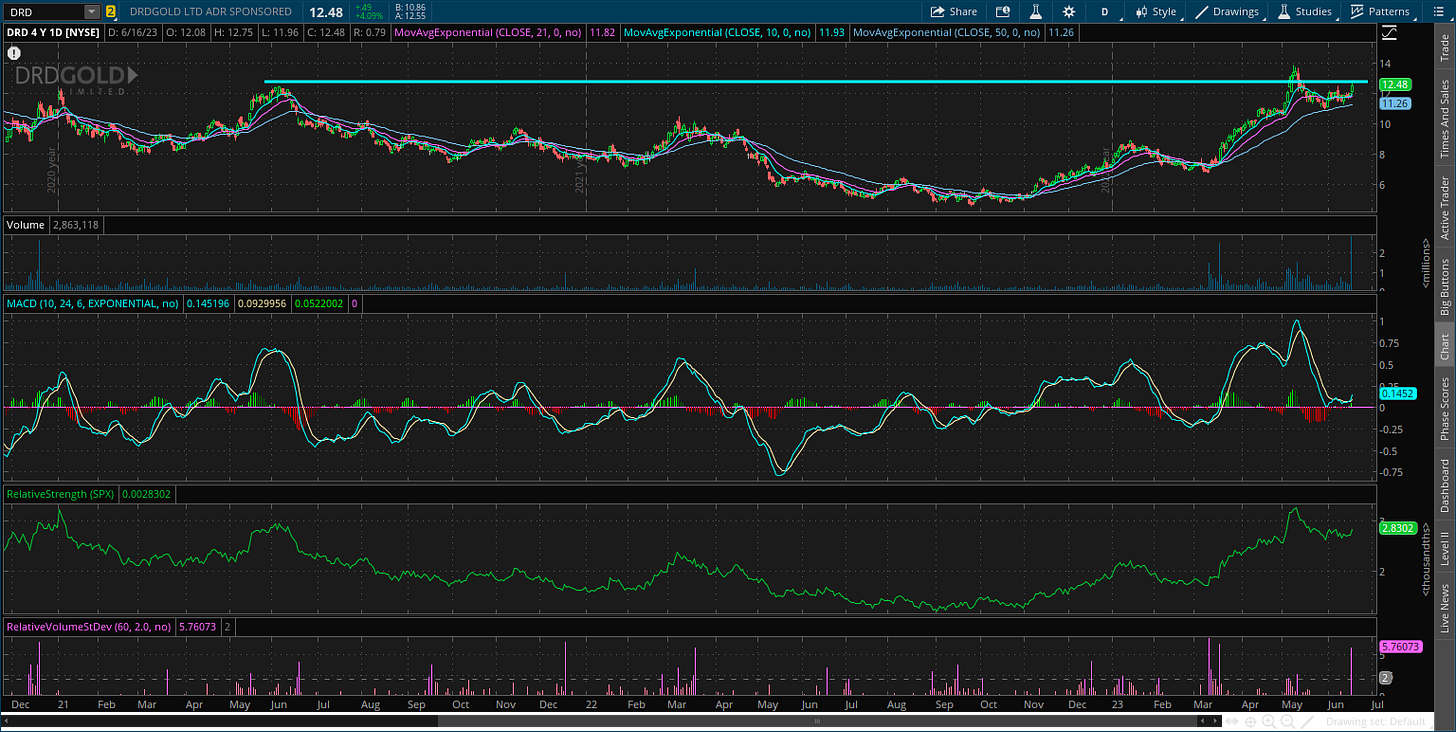
And if gold prices can keep turning higher off the $1,950/oz support level, I’m watching the setup in DRD. It’s showing great relative strength among gold miners, along with the MACD resetting at the zero line. I’m now watching for a breakout over $13.50 area.
That’s all for this week. The coming week should be relatively quiet on the macro front, with several Fed speakers lined up along with a few reports on the housing market. I’ll be watching how the stock market digests these recent gains while monitoring for any negative breadth divergences ahead of the 2Q earnings season.
I hope you’ve enjoyed The Market Mosaic, and please share this report with your family and friends…or anyone that would benefit from an objective look at the stock market.
And make sure you never miss an edition by subscribing here:
For updated charts, market analysis, and other trade ideas, give me a follow on Twitter: @mosaicassetco
And if you have any questions or feedback, feel free to shoot me an email at mosaicassetco@gmail.com
Disclaimer: these are not recommendations and just my thoughts and opinions…do your own due diligence! I may hold a position in the securities mentioned in this report.


