The Market Mosaic 6.16.24
Earnings growth needs to take the bull market baton.
Welcome back to The Market Mosaic, where I gauge the stock market’s next move by looking at macro, technicals, and market internals. I’ll also highlight trade ideas using this analysis.
If you find this content helpful please hit that “like” button, share this post, and become a subscriber to this always free report if you haven’t already done so!
And be sure to check out Mosaic Chart Alerts. It’s a midweek update covering chart setups among long and short trade ideas in the stock market, along with levels I’m watching.
Now for this week’s issue…
In today’s update, I want to highlight several key charts I’m watching for the capital markets and how they are impacting the near-term outlook.
I also have a quick summary and links to recent posts that remain impactful for monitoring the markets. And after that, you can find a few trade ideas and chart updates on setups that I’m monitoring.
Big Picture
Following Apple’s (AAPL) surge to new all-time highs last week, the “Magnificent 7” mega-cap stocks in the S&P 500 continue having an outsized impact on the index. The chart below shows the Mag 7 (green line) along with the remaining S&P members (blue line) and their returns since the start of 2021. At the same time, the forward price-to-earnings (P/E) ratio for the top 10 S&P 500 companies is running at 28.1x compared to 20.4x historically.

In order for the S&P 500 to build upon its gains, the driver of returns needs to broaden beyond multiple expansion. The chart below overlays the S&P 500 with the year-over-year change in the P/E ratio (purple bars) and earnings growth (orange bars). Growth in the P/E multiple has been the primary driver of returns since the bull market began in October 2022. While earnings growth is accelerating recently, it remains well off the pace of prior bull market runs.

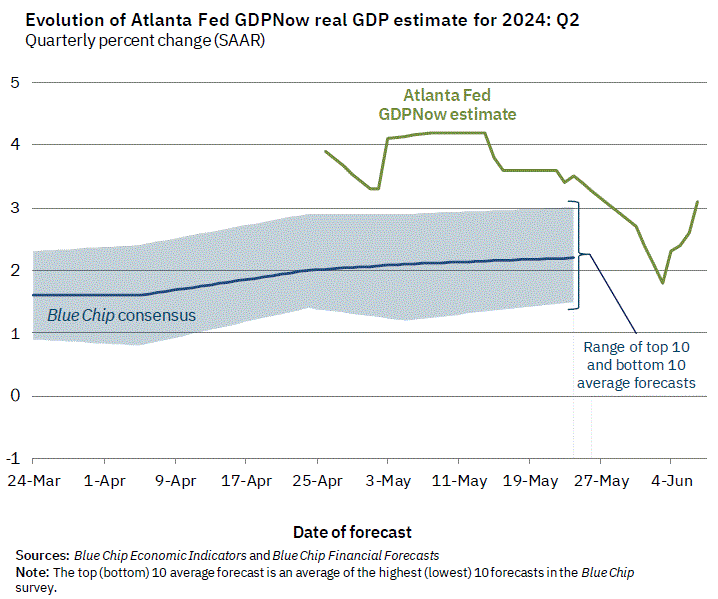
While coincident indicators of economic activity are painting a mixed picture, like with recent purchasing managers’ indexes (PMIs), trailing metrics continue pointing to a positive picture for the economy. That includes the recent payrolls report for May that came in 43% higher than consensus estimates, along with forecasts for current quarter GDP growth. The Fed’s Atlanta district maintains a real-time look at annualized GDP growth, which recently rose back above 3% in the chart below. Strong economic growth is critical to keep the corporate earnings recovery going.
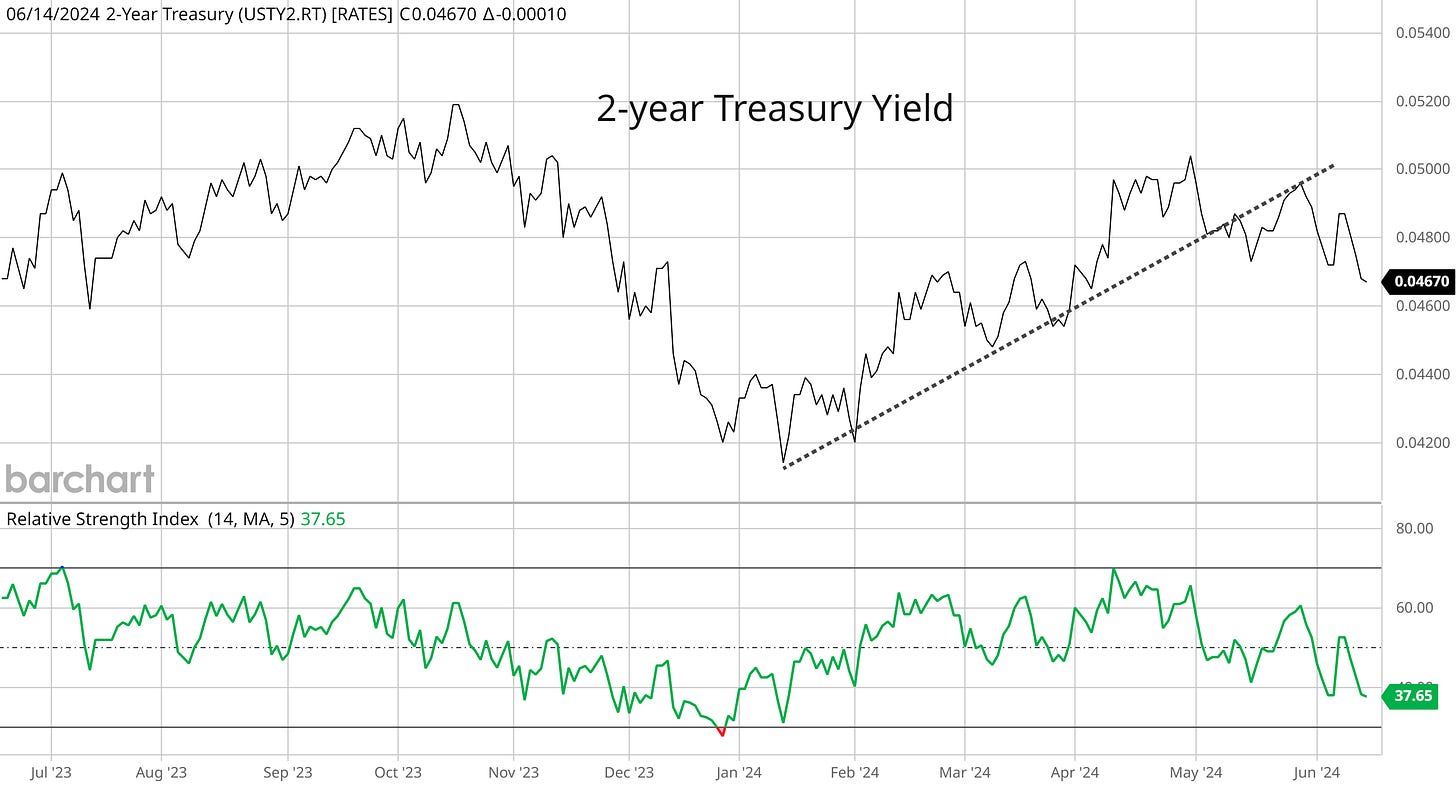
The prospect of a “Goldilocks” environment for the stock market could be back in the works. In addition to signs that the economy is holding up well, last week’s cooler inflation reports are ramping up bets that the Fed will start cutting interest rates soon. Market-implied odds are back to pricing two 0.25% interest rate cuts for the year, while favoring a cut at the Fed’s September meeting. In addition, the 2-year Treasury yield in the chart below is breaking below support of an uptrend that extends back to January. The 2-year tends to lead changes in the short-term fed funds rate, and is another sign that dovish views on monetary policy are rising again.
If the Fed cuts interest rates soon, historical precedent suggests that small-cap stocks could be the main beneficiary. The chart below looks at forward returns for small-caps relative to large-cap stocks going back to 1974 following the first rate cut by the Fed. After the first rate cut, smalls transition from laggards to leaders, with notable outperformance 12 months following the first cut.
Better performance from small-caps and the average stock would be most welcome. The average stock is lagging badly since the end of May, which is shown across numerous breadth metrics. That includes the number of 52-week highs less 52-week lows, or net new highs. After confirming much of this recent leg in the bull market with a regime of net new highs since the end of 2023, net new lows are expanding once again even as the S&P 500 is holding near record high levels. That compares to the last expansion in net new lows when the S&P was pulling back into mid-April.
With the S&P 500 recently making fresh record highs, investors should be feeling good about themselves. But gauges of investor sentiment are mixed at the moment. While the AAII survey of retail investors showed a big jump in bullish outlooks to 44.6% from 39.0% in their latest report, CNN’s Fear & Greed Index is actually tipping into “fear” territory. While the increase in bearish sentiment might reflect the poor performance in the average stock noted above, it’s worth noting that CNN’s metric is comprised of market-based indicators (as opposed to being survey-based like AAII).
Mosaic Tidbits
Here are a few of my recent posts that are still impactful and relevant to the message coming from the capital markets and the stock market’s next move:
As the S&P 500 is recently moving out to record highs, I’m watching the chart action in Bitcoin and small-cap stocks that risk-on sentiment among investors is gaining traction.
While weak stock market breadth is prevalent, it’s a condition to monitor rather than a sell signal. That’s because negative breadth divergences can prevail for months before selling pressure really hits.
Not all breadth metrics are diverging negatively. The underlying action in high yield bonds continues to confirm the stock market rally and signal a positive outlook for the economy.
Following speculation around the Fed’s next move on interest rates, investors should keep an eye on the U.S. Dollar Index that’s trading in a key consolidation pattern. A breakout can have major implications for a number of asset classes.
Chart Updates
MicroStrategy (MSTR)
If Bitcoin can breakout to new record highs, then I’m watching the setup in MSTR. Price recently trading just below resistance near the $2,000 level. The MACD is making a “hook” pattern by resetting at the zero line while the relative strength (RS) line holds near the high. Watching for a move over $1,750 followed by the $2,000 level.
Palantir (PLTR)
Trading in a new basing pattern since February following a big gap higher. Recently turning back higher toward resistance around the $25 level. Would like to now see the MACD reset at zero on a small pullback in price. Watching for a move over $25.
Reddit (RDDT)
After going public back in March, price is basing near the post-IPO highs while the MACD is turning up from the “hook” pattern that I’ve described in recent videos. Now watching for a new high over $70 with the RS line at a new high.
I hope you’ve enjoyed The Market Mosaic, and please share this report with your family, friends, coworkers…or anyone that would benefit from an objective look at the stock market.
And make sure you never miss an edition by subscribing here:
For updated charts, market analysis, and other trade ideas, give me a follow on X: @mosaicassetco
And if you have any questions or feedback, feel free to shoot me an email at mosaicassetco@gmail.com
Disclaimer: these are not recommendations and just my thoughts and opinions…do your own due diligence! I may hold a position in the securities mentioned in this report.


Thank you. Re-reading the Market Mosaic 3-4 times is really all the prep I need.