
The Market Mosaic 6.15.26
AI Rally Goes Viral: Bull Market Spreads Beyond Big Tech.

👋Welcome back to The Market Mosaic, where I gauge the stock market’s next move by looking at macro, technicals, and market internals. I’ll also highlight trade ideas using this analysis.
If you find this report helpful please hit that “like” button, share this post, and become a subscriber if you haven’t already done so!
🚨And be sure to check out Mosaic Traders Hub. It’s a members-only platform to alert trade ideas, track a model portfolio of open positions, and further analyze the message coming from the capital markets.
Now for this week’s issue…
Investor optimism is growing as durable signs of a peace agreement between the U.S. and Iran looks within reach while the SpaceX (SPCX) IPO becomes the largest in history.
News of an peace deal between the U.S. and Iran has made headlines frequently in the past. But this time, both sides along with other parties involved with negotiations are confirming the deal.
That’s leading to a spillover effect in the stock market, where oil prices and longer-dated bond yields are both pulling back. A negative correlation between stocks and oil prices means the drop in energy prices is a tailwind for equities.
But that wasn’t the only bullish news boosting stocks. The SpaceX IPO was oversubscribed by four times, highlighting demand for the shares. The company debuted with a valuation that ran past $2 trillion, making SpaceX one of the most valuable companies in the world.
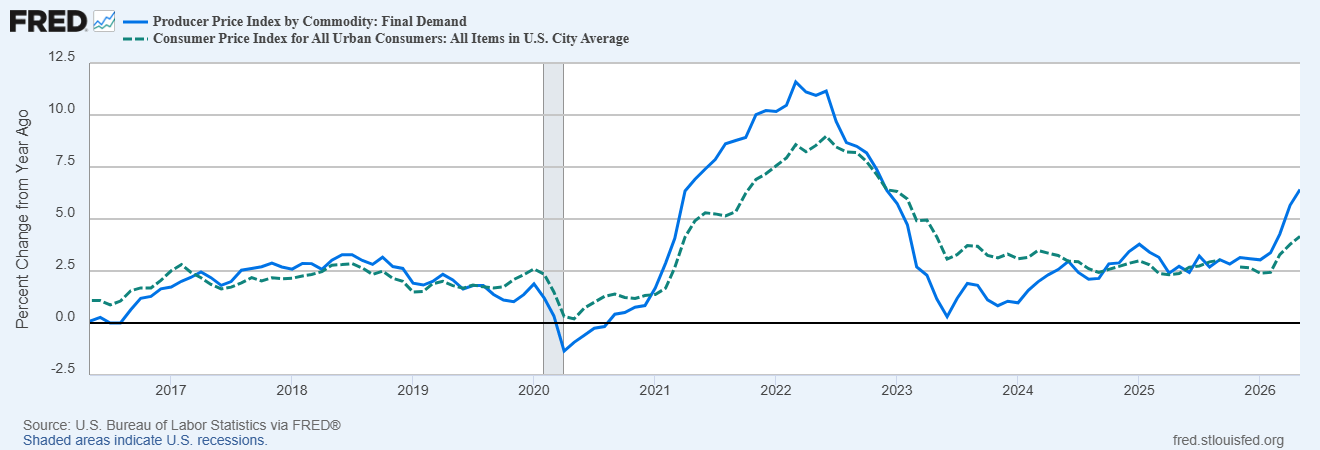
While there was plenty of positive catalysts greeting investors, not all reports brought good news for equities. That includes a pair of inflation reports covering consumer and producer prices.
The Consumer Price Index (CPI) jumped by 4.2% in May compared to last year while the Producer Price Index (PPI) surged higher by 6.5%. Both inflation measures are at the highest level since coming out of the pandemic-driven inflation wave (chart below).
While equity markets shrugged off inflation fears and the impact to valuations and monetary policy, better economic data is giving the average stock a reason to rally.
This week, let’s look at a positive breadth divergence that formed heading into the SpaceX IPO and factors driving a boost in the average stock. We’ll also look at the variables coming together to drive another inflation wave similar to the one that peaked in 2022.
The Chart Report
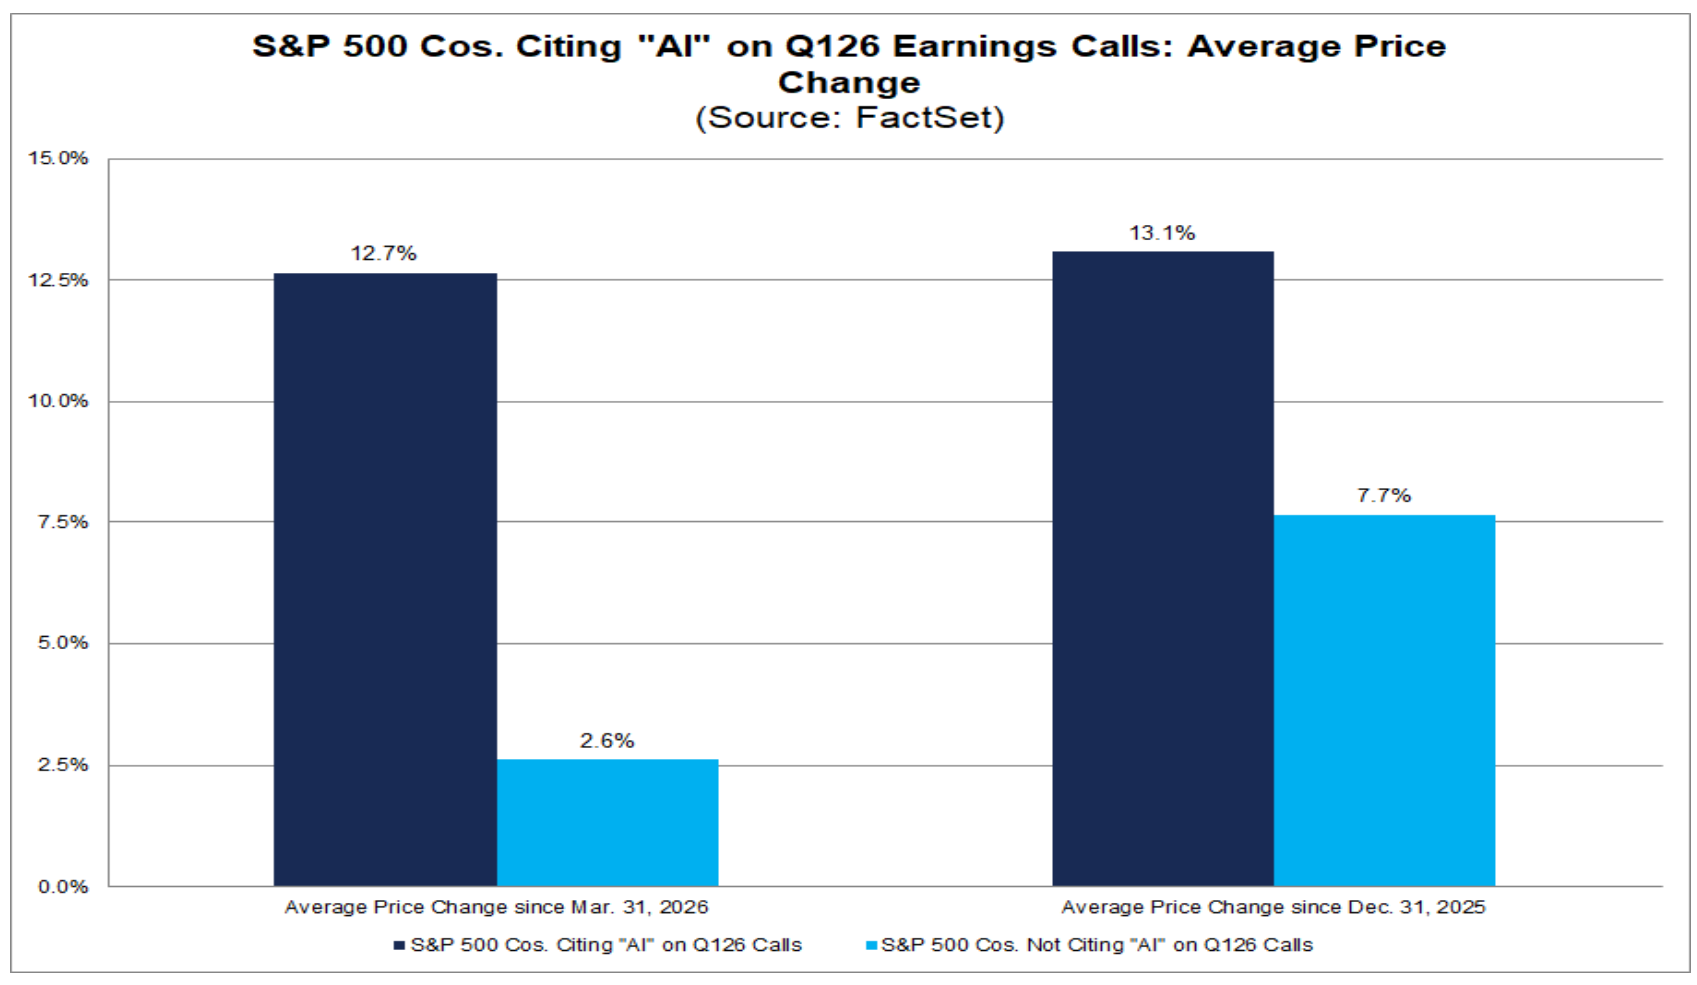
The SpaceX IPO smashed records by becoming the largest company to ever go public while also raising $75 billion. While SpaceX has a unique set of growth catalysts serving as tailwinds along with a polarizing chief executive in Elon Musk, the company is just the latest being caught in a speculative mania. The introduction of ChatGPT back in late 2022 coincided with the start of this cyclical bull market, and bullish sentiment around artificial intelligence infrastructure spending is boosting stocks once again. Just the mention of AI can serve as a tailwind for stock prices. The chart below compares S&P 500 companies citing AI on their 1Q26 earnings calls and their share price performance relative to those not citing AI. Since the start of the second quarter, companies mentioning AI have seen their share prices gain 12.7% on average compared to 2.6% for companies not mentioning AI.
While the stock market is shrugging off challenges on the geopolitical and monetary outlook, a sharp move higher in expected earnings growth is delivering a boost. The chart below shows that earnings growth for the S&P 500 is expected to top 20% in each quarter of 2026. Earnings optimism around AI spending is playing a key role, but you can also see that the median earnings growth is holding in line with prior years as well. Surveys of business activity in manufacturing and service sectors continue pointing to growth, while payrolls have seen a sharp rebound in recent months as well. Positive signs of broadening economic activity and the earnings outlook is a boost for the average stock.

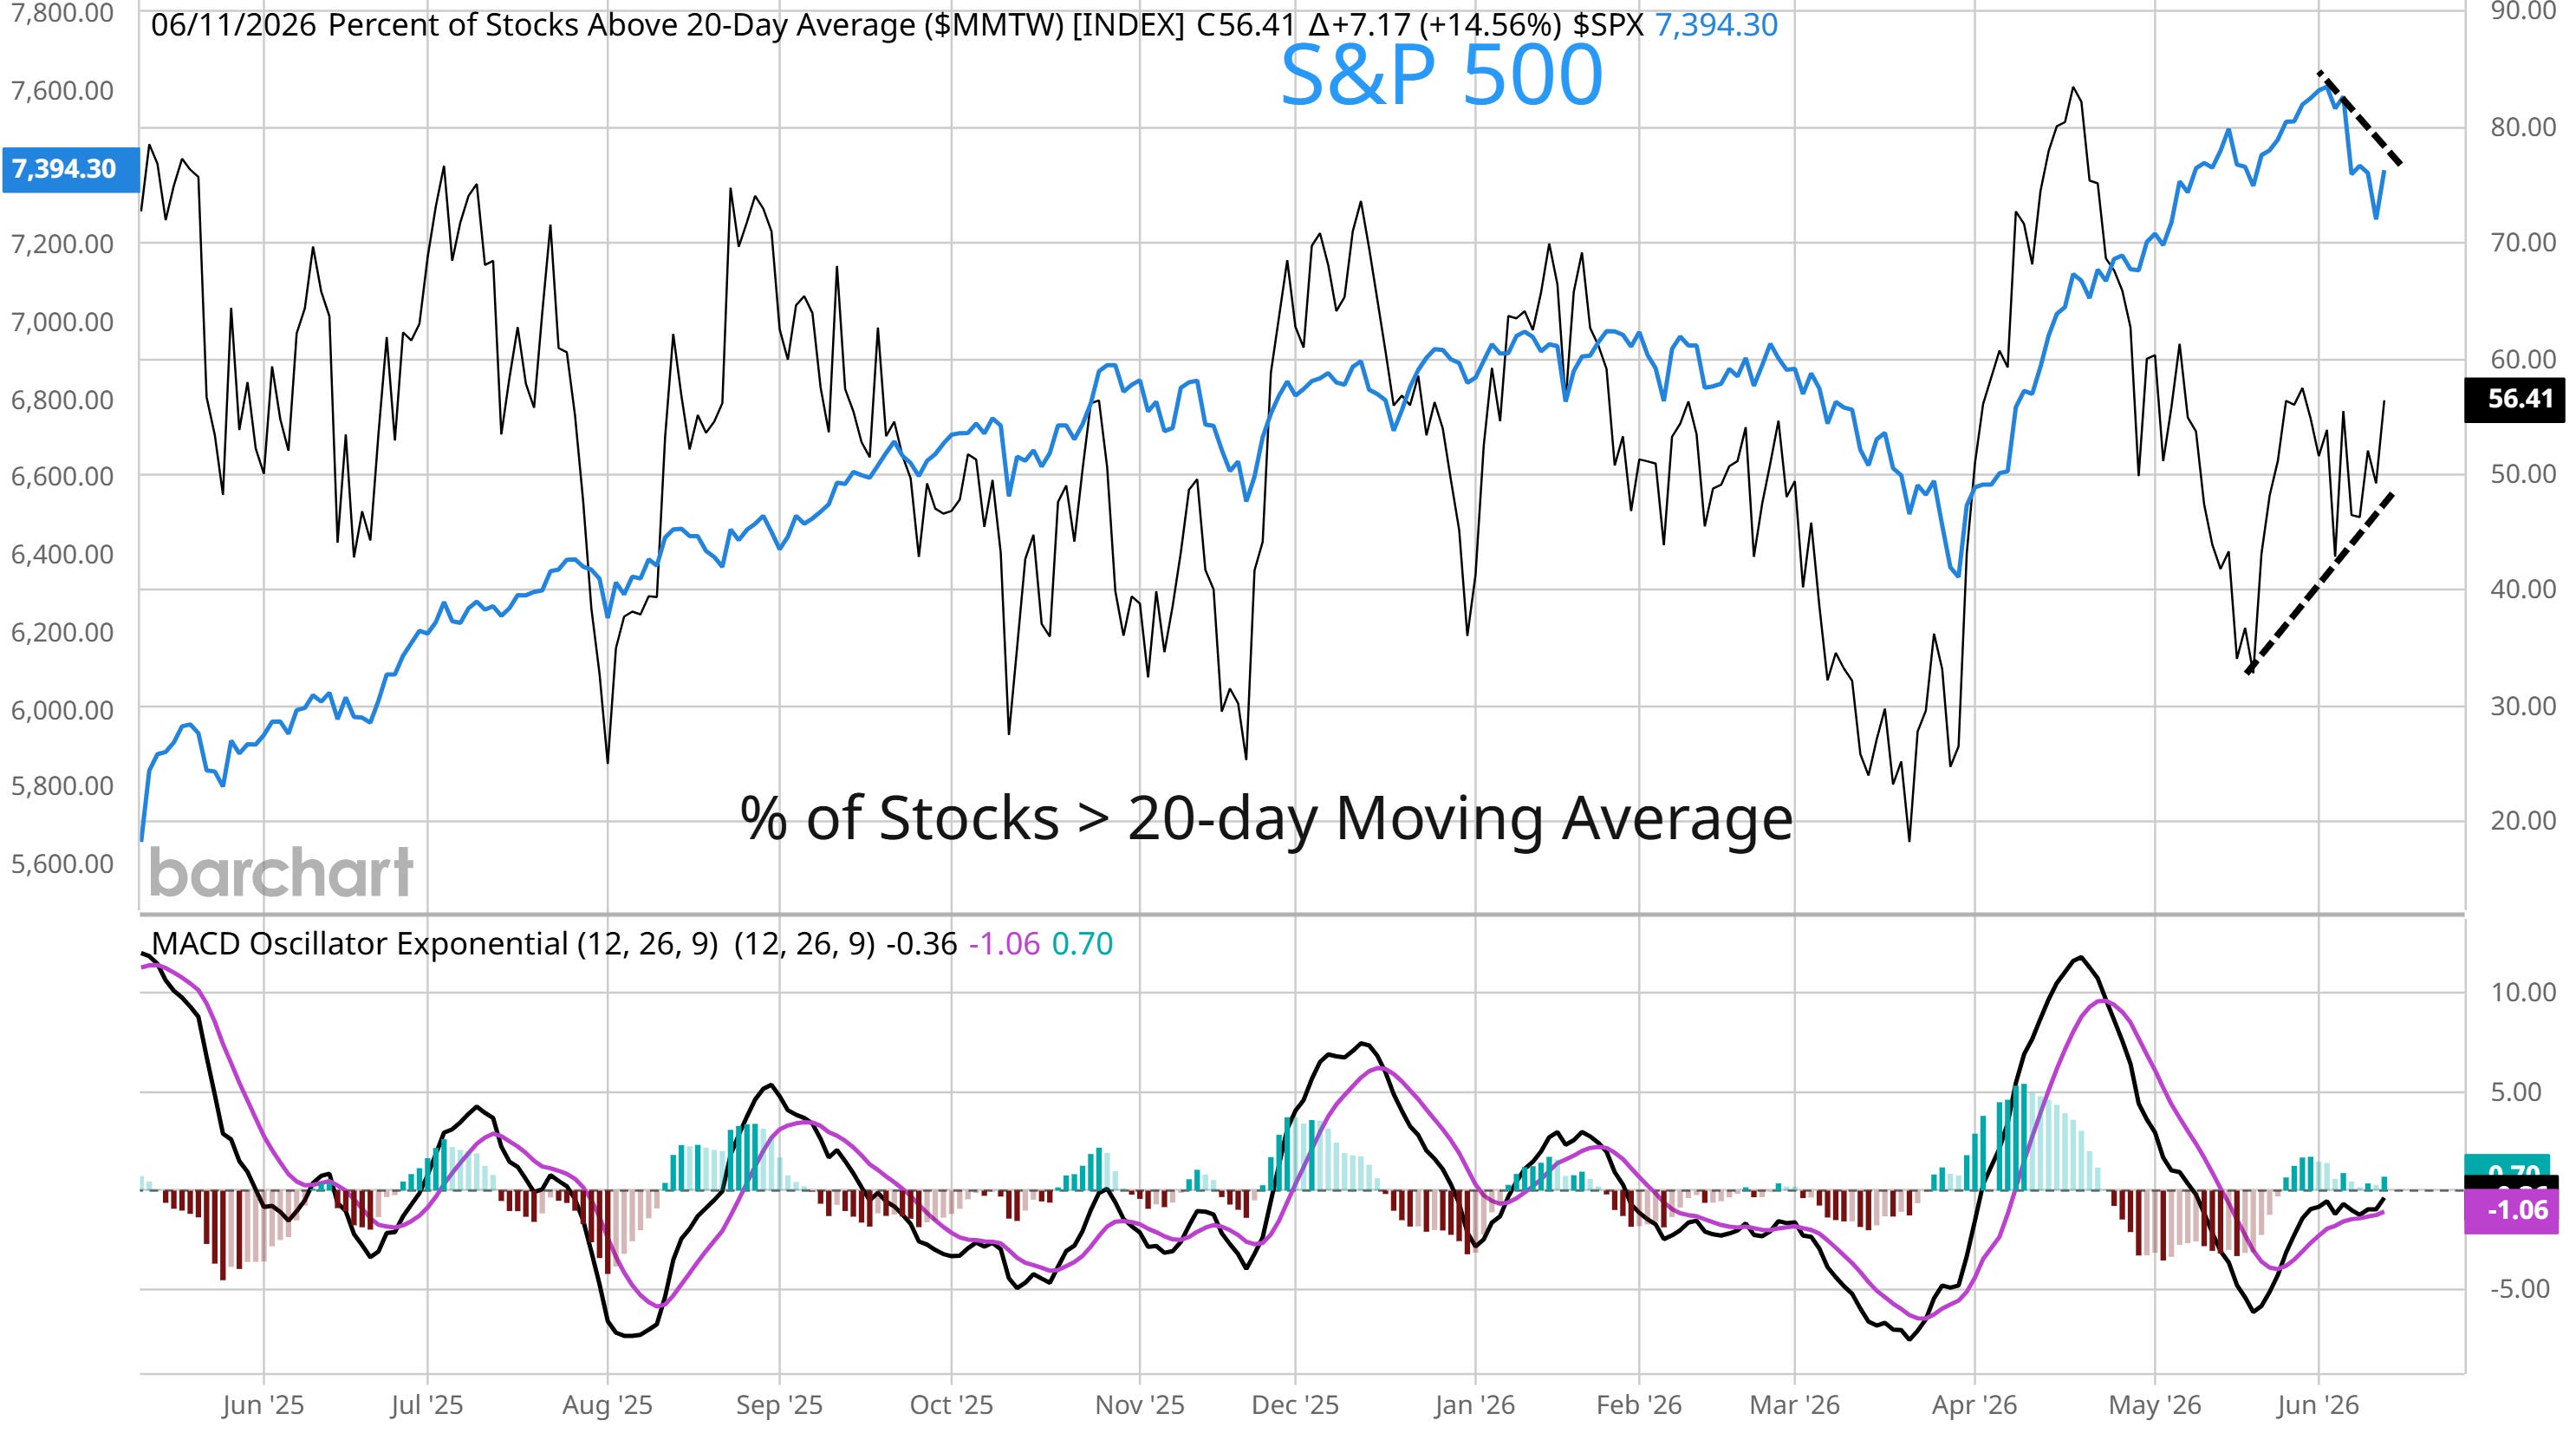
With evidence of growth spreading beyond stocks leverage to the AI buildout, the performance of the average stock has been quietly improving. While the S&P 500 has been pulling back since the early June high, measures of market breadth have been holding up much better. That includes the percent of stocks across major exchanges trading above their 20-day moving average (MA) in the chart below. During the most recent pullback in the S&P, the percent of stocks in short-term uptrends has been improving that you can see with the dashed lines. The improvement in breadth is coming off an oversold condition seen in the average stock into the middle of May.
Many investors and economists are hopeful that a resolution to the war in the Middle East means an energy-driven jump in inflation will be temporary. But other inflation measures show that pressure in key core categories that exclude food and energy prices are inflecting higher as well. Core services ex-housing, which is also called super core inflation, increased by 3.7% in the May CPI report while recent annualized figures jump to the highest level in over a year (chart below). Back in 2022, outgoing Fed chair Jerome Powell called super core inflation “the most important category for thinking about future inflation down the road” since it tracks underlying price and wage pressures in labor intensive industries.

Multiple catalysts are coming together at the same time to drive a jump in inflation, and resembles factors driving the last inflation wave into 2022. Back then, the economy received a stimulus boost following the pandemic while supply chains were disrupted and energy prices spiked following Russia’s invasion of Ukraine. This time, inflation catalysts include higher energy prices following the conflict in the Middle East and stimulus from large federal budget deficits (including the One Big Beautiful Bill). At the same time, a measure of price pressures from supply chain bottlenecks is increasing that you can see in the chart below. Cost increases from energy prices and upheaval following last year’s trade war are likely playing a key role.

Heard in the Hub
The Traders Hub features live trade alerts, market update videos, and other educational content for members.
Here’s a quick recap of recent alerts, market updates, and educational posts:
Growing evidence the economy is heating up.
Is the average stock about to catch the AI trade?
A bullish pattern developing in the NYSE’s A/D line.
Strong jobs data is a positive catalyst for the earnings outlook.
Watch stocks leveraged to the space theme as SpaceX goes public.
You can follow everything we’re trading and tracking by becoming a member of the Traders Hub.
By becoming a member, you will unlock all market updates and trade alerts reserved exclusively for members.
Trade Idea
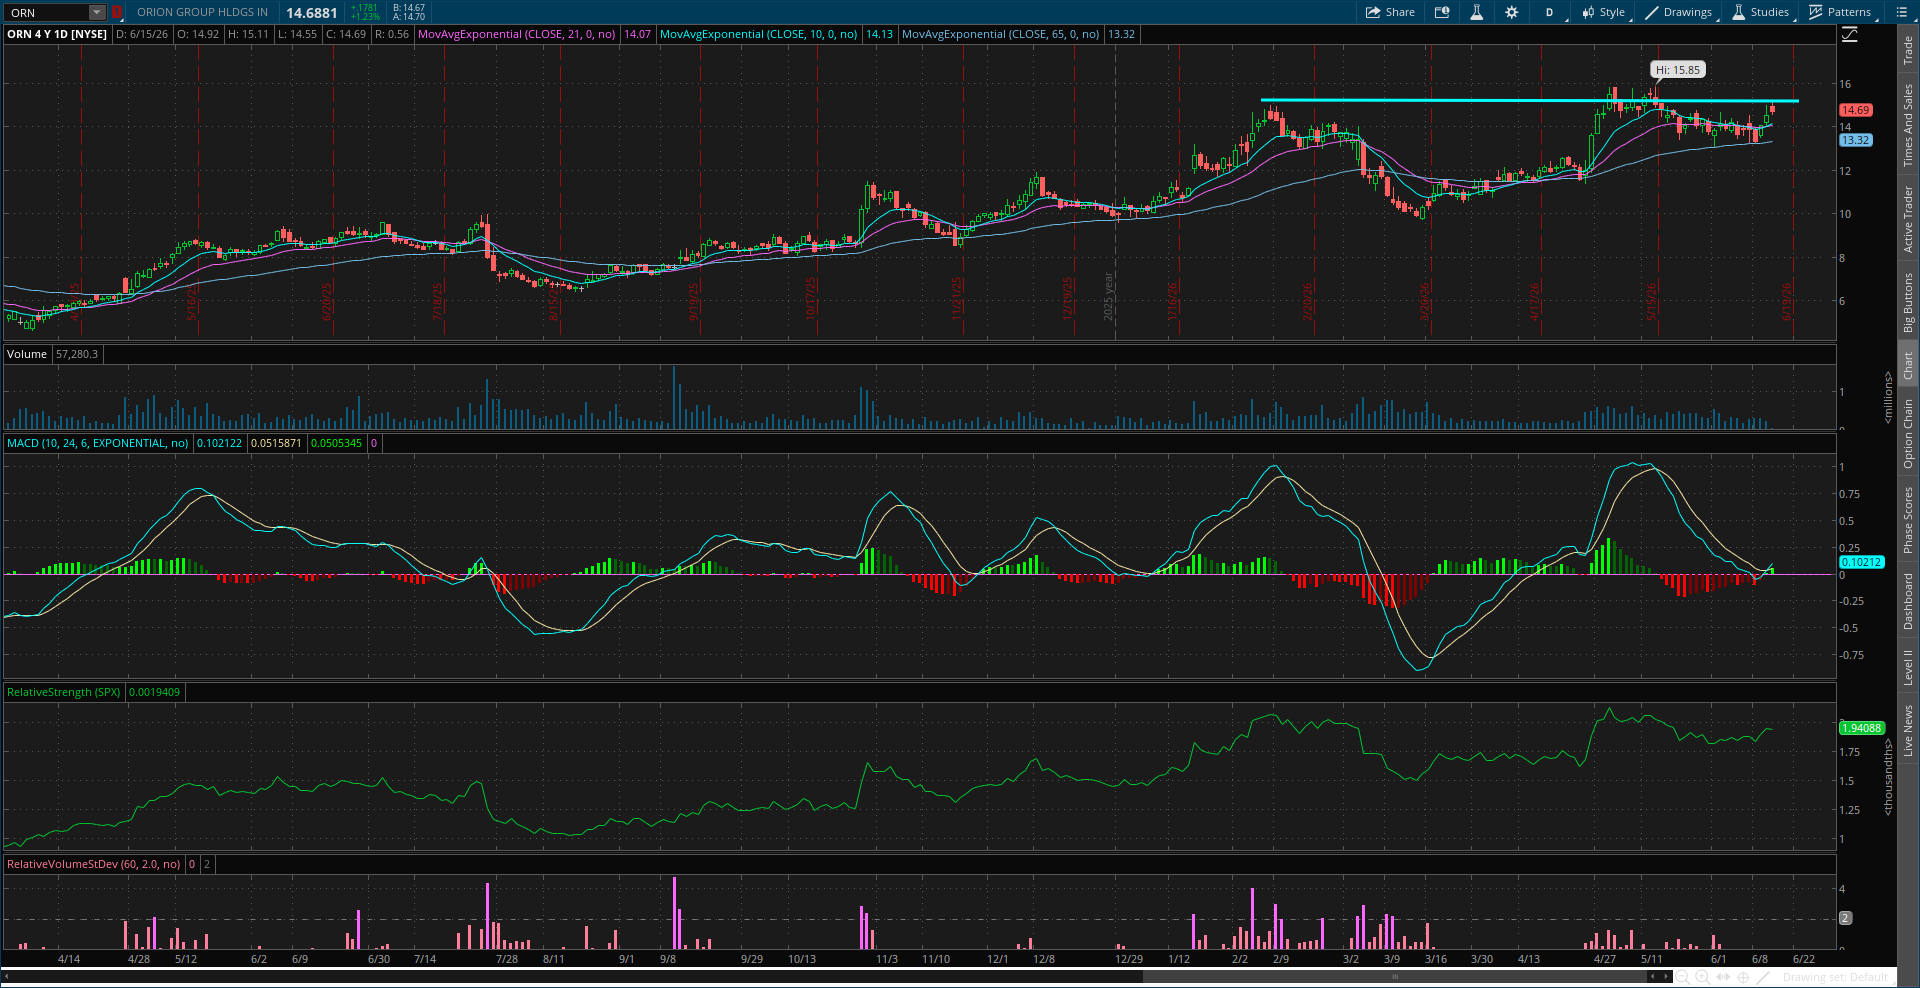
Orion Group (ORN)
A new basing structure is forming on top of a bigger breakout over the $12 area. The stock is making a MACD hook following a test of resistance near the $16 level. I’m watching for a move over $15.50.
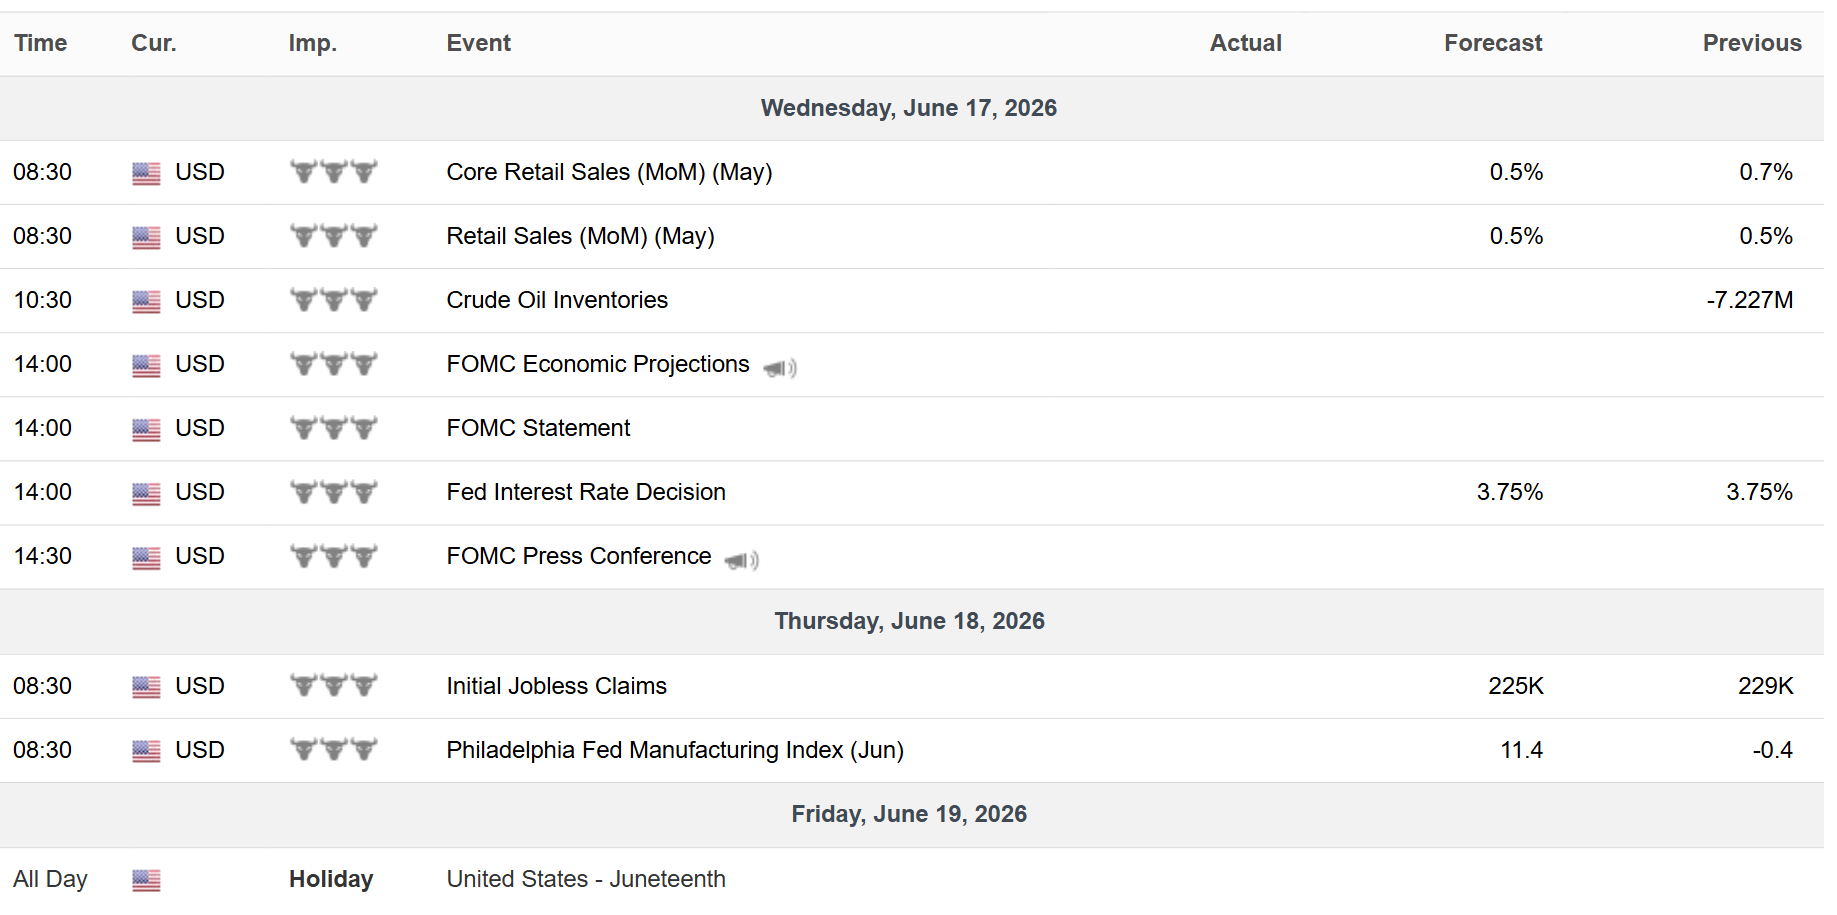
Key Upcoming Data
Economic Reports
Earnings Reports

I hope you’ve enjoyed The Market Mosaic, and please share this report with your family, friends, coworkers…or anyone that would benefit from an objective look at the stock market.
Become a member of the Traders Hub to unlock access to:
✅Model Portfolio
✅Members Only Chat
✅Trade Ideas & Live Alerts
✅Mosaic Vision Market Updates + More
Our model portfolio is built using a “core and explore” approach, including a Stock Trading Portfolio and ETF Investment Portfolio.
Come join us over at the Hub as we seek to capitalize on stocks and ETFs that are breaking out!
And if you have any questions or feedback, feel free to shoot me an email at mosaicassetco@gmail.com
Disclaimer: these are not recommendations and just my thoughts and opinions…do your own due diligence! I may hold a position in the securities mentioned in this report.
The paradox in this week's data is that breadth is improving while the index pulls back, and inflation is accelerating in exactly the category the market is choosing to ignore. The AI premium, 12.7% versus 2.6% for companies mentioning AI on earnings calls, is real and measurable, but it is layered on top of a super core inflation print at 3.7%, the highest annualised reading in over a year, in a category that has nothing to do with the Hormuz energy shock everyone is using to dismiss the headline number.
That distinction matters for the government bonds underweight that half of tactical allocators currently hold. The consensus thesis assumes the current inflation wave is energy-driven and therefore temporary once the Iran deal settles. Super core does not care about oil. If services ex-housing keeps climbing independently of the energy story, the underweight stops being a bet on a temporary shock and becomes a bet against a structural repricing.
Breadth improving is the bullish signal everyone wants to see. Super core inflection is the one nobody wants to discuss.