
The Market Mosaic 6.15.25
A massive breakout in commodities is looming.

👋Welcome back to The Market Mosaic, where I gauge the stock market’s next move by looking at macro, technicals, and market internals. I’ll also highlight trade ideas using this analysis.
If you find this report helpful please hit that “like” button, share this post, and become a subscriber if you haven’t already done so!
🚨And be sure to check out Mosaic Traders Hub. It’s a members-only platform to alert trade ideas, track a model portfolio of open positions, and further analyze the message coming from the capital markets.
Now for this week’s issue…
Despite a pair of better than expected inflation reports, higher price levels could be lurking for consumers in the months ahead.
The Consumer Price Index (CPI) increased by 2.4% in May compared to last year while the core figure that excludes food and energy prices rose by 2.8%. Although the headline figure accelerated slightly from last month, both measures came in below economist expectations.
The Producer Price Index (PPI) rose by 2.6% last month, with the core gauge increasing by 3.0%. The core figure slowed from April’s gain, and was less than expected.
The ongoing trend of core disinflation since mid-2022 stoked investor hopes that interest rate cuts by the Federal Reserve could be on the table this year. Following the CPI and PPI reports, market-implied odds shifted to show two 0.25% cuts being priced this year.
But just as investors hoped the disinflation trend would stay intact, geopolitical tensions in the Middle East are complicating the outlook. Missile exchanges between Israel and Iran are sending oil prices higher.
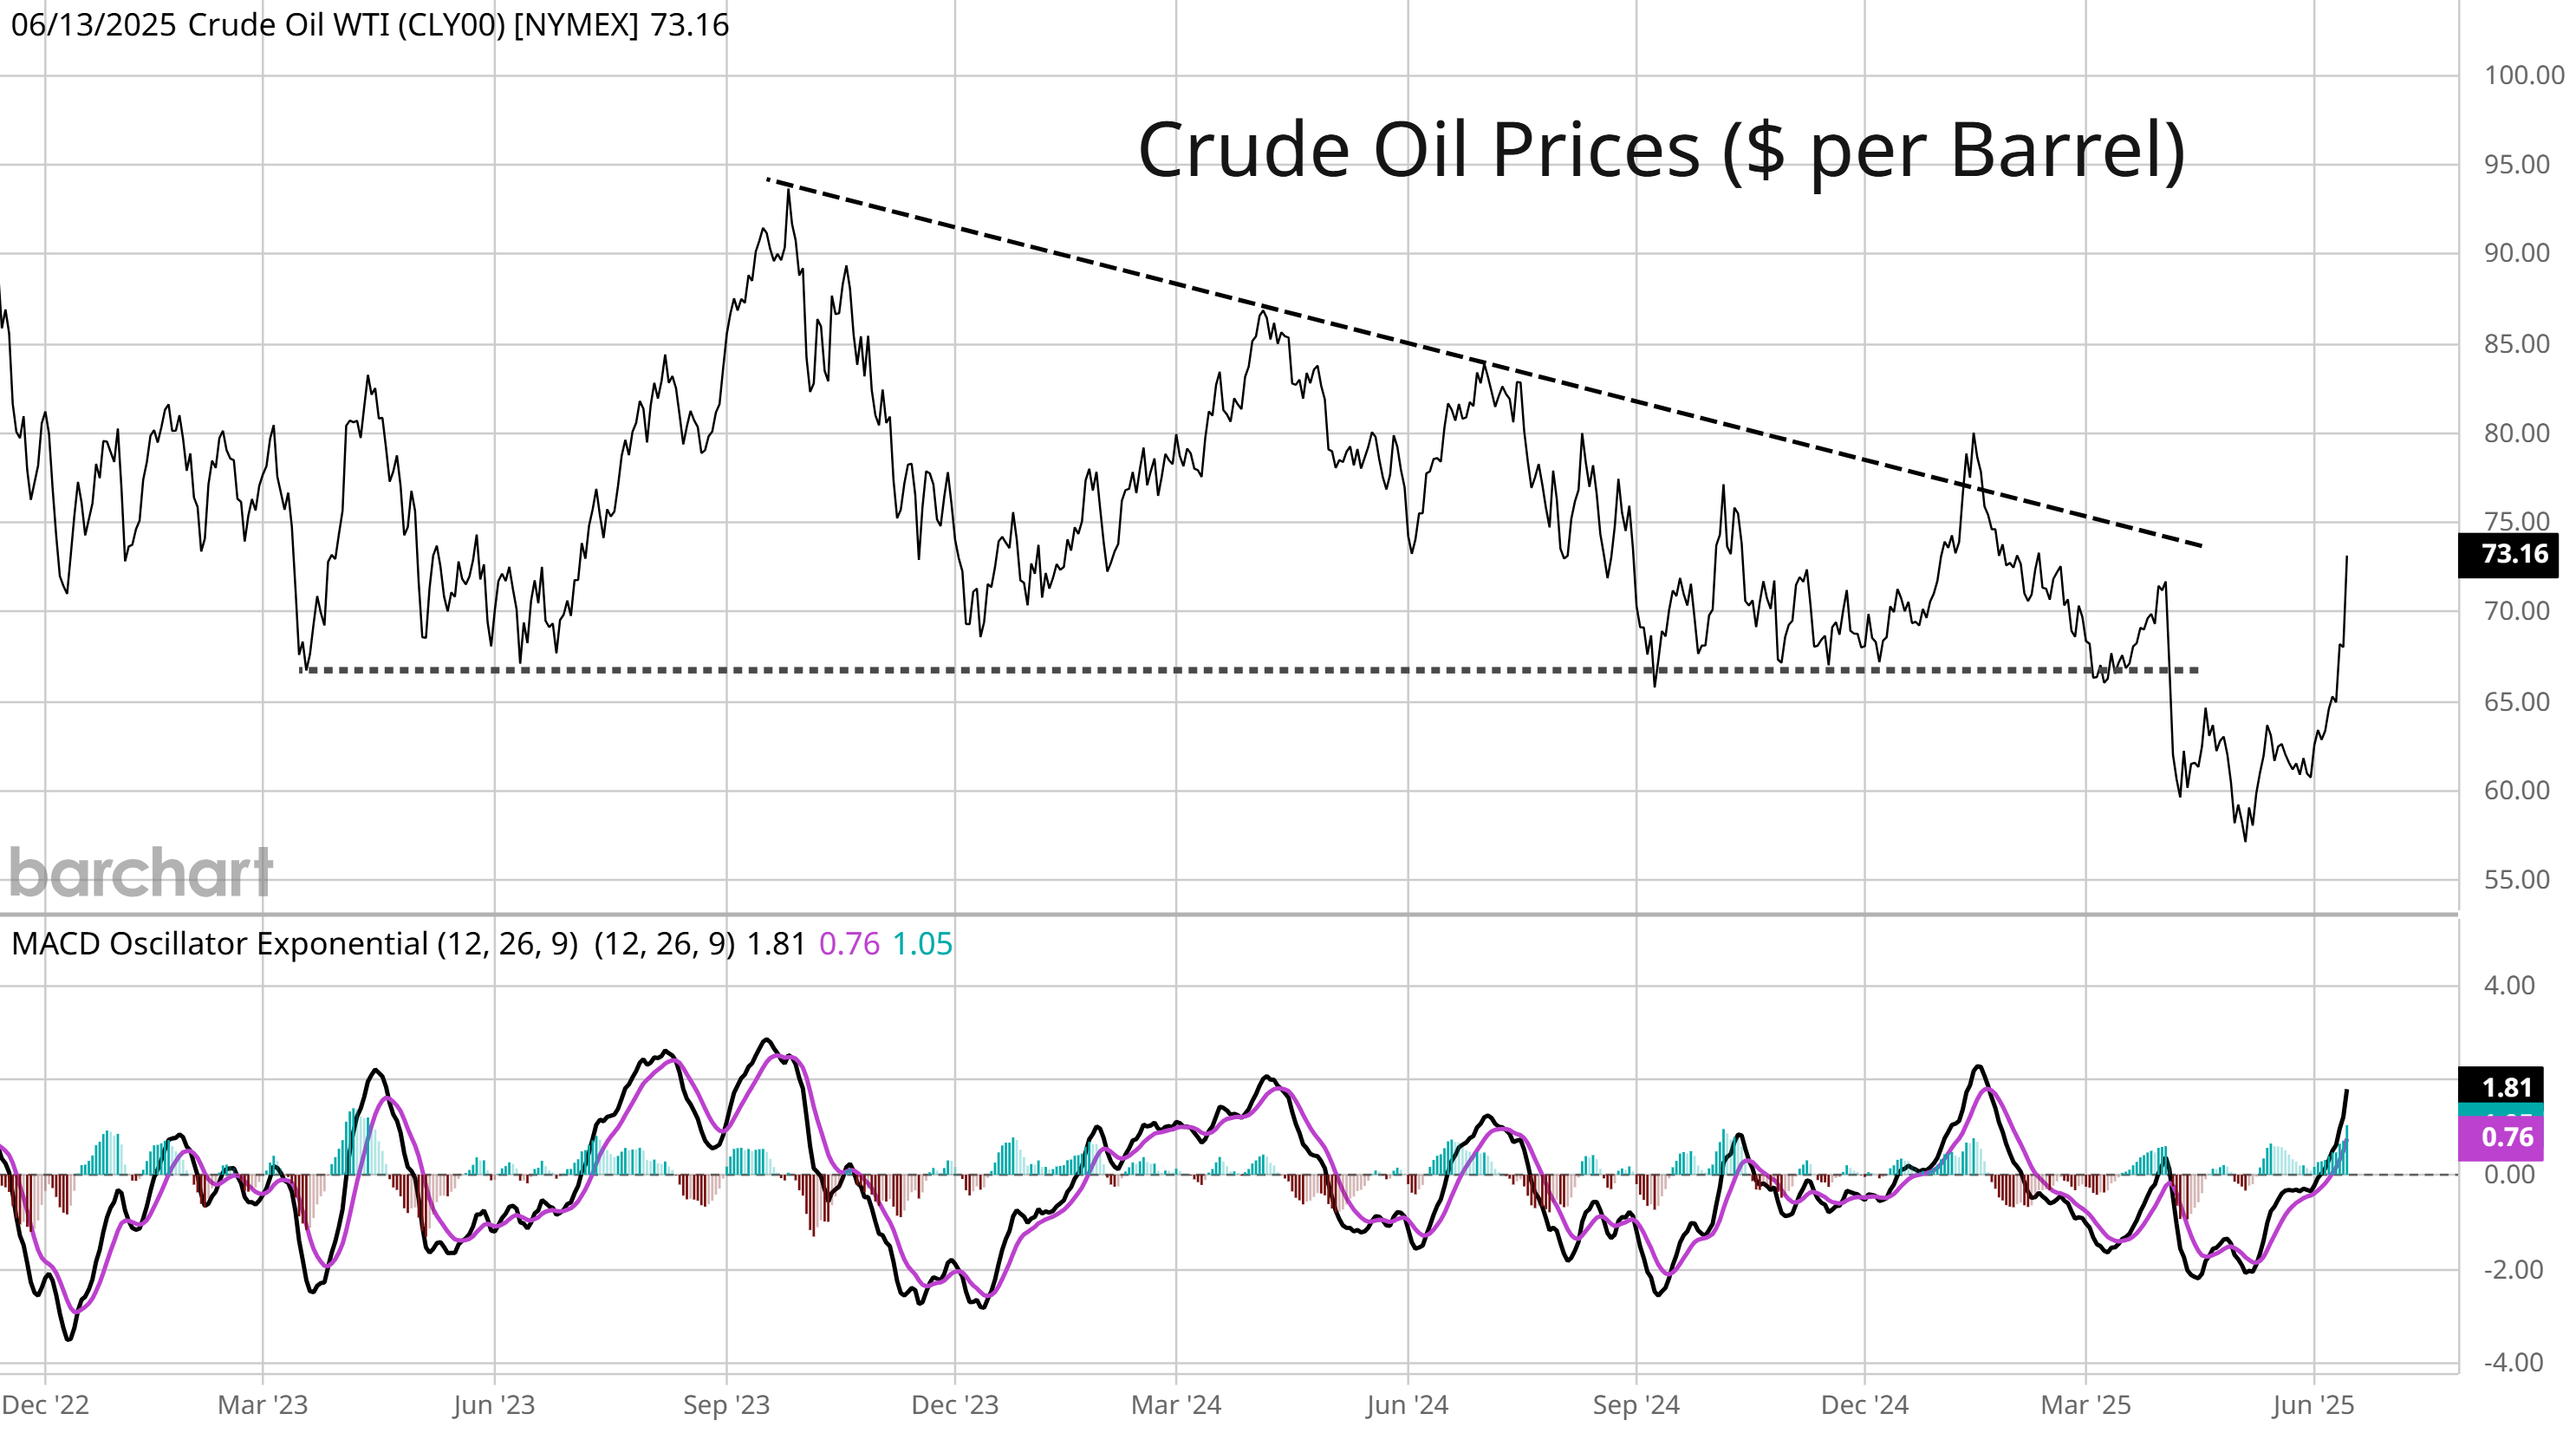
You can see in the chart below that oil prices are recovering from a failed breakdown of a descending triangle pattern. After dropping below key support at the $66 level, oil prices have staged a massive reversal on geopolitical tensions and fears over Middle East oil supplies.
Along with the U.S. Dollar Index (DXY) hitting the lowest level in over three years, the developments are sending broad commodity indexes near a key multi-year resistance level. A breakout would have significant implications on the inflation outlook in the months ahead.
This week, let’s dive further into the key level that could mark a major breakout in commodity prices, and the energy sector’s significant underweight in the S&P 500. We’ll also look at upcoming near-term market seasonality, and signs that safe haven demand is picking up.
The Chart Report
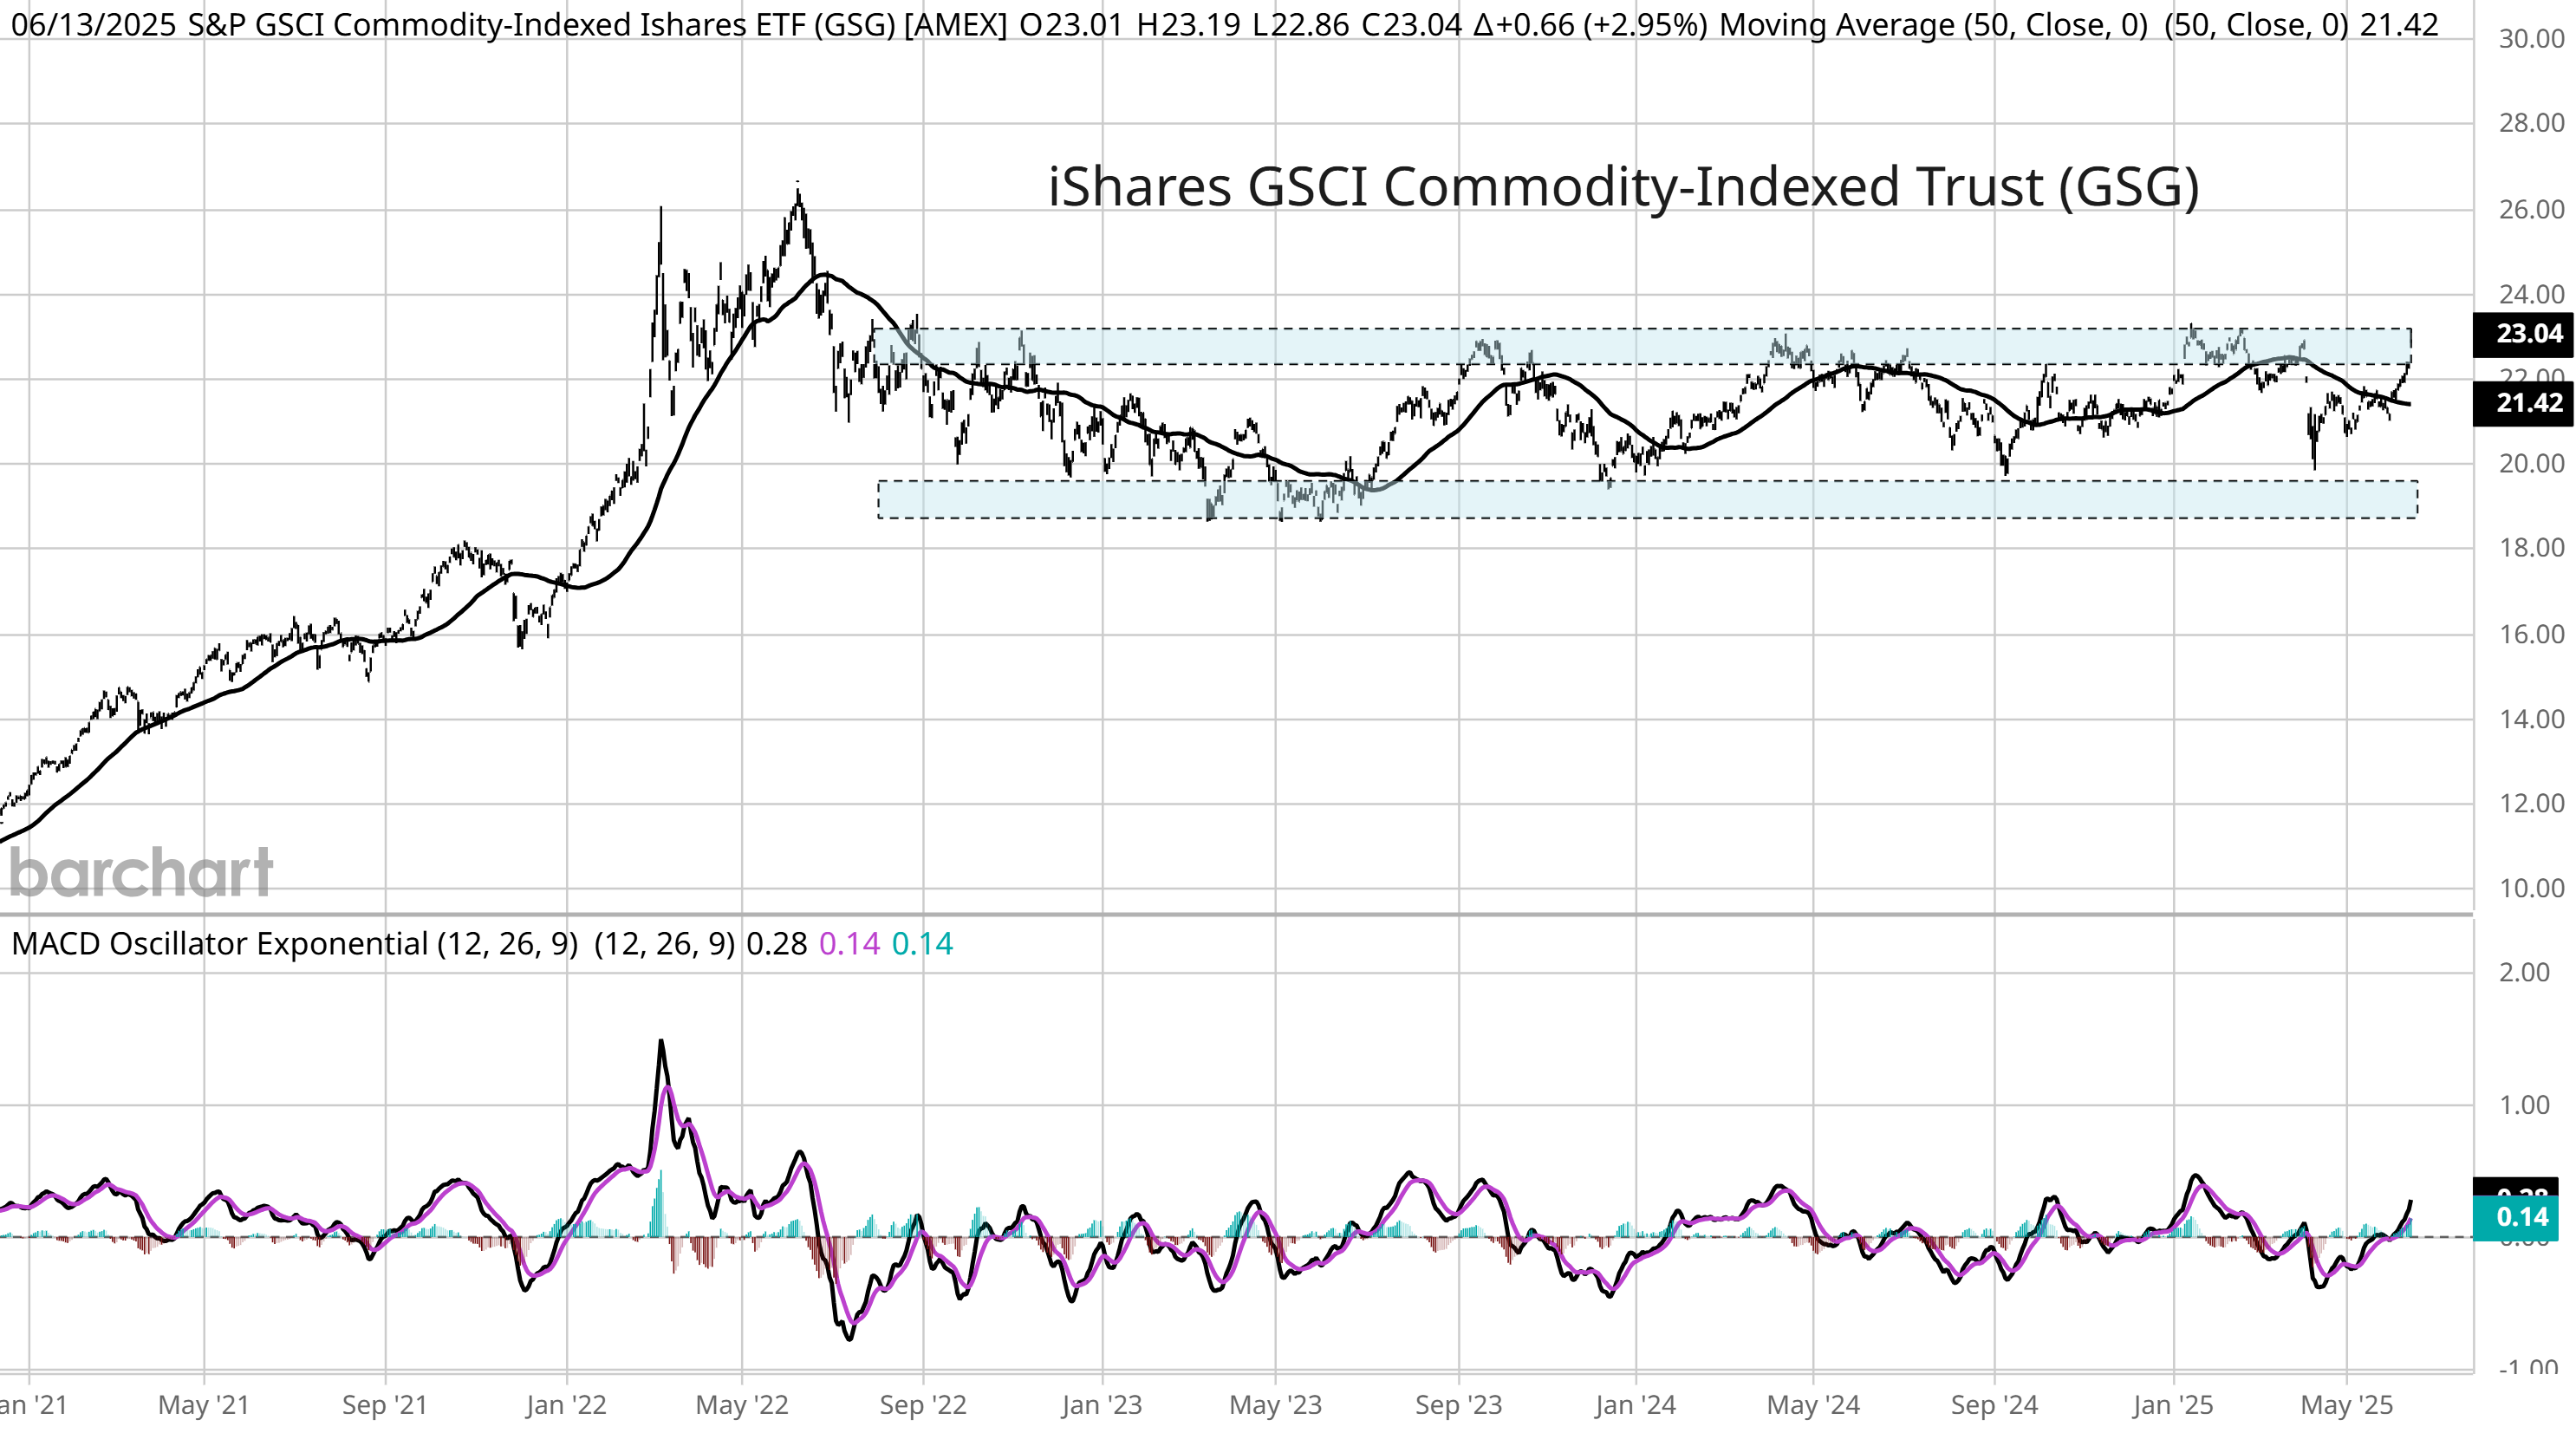
The turnaround in oil prices is driving broader commodity indexes toward key breakout levels. That’s because oil prices and their derivatives like gas often comprise the largest weighting in commodity indexes. The iShares S&P GSCI Commodity-Indexed Trust ETF (GSG) is trading right at the $23 area that has been a significant resistance level going back three years. A breakout could point to higher inflation levels ahead since commodities have the highest beta to rising inflation.
At a time when commodity prices might be starting a major uptrend phase, the energy sector looks historically undervalued compared to the rest of the market. The chart below shows the energy sector’s weighting in the S&P 500 going back a century. The energy sector’s weight in the S&P 500 stands at just 3%, which has been lower on just one other occasion. The energy sector also currently trades at a forward P/E ratio of 14.6x, which is the lowest of any sector in the S&P. The energy sector is extremely cyclical and faces headwinds from the shift away from fossil fuels. But near-term, rising energy prices (that boosts sales and earnings) coupled with signs of undervaluation could present trading opportunities in energy stocks and ETFs (trading plan will be posted for Hub members).

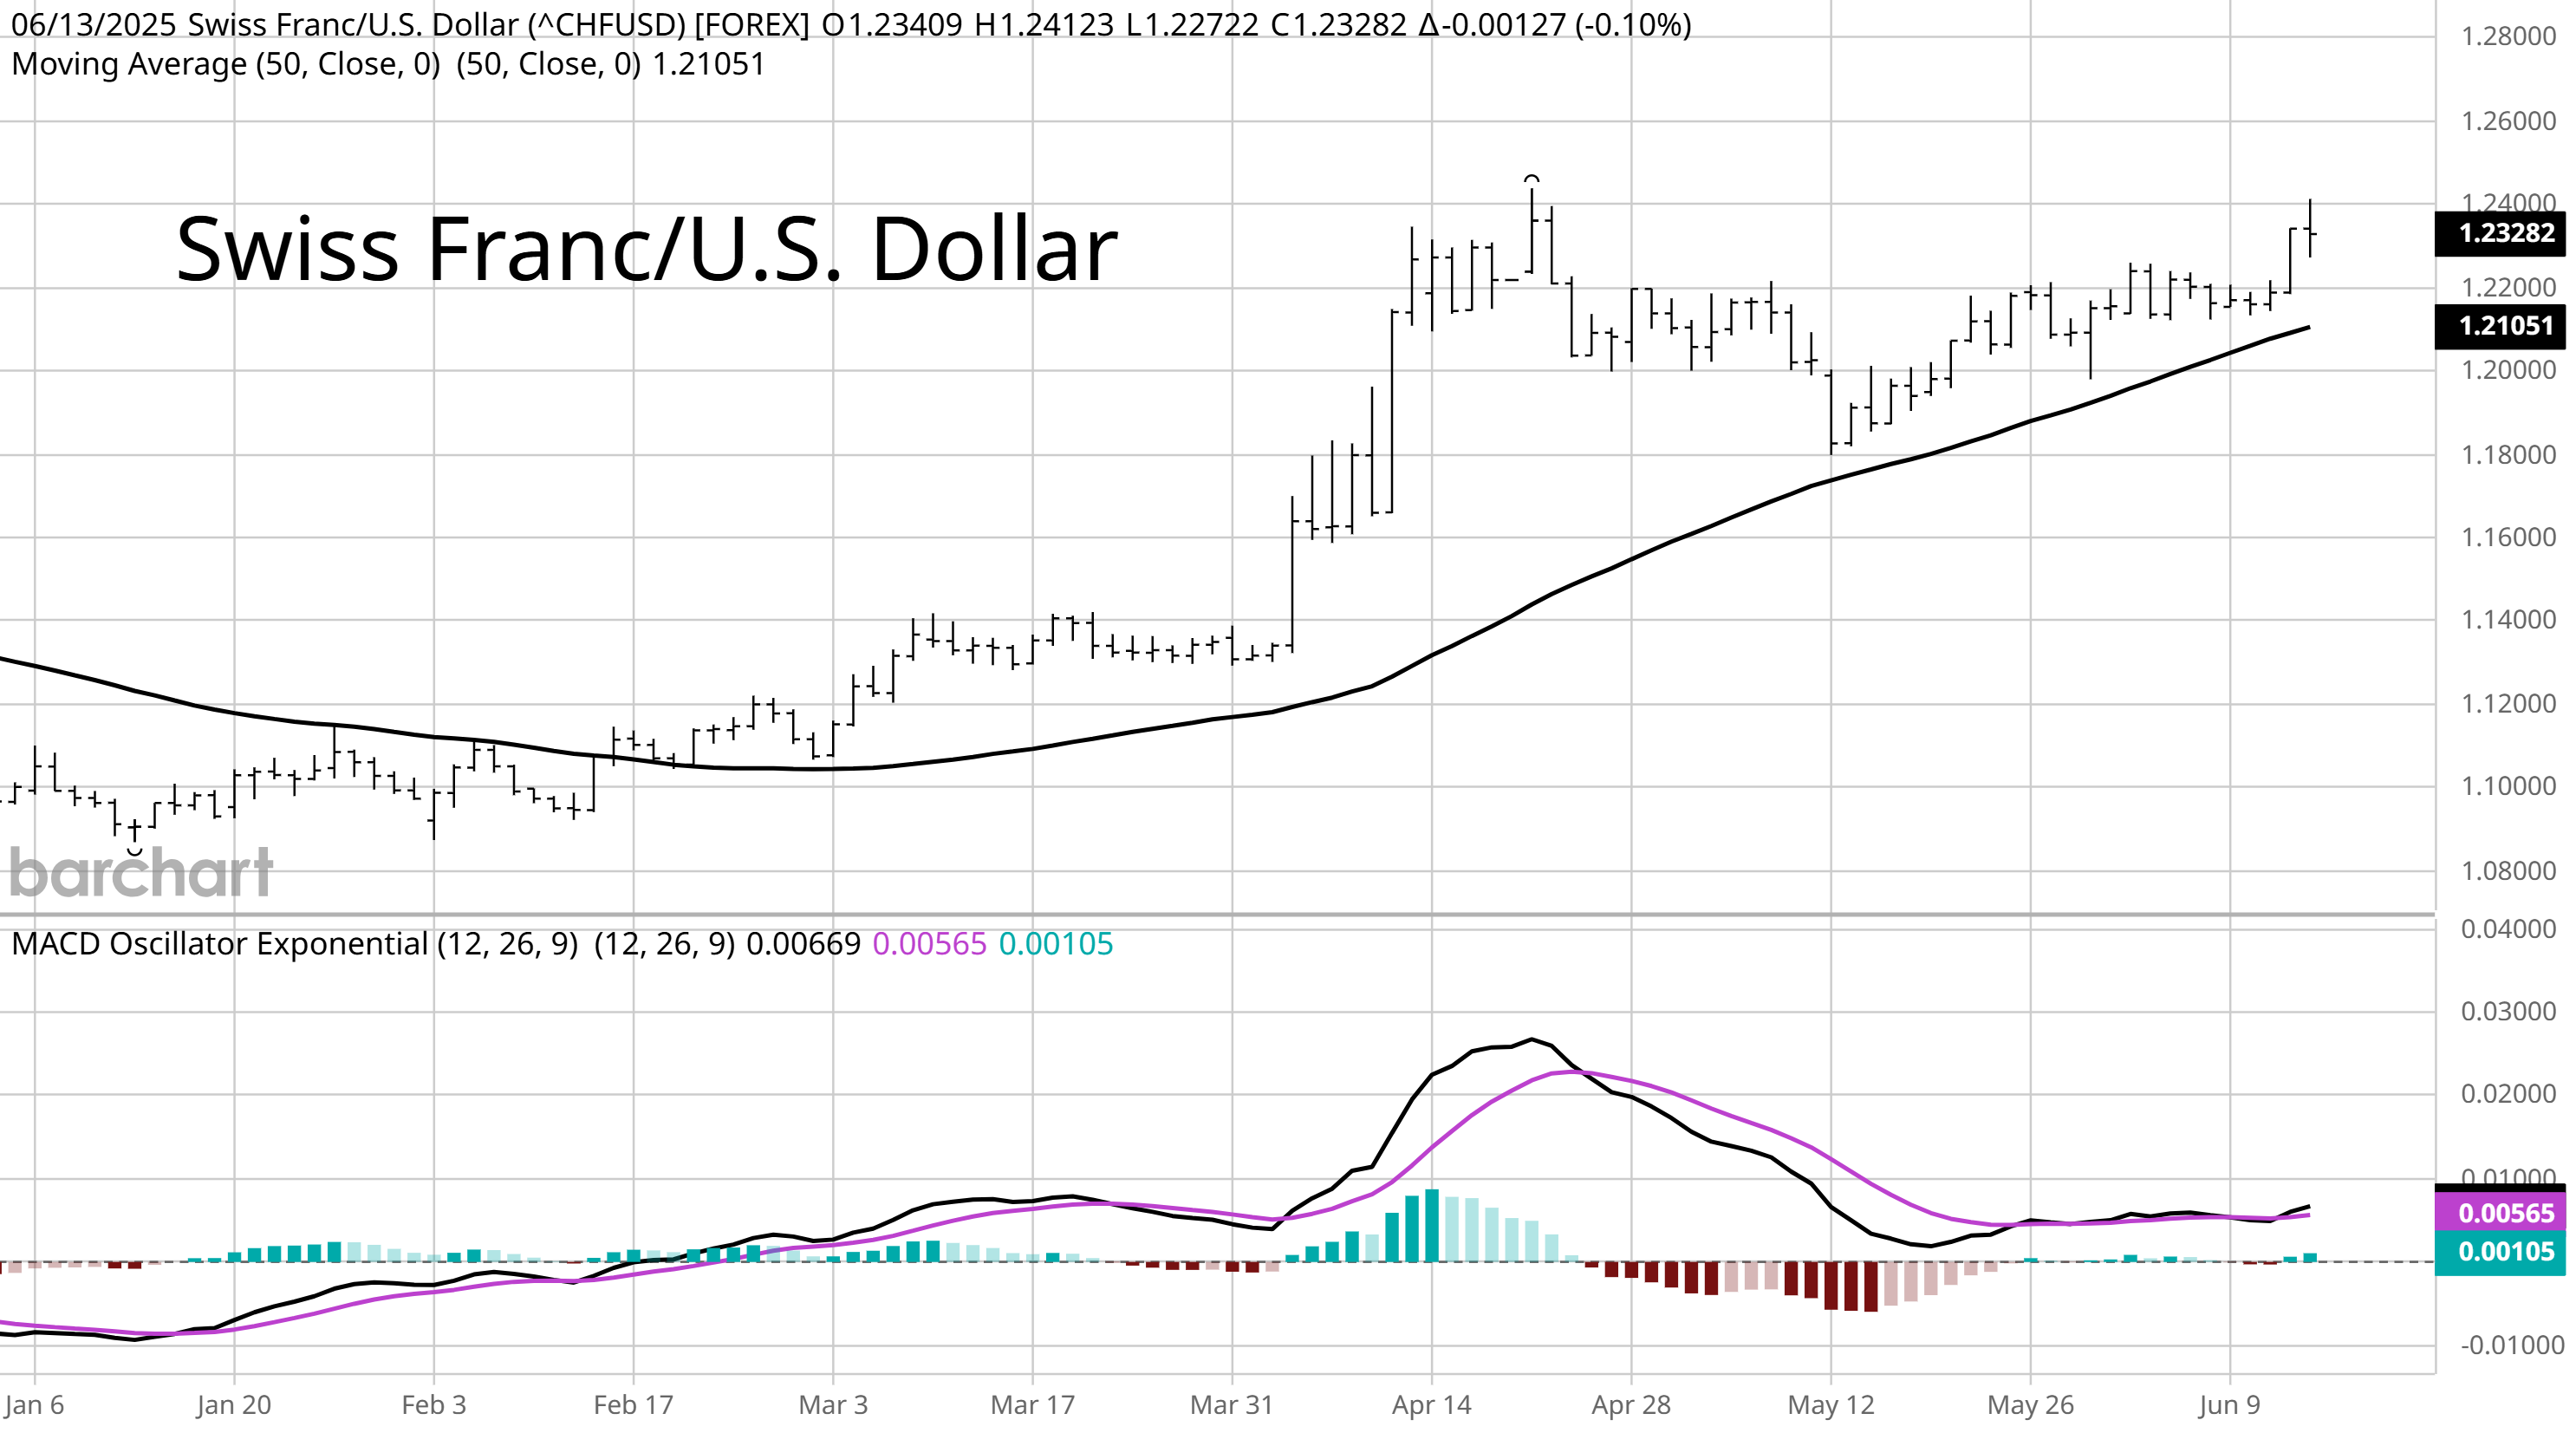
Rising geopolitical tensions in the Middle East are driving traditional “safe haven” assets higher. Last week, gold prices closed at a weekly record above the $3,400 level. And a safe haven currency is on the verge of a breakout, which is with the Swiss franc. The chart below shows the franc against the U.S. dollar (a rising line means the franc is strengthening). The franc is close to moving above the 1.24 level, which would put it at the highest level in 14 years.
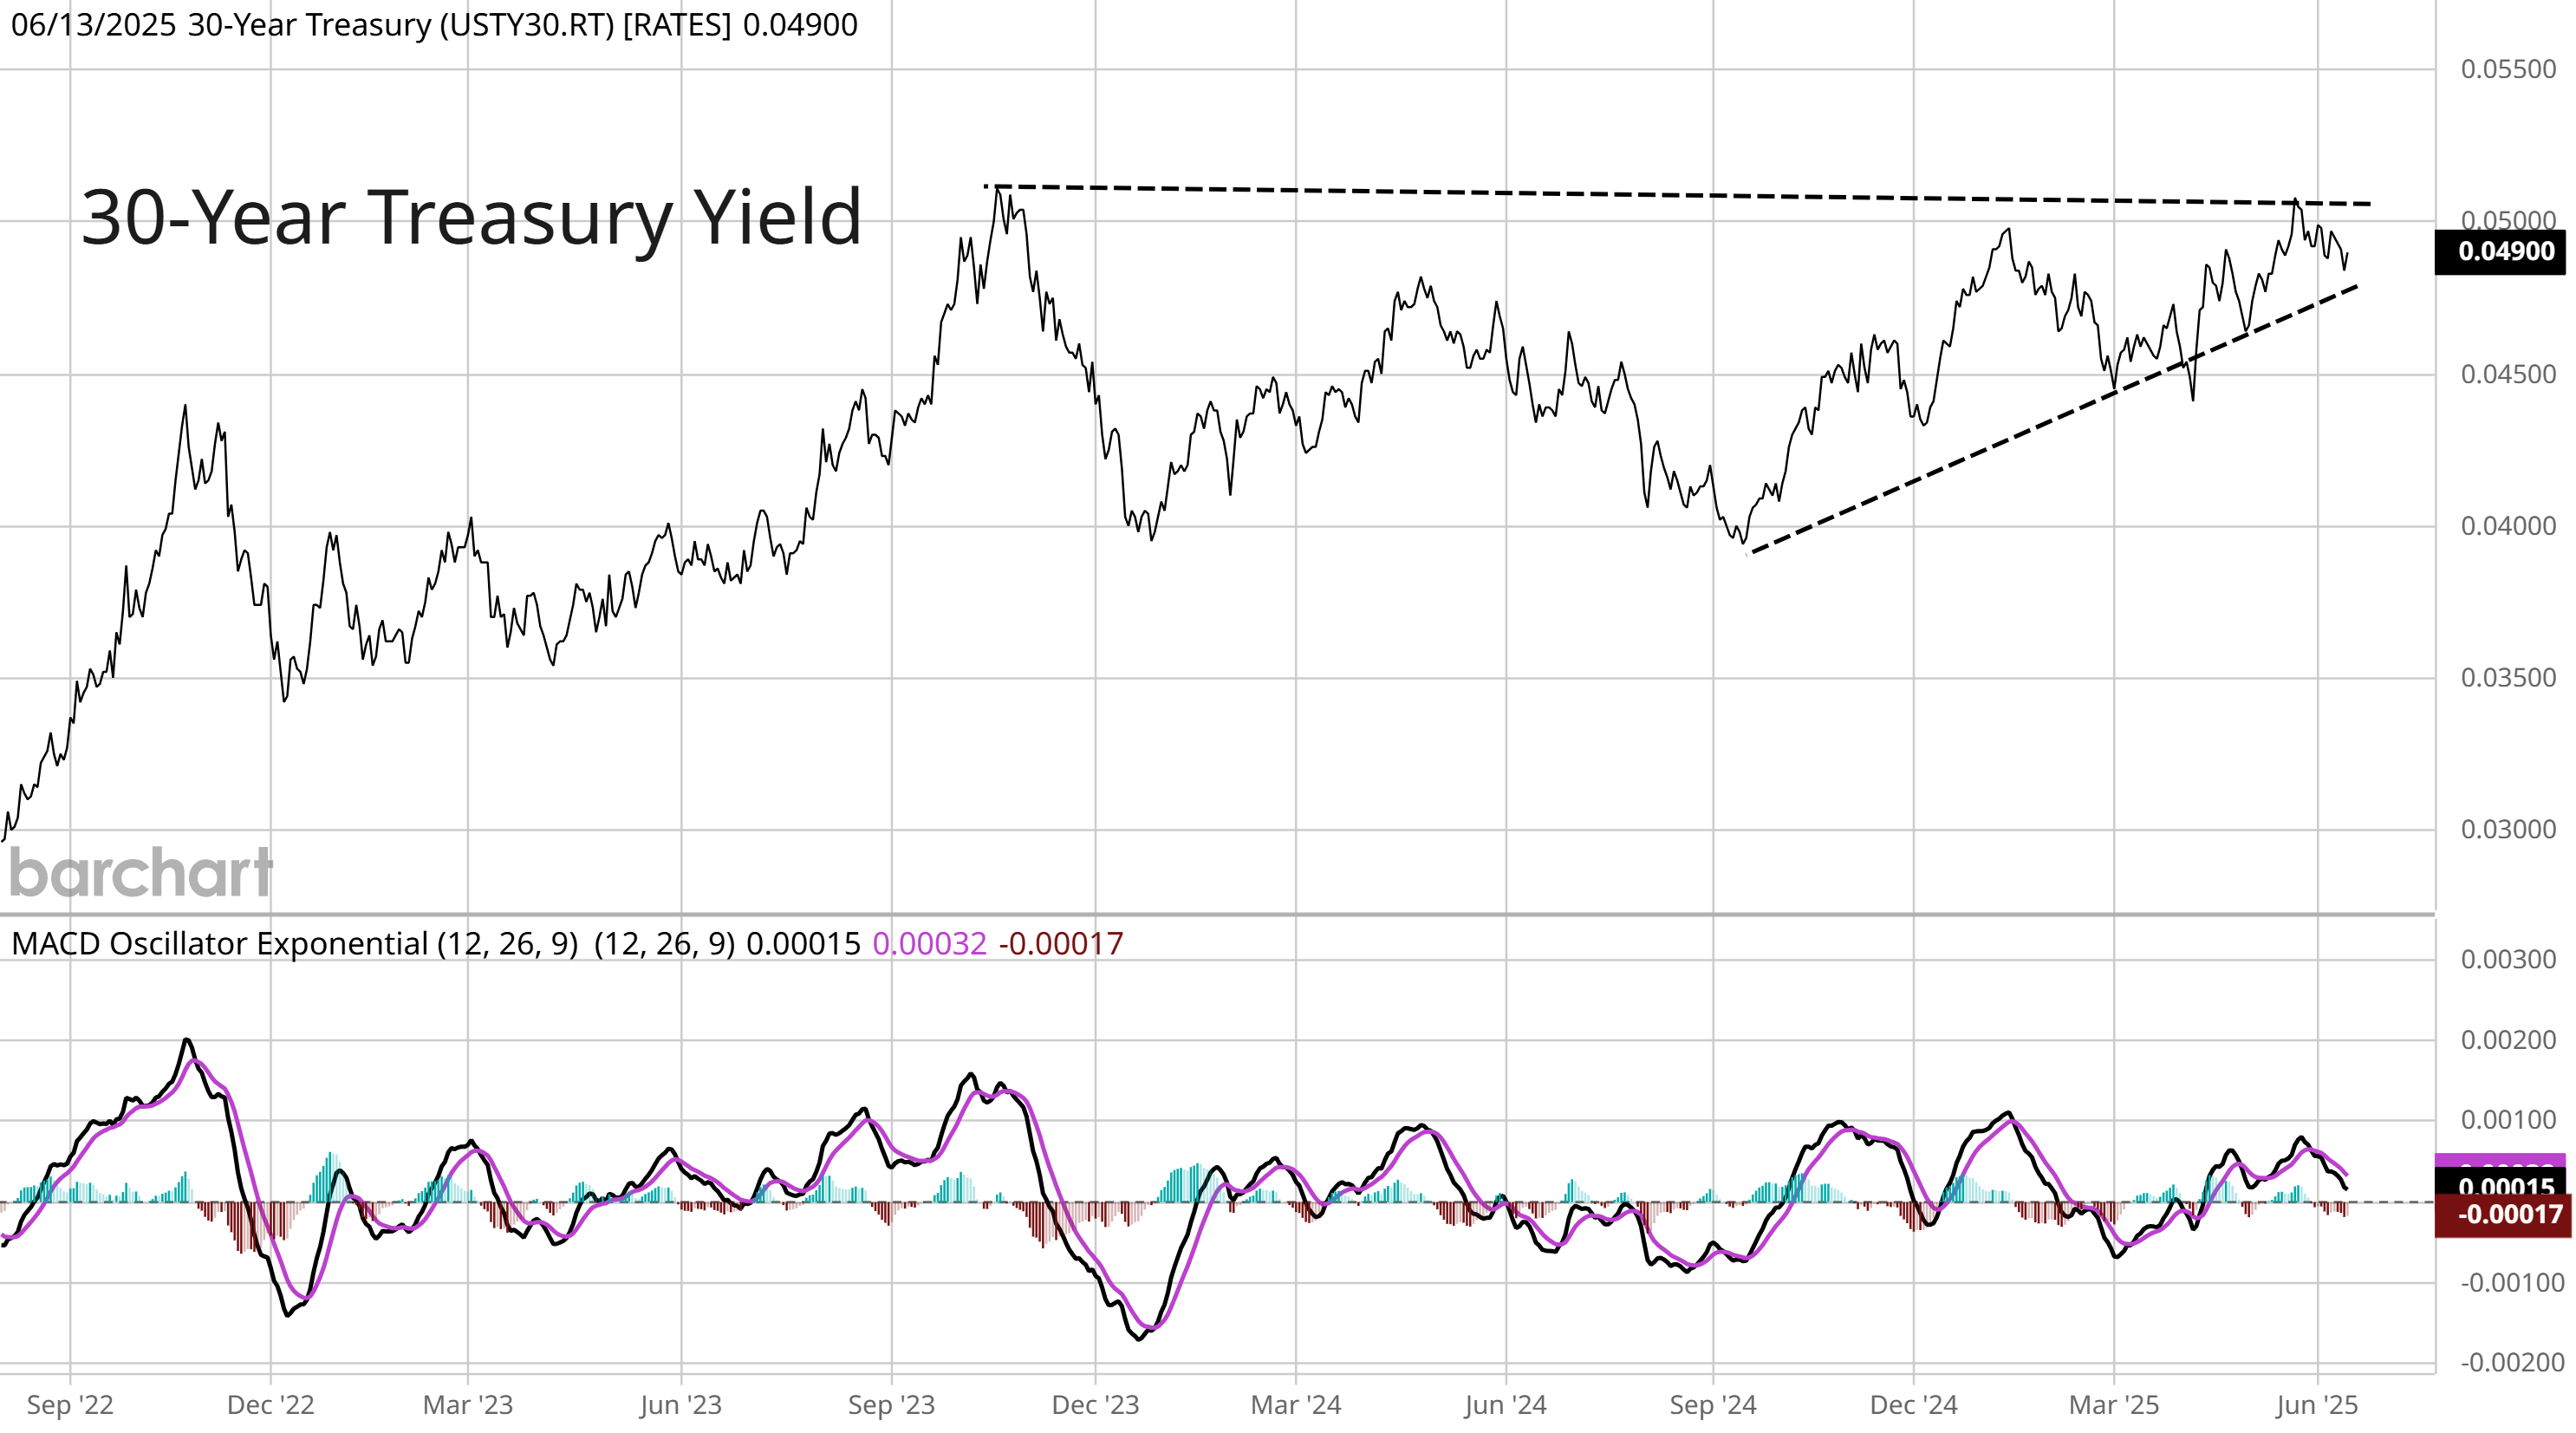
While U.S. Treasury securities also have a reputation as a safe haven asset, the inflation outlook could pressure long-term bond prices and send yields higher. During periods of rising inflation, the 10-year Treasury bond is one of the worst performing assets. That makes the pattern in the 30-year Treasury yield worth monitoring. The 30-year is making an ascending triangle pattern with resistance at the 5.0% level. The 30-year yield is making a smaller pullback off that level recently, keeping the uptrend since last September intact. A breakout over the 5.0% level would be another signal that markets are pricing inflation headwinds.
Over the short-term, the S&P 500 is entering one of the weakest two-week seasonal stretches for the year. The chart below shows the median two-week return for the S&P 500 going back to 1950. There’s only four periods that experience median negative returns, and the second half of June ranks near the worst. That’s interesting to note given the recent short-term breadth divergences that I’ve highlighted, along with worsening conflicts in the Middle East. You should also keep in mind that a poor June second half gives way to the best performing periods of the year, which is the first two weeks of July.

Heard in the Hub
The Traders Hub features live trade alerts, market update videos, and other educational content for members.
Here’s a quick recap of recent alerts, market updates, and educational posts:
Adding a new position with leverage to the nuclear theme.
Tracking volatility levels and how that’s influencing stock prices.
How the hard versus soft economic data are telling a different story.
The setup in Rocket Lab (RKLB) and what it says about investor sentiment.
You can follow everything we’re trading and tracking by becoming a member of the Traders Hub.
By becoming a member, you will unlock all market updates and trade alerts reserved exclusively for members.
👉You can click here to join now👈
Trade Idea
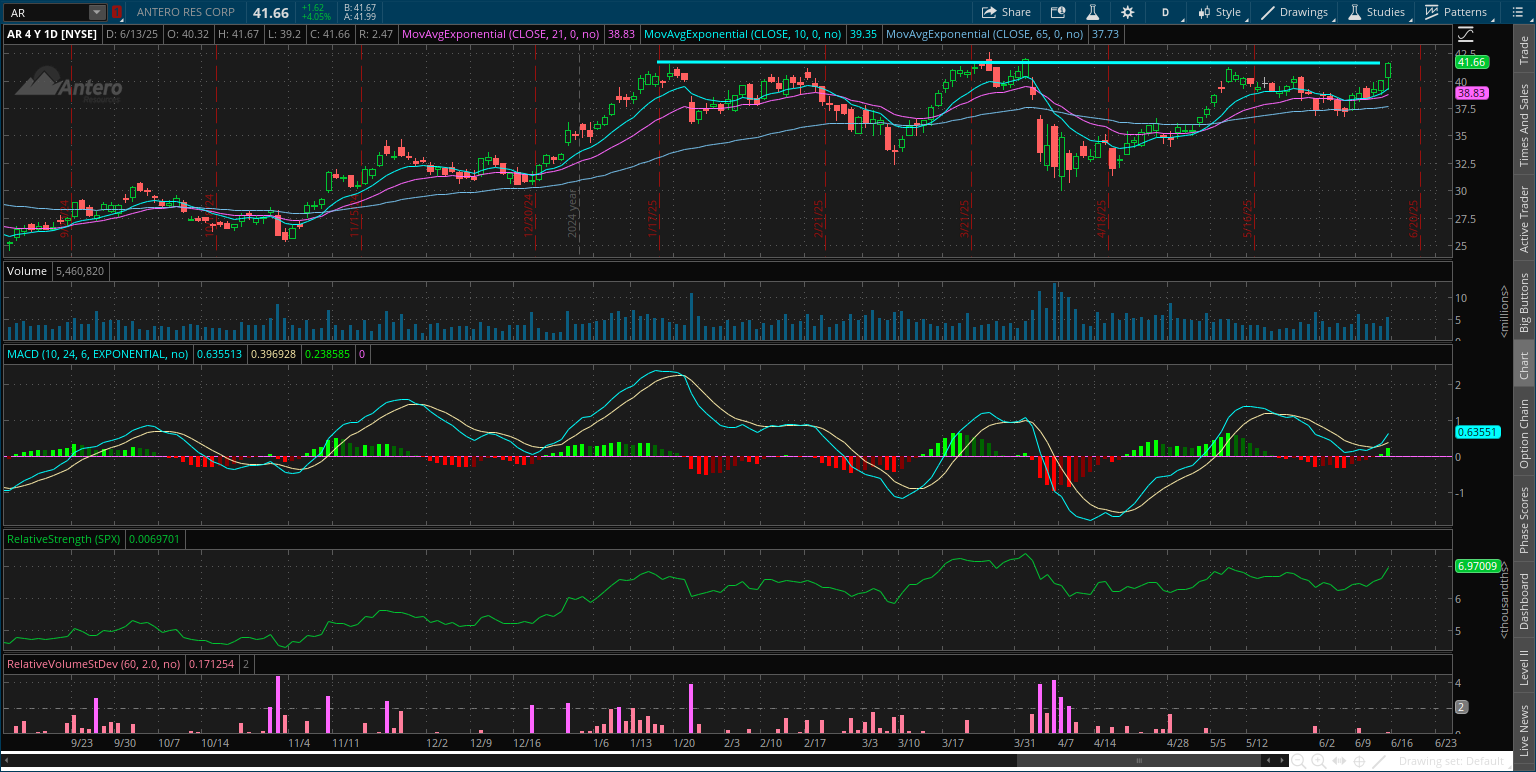
Antero Resources (AR)
The stock peaked around the $42 level back in January and started a new consolidation. AR is forming the right side of the base with a smaller pullback after testing $42 again in May. I’m watching for a breakout over $42 as the MACD rises from the zero line.
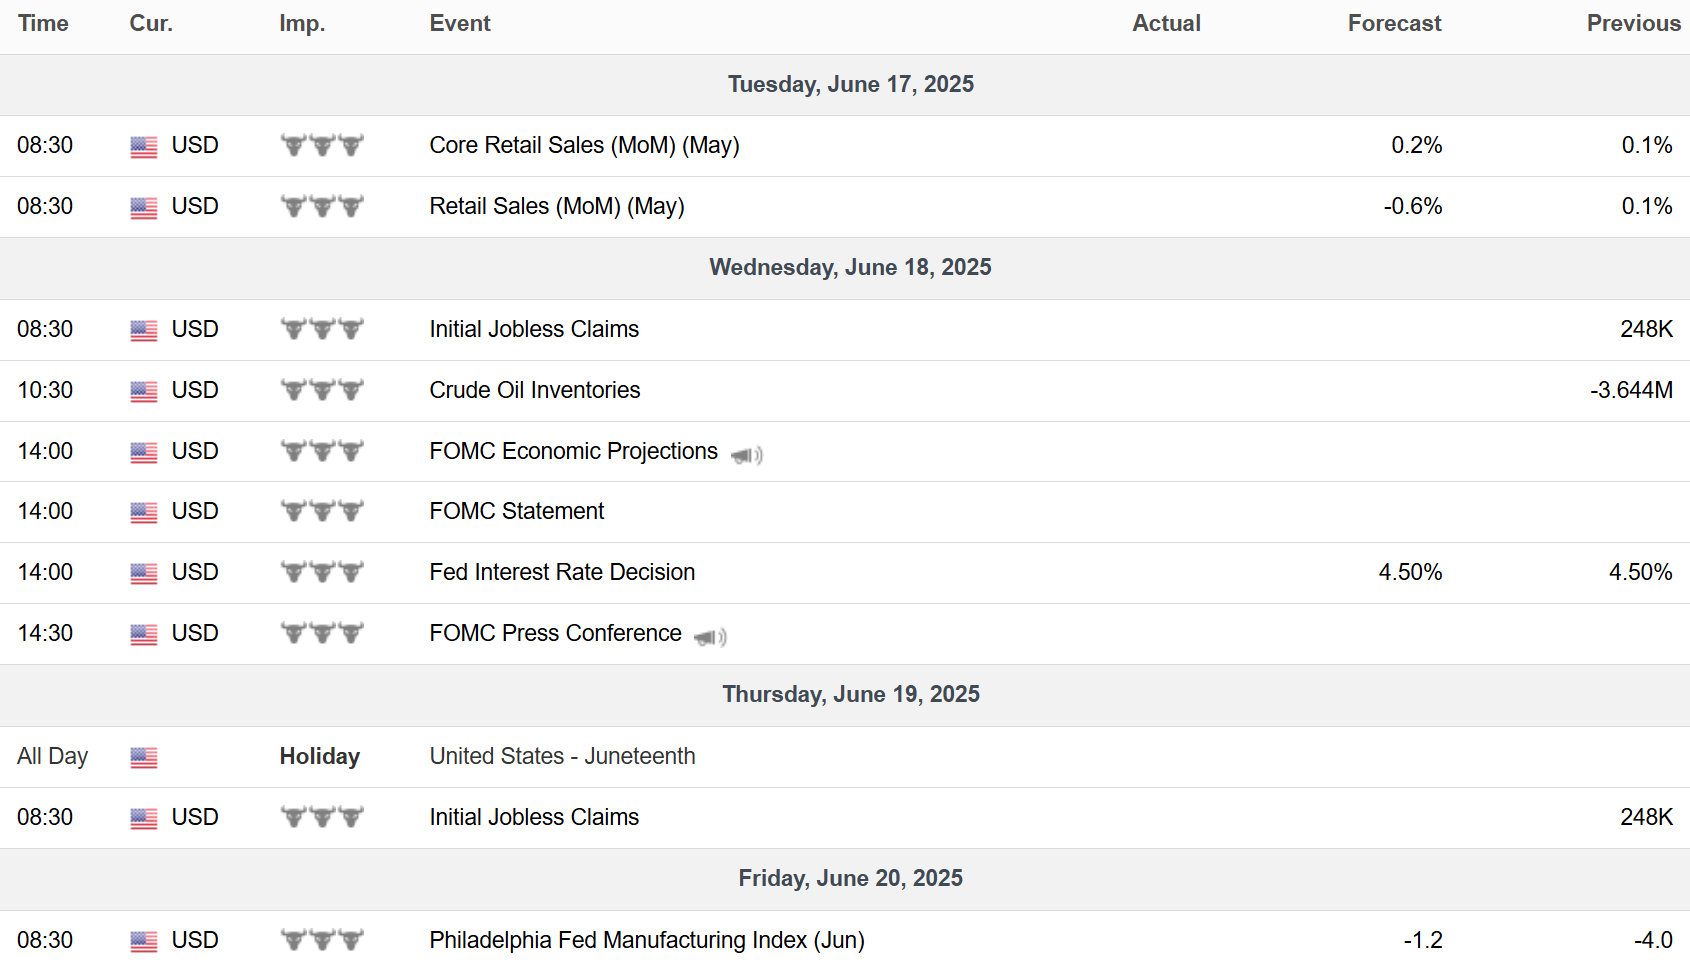
Key Upcoming Data
Economic Reports
Earnings Releases

I hope you’ve enjoyed The Market Mosaic, and please share this report with your family, friends, coworkers…or anyone that would benefit from an objective look at the stock market.
Become a member of the Traders Hub to unlock access to:
✅Model Portfolio
✅Members Only Chat
✅Trade Ideas & Live Alerts
✅Mosaic Vision Market Updates + More
Our model portfolio is built using a “core and explore” approach, including a Stock Trading Portfolio and ETF Investment Portfolio.
Come join us over at the Hub as we seek to capitalize on stocks and ETFs that are breaking out!
And if you have any questions or feedback, feel free to shoot me an email at mosaicassetco@gmail.com
Disclaimer: these are not recommendations and just my thoughts and opinions…do your own due diligence! I may hold a position in the securities mentioned in this report.