
The Market Mosaic 6.1.26
Inflationary Pressures Intensify Beyond the Energy Price Surge.

👋Welcome back to The Market Mosaic, where I gauge the stock market’s next move by looking at macro, technicals, and market internals. I’ll also highlight trade ideas using this analysis.
If you find this report helpful please hit that “like” button, share this post, and become a subscriber if you haven’t already done so!
🚨And be sure to check out Mosaic Traders Hub. It’s a members-only platform to alert trade ideas, track a model portfolio of open positions, and further analyze the message coming from the capital markets.
Now for this week’s issue…
While President Trump isn’t in a hurry to approve terms of a deal, hopes of a ceasefire between the U.S. and Iran could potentially see the strait of Hormuz reopened to tanker traffic.
The prospect of a return to normal in a key producing regions sent oil prices to their worst month since 2020 with an 20% decline (chart below). The drop in energy prices is also having spillover effects to rate markets.
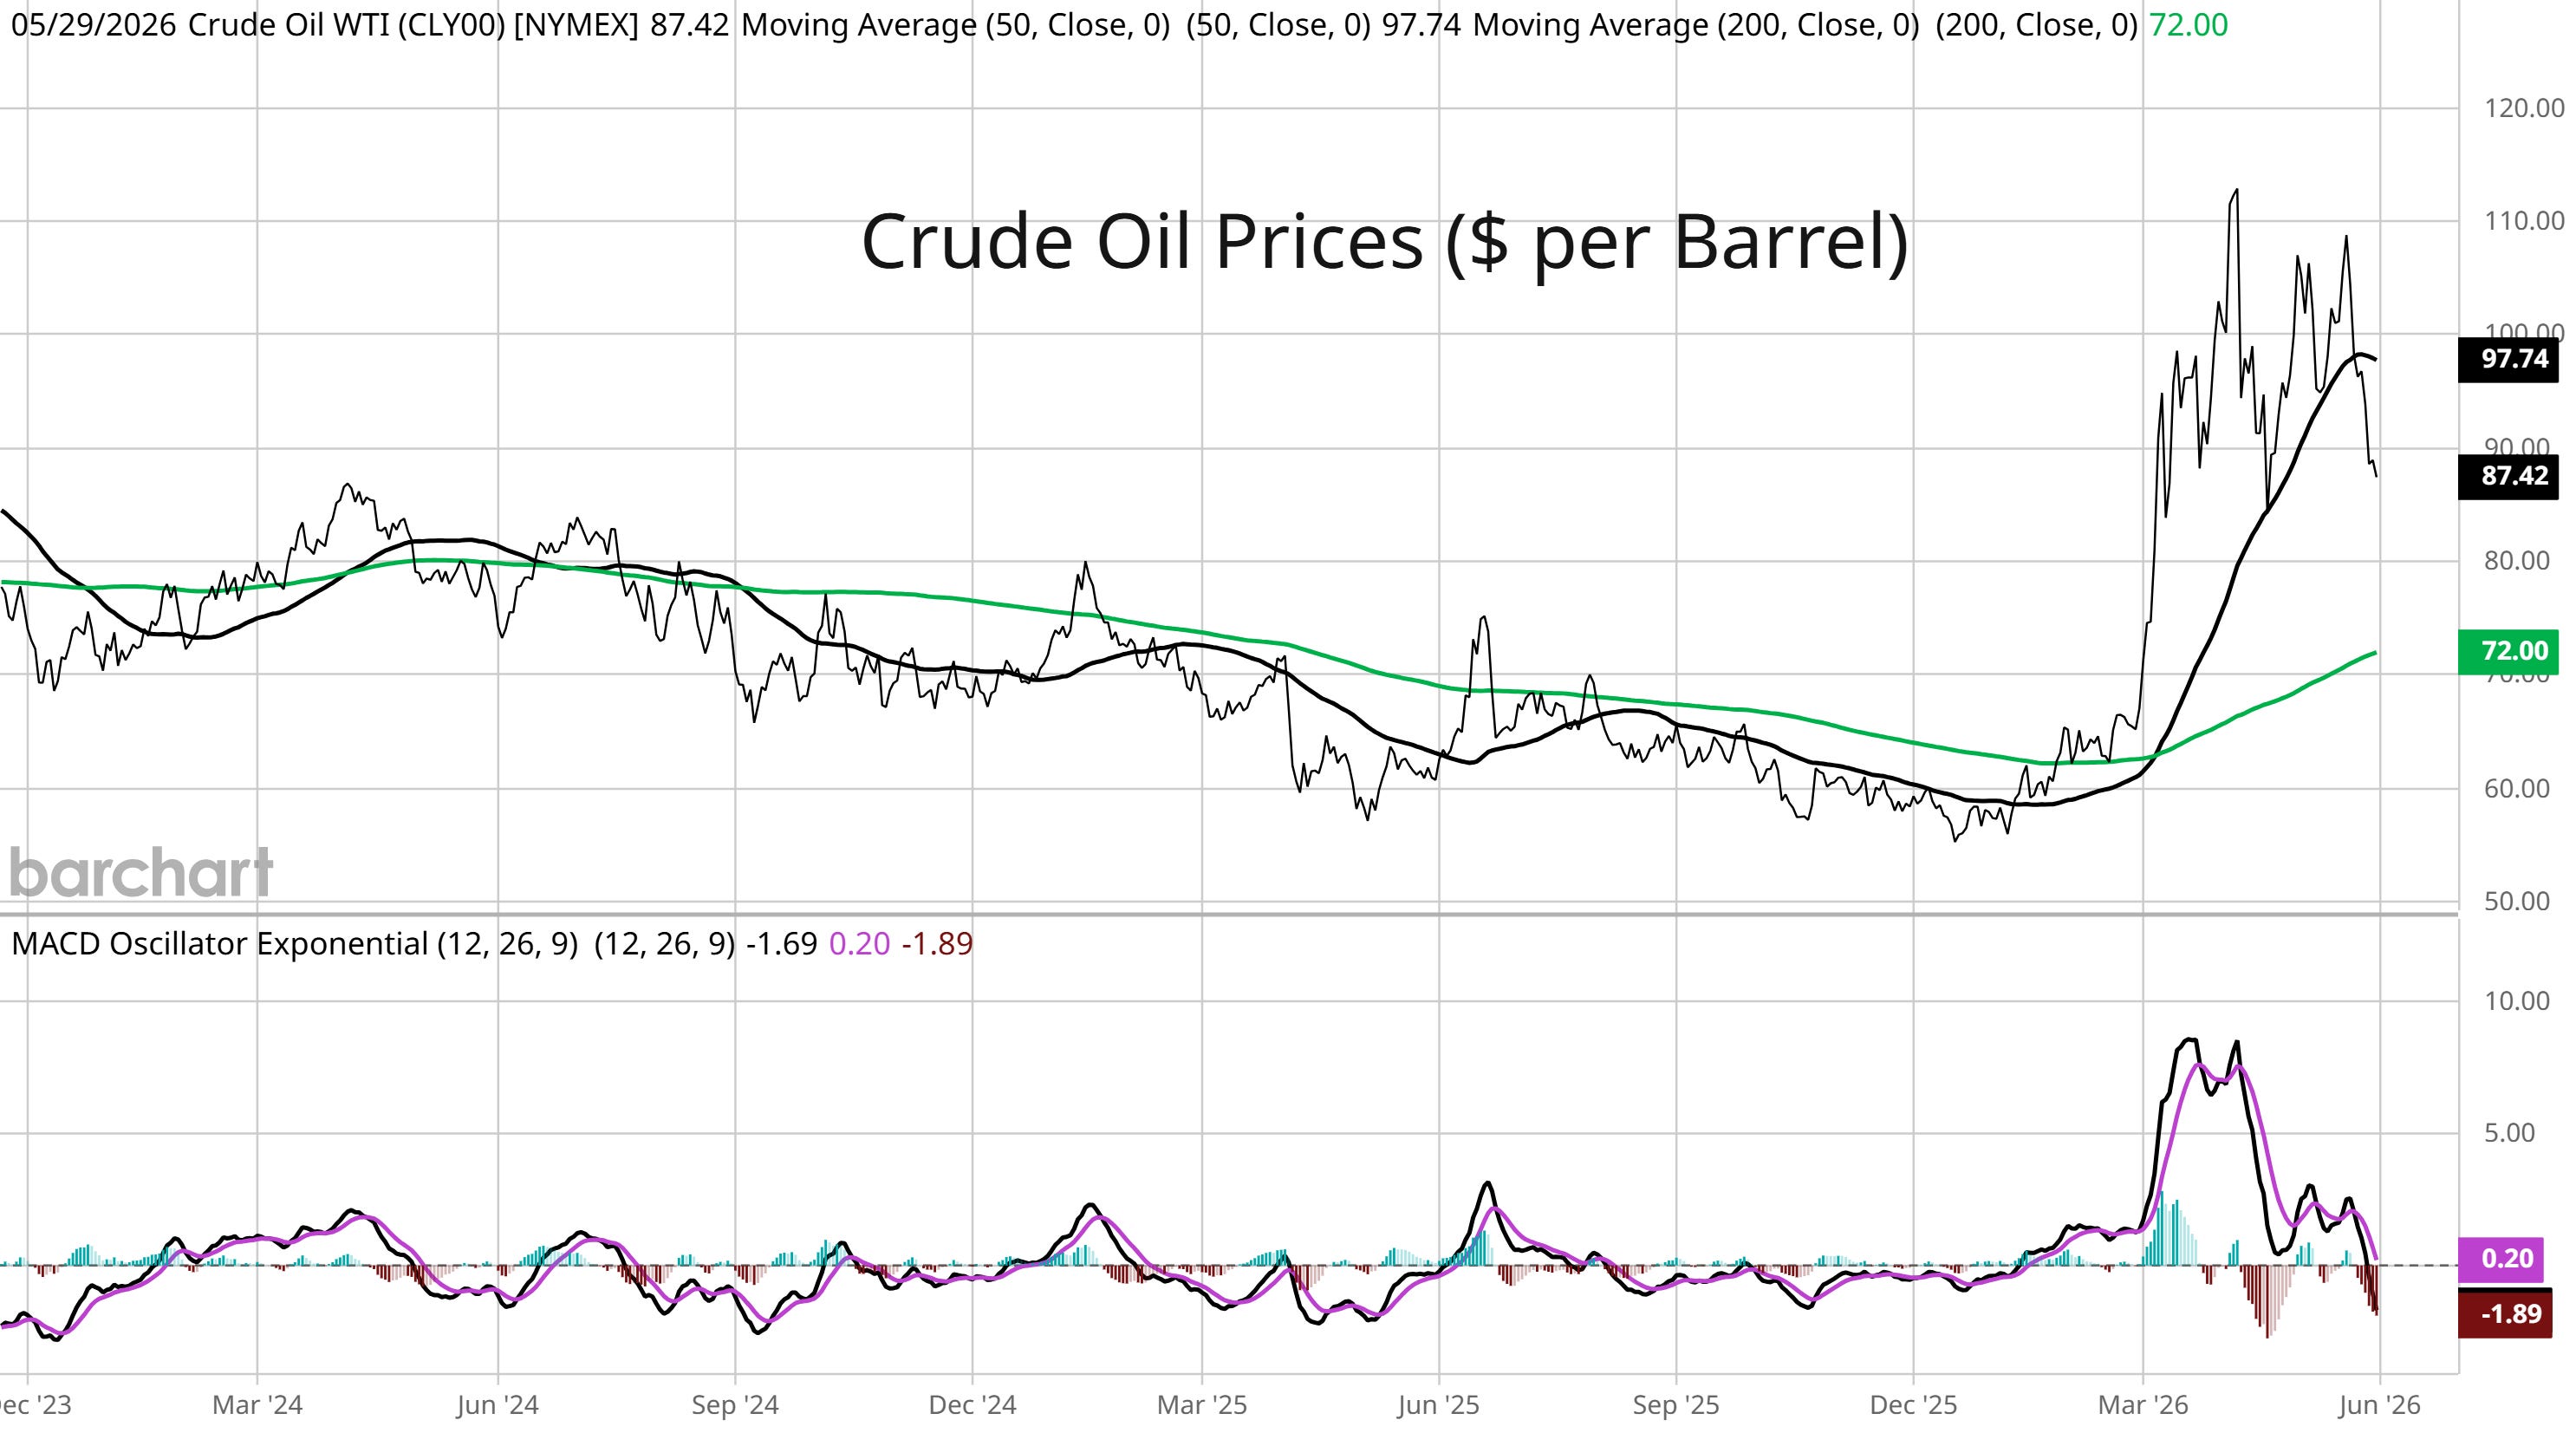
The 30-year treasury yield has pulled back below 5%, making the recent move look like a false breakout. The pullback in oil and interest rates is helping drive the S&P 500 to new heights.
But the most recent report on the Fed’s preferred inflation gauge contains a warning. Within the the Personal Consumption Expenditures (PCE) price index for April, the core goods figure that excludes food and energy rose by 2.8% and is one of the biggest increases in decades outside of the pandemic aftermath.
That shows underlying inflation has been a growing issue even before the spike in energy prices, and likely reflects supply chain upheaval from last year’s trade war. That’s keeping the outlook for monetary policy in question.
At the same time, inflation is pushing toward levels that have historically had a significant impact on stock market valuations, while market-implied inflation over the next 10 years is also hitting levels that have presented headwinds for the S&P 500.
This week, let’s look at inflation pressures stemming from more than just the jump in energy prices. We’ll also look at a couple ways that rising inflation could pressure stock prices and the key levels to watch, and why equity valuations are making stocks particularly vulnerable.
The Chart Report
The Federal Reserve’s preferred inflation gauge - the Personal Consumption Expenditures (PCE) price index - was released for the month of April. The headline figure jumped by 3.8% compared to last year while the core figure that excludes food and energy prices rose by 3.3%. For investors hoping that the boost in inflation could be temporary from the jump in energy prices, the report contained bad news. The core goods figure that excludes food and energy rose by 2.8% and is one of the biggest increases in decades outside of the pandemic aftermath (chart below). That shows underlying inflation has been a growing issue even before the spike in energy prices, and likely reflects supply chain upheaval from last year’s trade war.

The major stock indexes like the S&P 500 and Nasdaq continue grinding higher despite rising inflation and the impact on interest rates across the yield curve and outlook for monetary policy. But market-based inflation expectations and the impact on interest rates is nearing levels that have posed issues for stock prices in the past. The chart below plots the S&P 500 (black line) along with the 10-year inflation breakeven rate (orange line). A push toward the 2.5% level on the 10-year inflation breakeven has pressured the S&P 500 over the past few years, and is nearing that level once again.

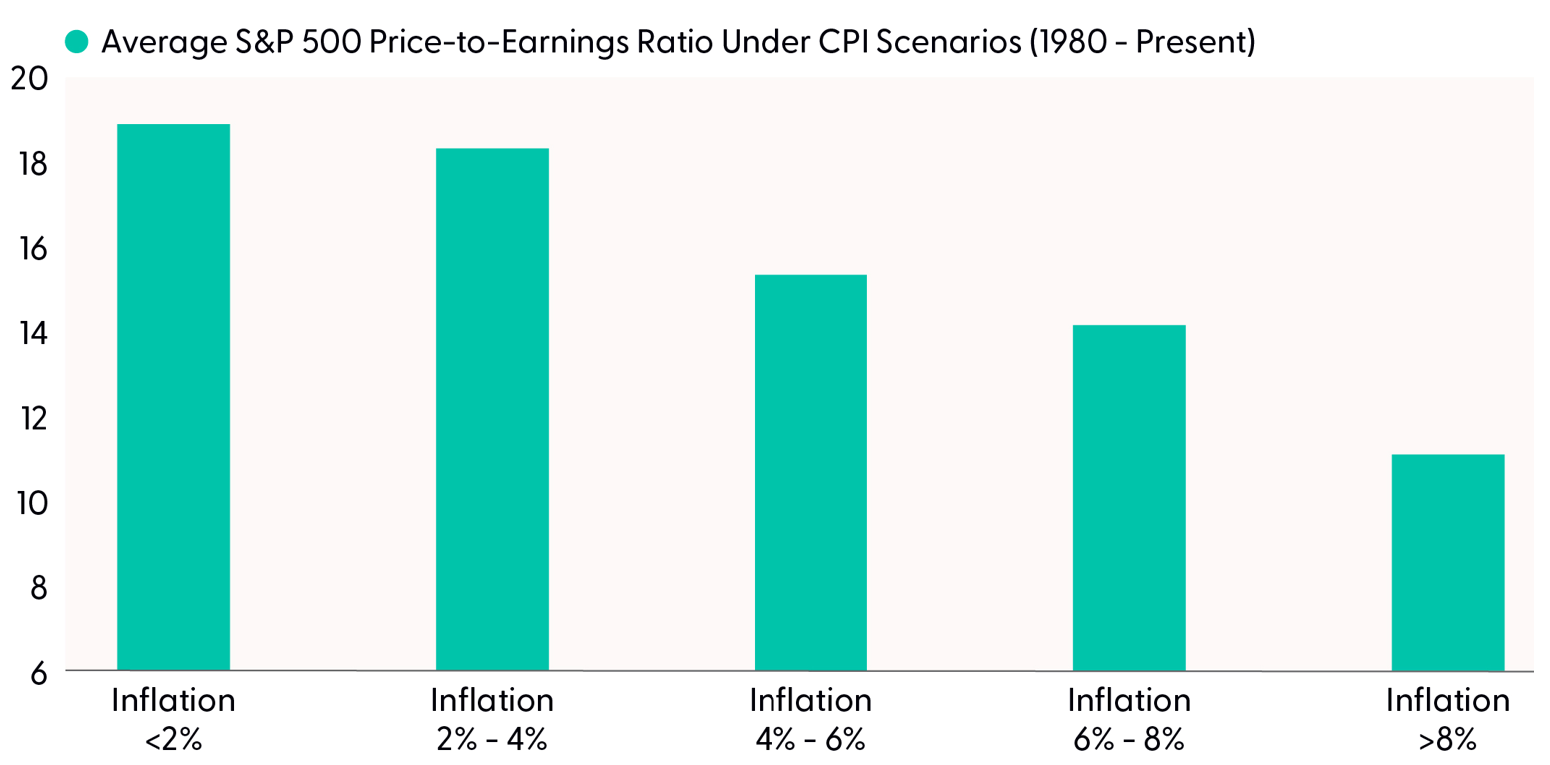
If inflation keeps accelerating further in the months ahead, that could add significant pressure to stock valuations. High inflation tends to lead to high interest rates, which makes the present value of future corporate profits worth less in present value terms. The chart below shows the average S&P 500 P/E ratio under different inflation regimes going back to 1980. You can see that average valuations start taking a big hit as inflation moves above 4%. With headline consumer inflation running over 3%, potential acceleration in the months ahead could have a major impact on valuations.
Rising inflation impacts equity valuations through the impact on interest rates. Higher rates present competition for investor capital and also decreases the present value of future expected corporate profits. Stocks could be especially vulnerable to rising rates as some measures of valuations are near the most expensive levels ever seen. That includes the S&P 500’s cyclically adjusted price-to-earnings ratio (CAPE). The CAPE ratio compares the current level of the S&P to a 10-year average of earnings to smooth out the business cycle. The CAPE ratio currently stands at 42.5 and has only been higher during the internet bubble in the late 1990s.

Heard in the Hub
The Traders Hub features live trade alerts, market update videos, and other educational content for members.
Here’s a quick recap of recent alerts, market updates, and educational posts:
Investor positioning shows there’s room to run.
Valuations compressing as earnings growth surges.
Breadth and investor sentiment supporting recent gains.
A jump in earnings is another warning on the rate outlook.
A pharmaceutical stock trading tight in a base-on-base setup.
You can follow everything we’re trading and tracking by becoming a member of the Traders Hub.
By becoming a member, you will unlock all market updates and trade alerts reserved exclusively for members.
Trade Idea
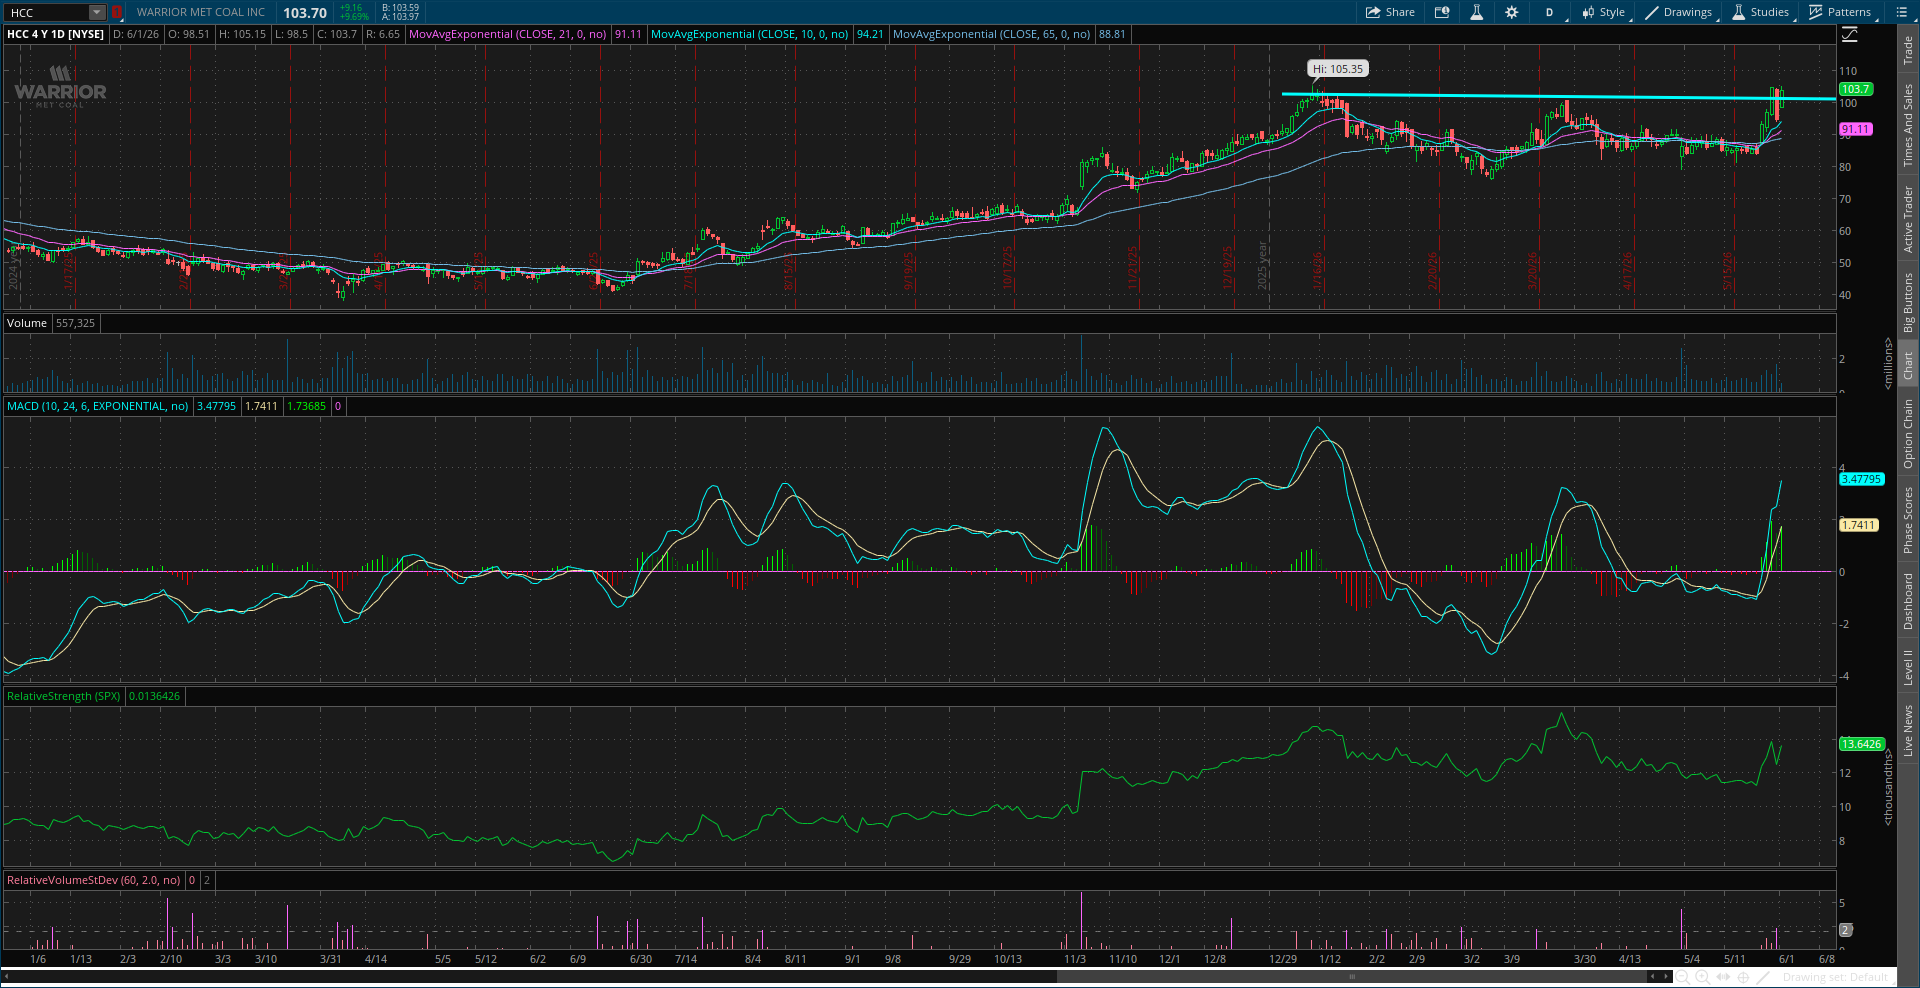
Warrior Met Coal (HCC)
Setting up a new base right at the important $100 level. The stock is making a smaller pullback following a rally to test resistance, which reset the MACD near the zero line. I’m watching for a move over $100.
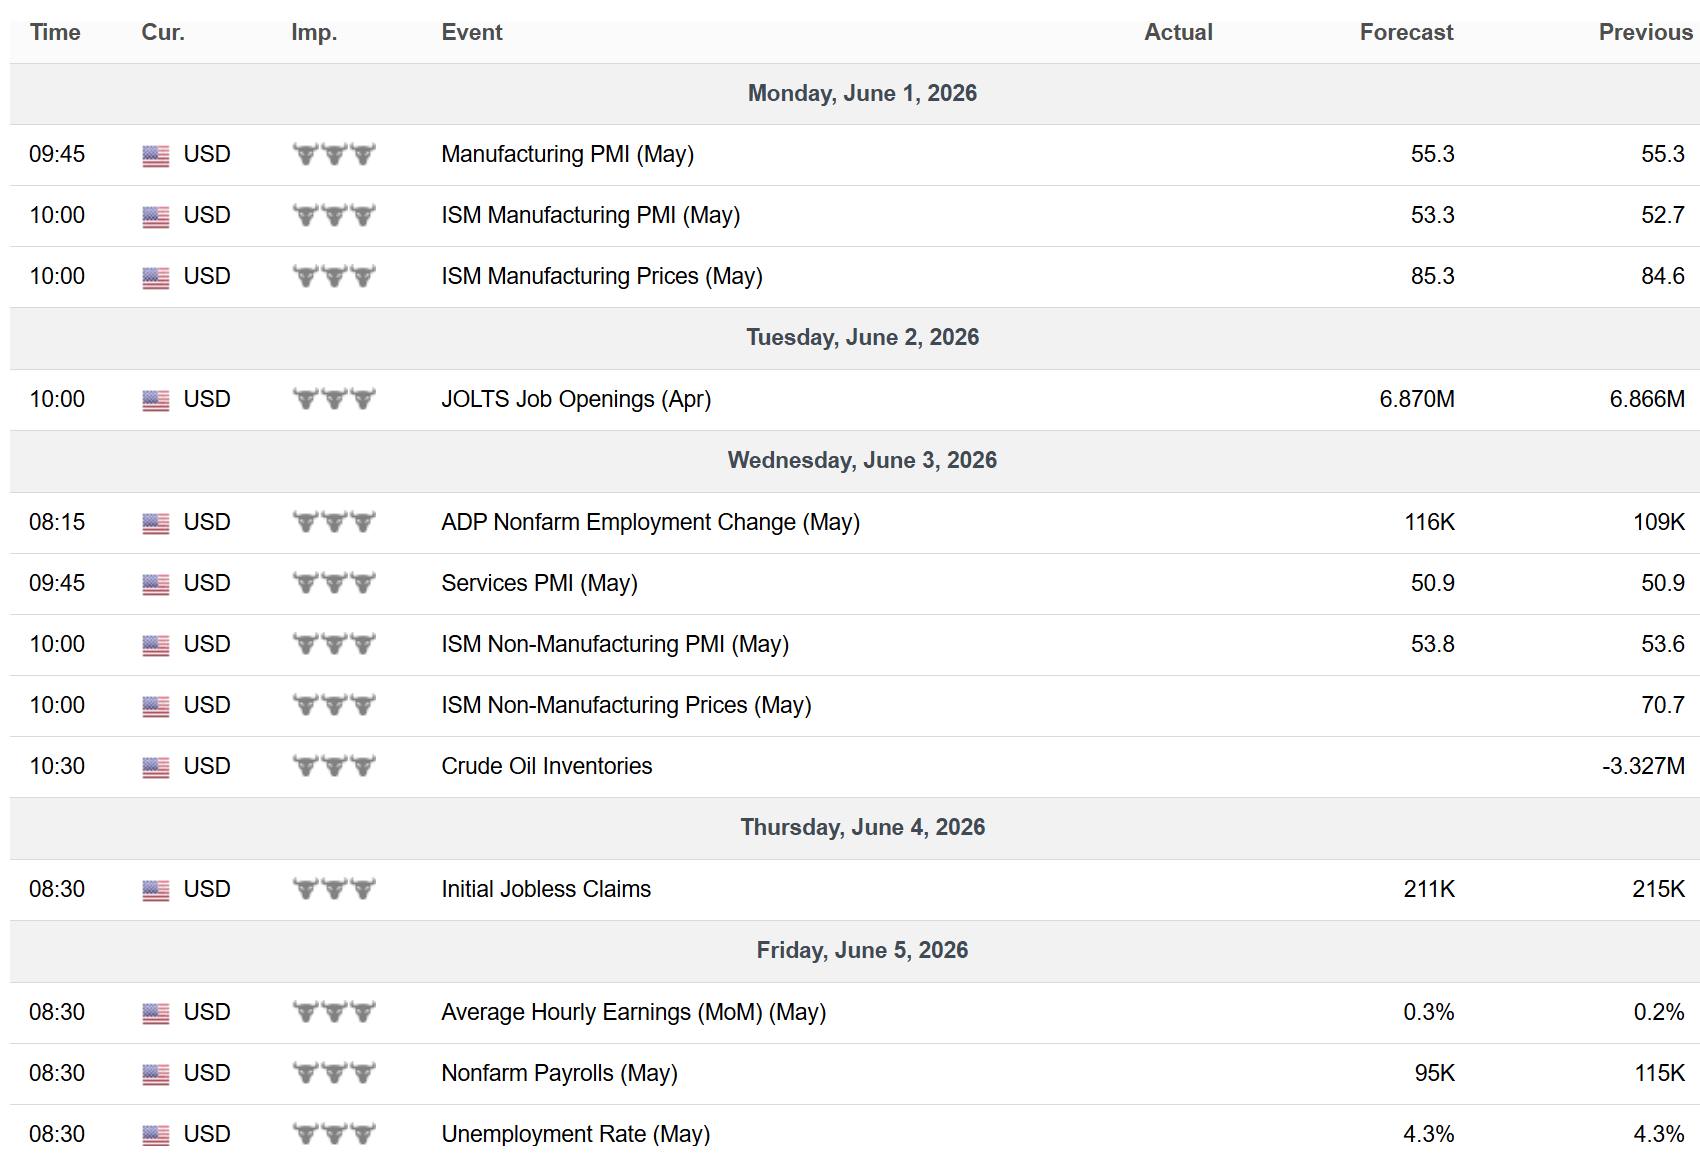
Key Upcoming Data
Economic Reports
Earnings Reports

I hope you’ve enjoyed The Market Mosaic, and please share this report with your family, friends, coworkers…or anyone that would benefit from an objective look at the stock market.
Become a member of the Traders Hub to unlock access to:
✅Model Portfolio
✅Members Only Chat
✅Trade Ideas & Live Alerts
✅Mosaic Vision Market Updates + More
Our model portfolio is built using a “core and explore” approach, including a Stock Trading Portfolio and ETF Investment Portfolio.
Come join us over at the Hub as we seek to capitalize on stocks and ETFs that are breaking out!
And if you have any questions or feedback, feel free to shoot me an email at mosaicassetco@gmail.com
Disclaimer: these are not recommendations and just my thoughts and opinions…do your own due diligence! I may hold a position in the securities mentioned in this report.