
The Market Mosaic 6.1.25
S&P 500: Bearish bets could add more fuel to the rally.

👋Welcome back to The Market Mosaic, where I gauge the stock market’s next move by looking at macro, technicals, and market internals. I’ll also highlight trade ideas using this analysis.
If you find this report helpful please hit that “like” button, share this post, and become a subscriber if you haven’t already done so!
🚨And be sure to check out Mosaic Traders Hub. It’s a members-only platform to alert trade ideas, track a model portfolio of open positions, and further analyze the message coming from the capital markets.
Now for this week’s issue…
The month of May is supposed to mark the start of the “sell in May and go away” period of seasonal weakness.
Instead, the S&P 500 delivered its best return for the month in 25 years (chart below). The index gained 6.3% for the month, which means the S&P is now up 18% from the early April lows.

More uncertainty around tariffs and trade war headlines marked the start of the week. President Trump threatened a 50% tariff on the European Union to start on June 1, which was subsequently delayed until next month.
While a feared effect of the trade war is higher inflation down the road, the most recent report on consumer inflation from the Personal Consumption Expenditures (PCE) Price Index is providing some relief.
The headline PCE figure for the month of April came in at 2.1% compared to last year. The core figure that strips out food and energy prices was reported at 2.5%. Both measures were slightly below estimates, while the core figure was the smallest increase since March 2021 (chart below).

The moderating level of inflation means that the short-term fed funds interest rate is the highest above PCE since heading into the financial crisis in 2008. That might explain why Trump summoned Fed Chair Jerome Powell this week to pressure the central bank into cutting rates.
This week, let’s look at the factors driving the S&P 500’s continued rally off the April lows. We’ll also look at why the Fed remains reluctant to cut interest rates and why certain markets point to growing concerns over the U.S. fiscal situation.
The Chart Report
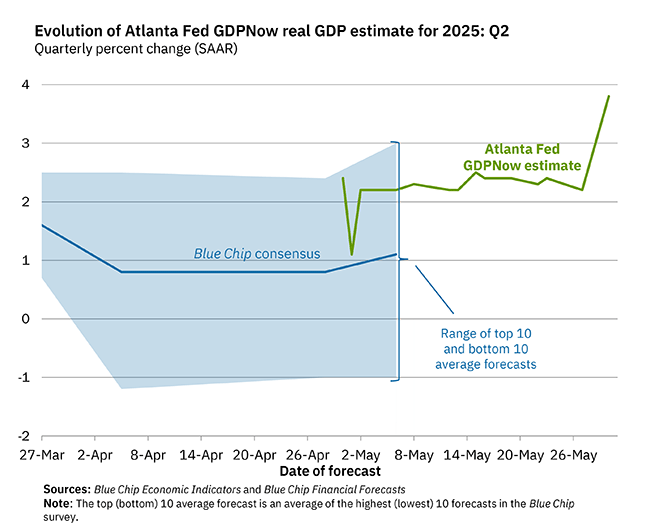
The pressure may be on the Fed to cut rates following the most recent PCE inflation report, but hard evidence of a solid economy means that the Fed can hold tight on rates for now. Jobless claims provide a real-time look at the labor market, and are hovering near historic lows. Real-time Fed district estimates of GDP growth is remaining stable or bouncing higher. The Fed’s New York district estimate of Q2 GDP has stayed in the mid-2% range since the end of February. And the Atlanta Fed’s closely followed GDPNow estimate is surging higher with Q2 GDP growth pegged at 3.8% (chart below). That’s being driven by a bounce back in net exports relative to the prior quarter.
Extremely bearish investor positioning coupled with a volatility trigger is boosting stocks off the April lows. Back then, volatility-targeting strategies had cut equity exposure to the lowest levels since the pandemic as the CBOE Volatility Index (VIX) surged higher. A sharp pullback in VIX helped drive buying activity among vol-targeting strategies. But as you can see in the chart below, positioning among various types of asset managers is still running at below normal levels. That means institutional demand for stocks should remain a bullish catalyst over the intermediate-term.

Various measures of investor sentiment have swung quickly from showing too much fear and bearishness in April to now suggesting elevated bullish moods and greed. CNN’s Fear and Greed Index is firmly in greed territory, which is a contrarian signal to be cautious on the outlook. But not all sentiment measures have shifted, including the Conference Board’s measure of CEO confidence. With the trade war clouding the outlook, CEO confidence is hovering near historic lows as you can see below. But that has historically been a contrarian indicator for the stock market, with past low levels occurring around major market bottoms in many instances.

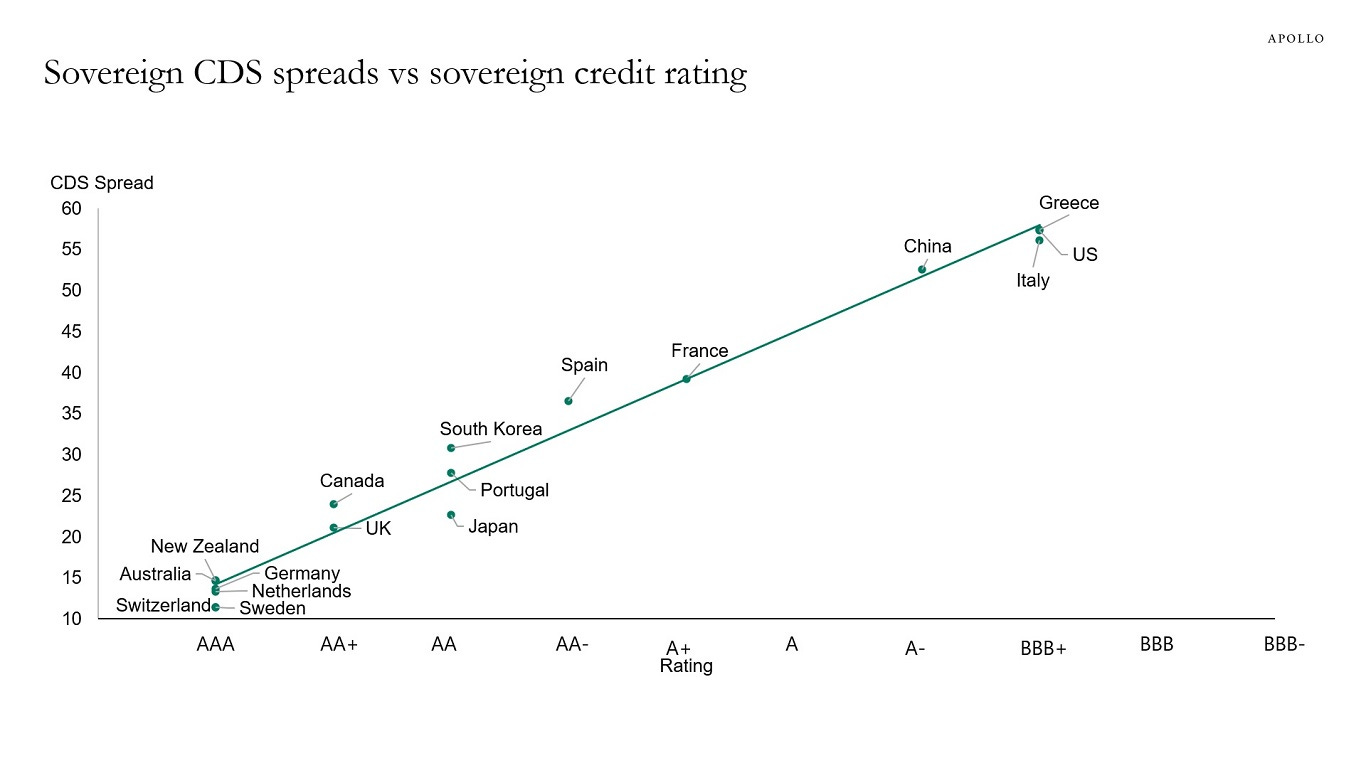
While the stock market is shrugging off fears over the economic impact of the trade war, warnings are showing up in other corners of the capital markets. At a time when the debt-to-GDP ratio is running around 120% along with continued deficit spending, markets are flashing signs of fiscal concerns. Longer-dated Treasury yields are close to breaking out with the 30-year Treasury trading just below the 5% level. At the same time, CDS spreads on U.S. government debt are moving higher. CDS spreads measure the cost to buy protection against default, with the U.S. spread trading at levels in line with Greece and Italy (chart below).
A breakdown in the U.S. Dollar Index (DXY) could also be highlighting concerns over a deteriorating fiscal situation in the U.S. After peaking in September 2022, DXY traded in a large range with key support at the 100 level. DXY broke below that level back in early April, then back tested that level as resistance including a test of the 50-day moving average (black line) as well. That’s also creating a bearish reset in the MACD below the zero line. If downside in DXY accelerates after losing the 100 level, that could also signal long-term concern over the outlook for U.S. economic growth and fiscal condition. That could serve as another bullish catalyst for precious metals and Bitcoin.

Heard in the Hub
The Traders Hub features live trade alerts, market update videos, and other educational content for members.
Here’s a quick recap of recent alerts, market updates, and educational posts:
Breakout setups developing in natural gas producers.
The “pick n’ shovel” plays of the AI data center buildout.
Why the level of federal interest payments poses a big problem.
More evidence of institutional activity following breadth thrusts.
Adding a new position in a stock with a textbook basing structure.
You can follow everything we’re trading and tracking by becoming a member of the Traders Hub.
By becoming a member, you will unlock all market updates and trade alerts reserved exclusively for members.
👉You can click here to join now👈
Trade Idea
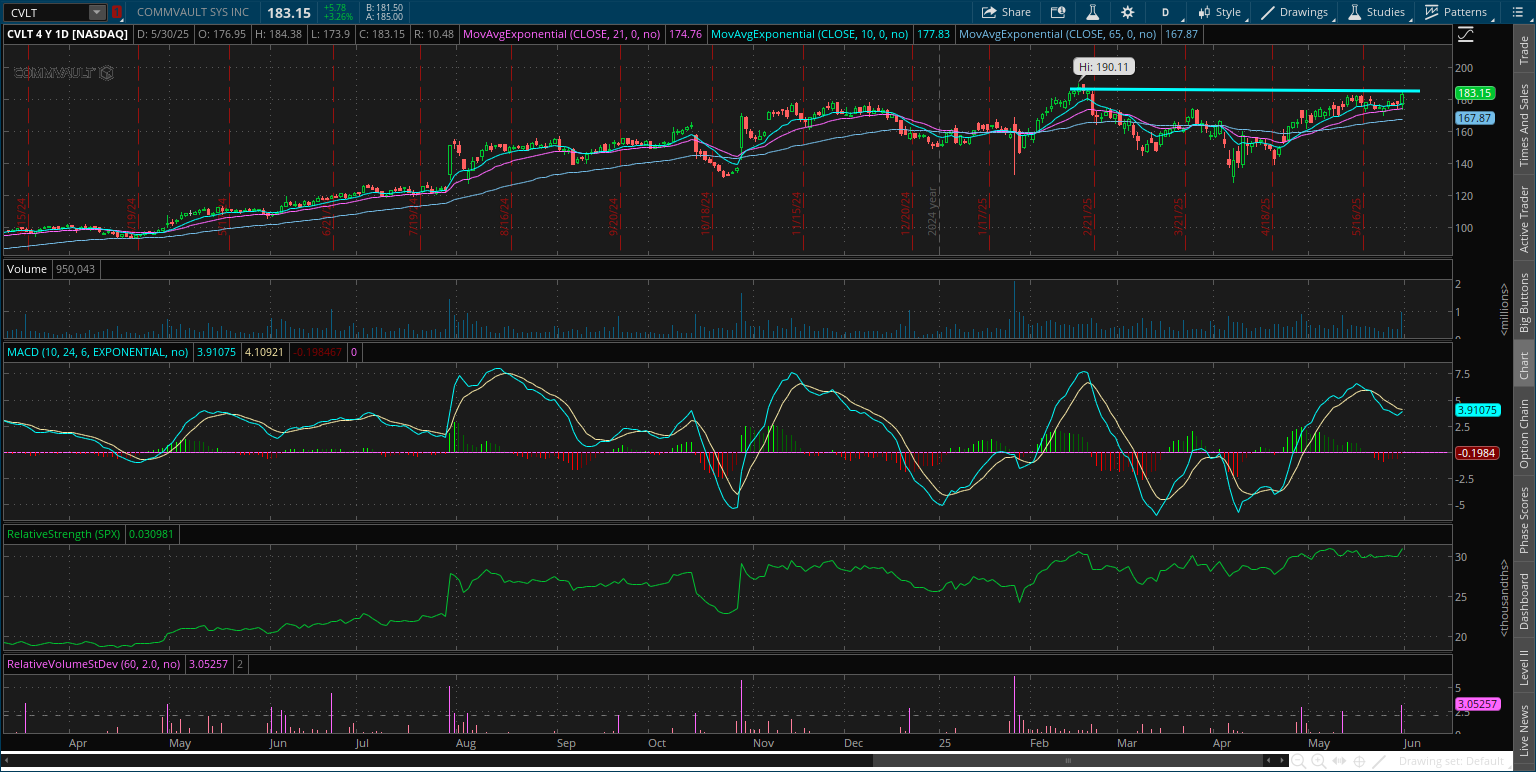
CommVault Systems (CVLT)
Trading in a wide basing structure since last November that’s starting to tighten up. The stock is making a smaller pullback off the $190 resistance level that’s trading in a tight range and resetting the MACD at zero. I’m now watching for a breakout over $190.
Key Upcoming Data
Economic Reports

Earnings Releases

I hope you’ve enjoyed The Market Mosaic, and please share this report with your family, friends, coworkers…or anyone that would benefit from an objective look at the stock market.
Become a member of the Traders Hub to unlock access to:
✅Model Portfolio
✅Members Only Chat
✅Trade Ideas & Live Alerts
✅Mosaic Vision Market Updates + More
Our model portfolio is built using a “core and explore” approach, including a Stock Trading Portfolio and ETF Investment Portfolio.
Come join us over at the Hub as we seek to capitalize on stocks and ETFs that are breaking out!
And if you have any questions or feedback, feel free to shoot me an email at mosaicassetco@gmail.com
Disclaimer: these are not recommendations and just my thoughts and opinions…do your own due diligence! I may hold a position in the securities mentioned in this report.
Good recap. Atlanta Fed bounce back over 3.5% GDP growth in line with some other indicators. ARK’s @trueinflation drops to 1.9% - under Fed’s silly 2% mental-not dual mandate line.
https://truflation.com/marketplace/us-inflation-rate
Does a lower dollar make US exports cheaper? Does this help tech stocks with the highest level of foreign exposure. If so, might we see more disparity between the market and large cap tech? I came across this ETF which I will start watching. SPXT. Thanks.