The Market Mosaic 6.12.22
Breakouts! But not the good kind...
Welcome back to The Market Mosaic, where I gauge the stock market’s next move by looking at trends, market internals, and the mood of the crowd.
I’ll also highlight one or two trade ideas I’m tracking using this information.
And if you find this content helpful, hit that “like” button (you know, the one that looks like a heart). Because I heart you too…
Please share this post and become a subscriber to this always free newsletter if you haven’t already done so!
Now for this week’s issue…
In my last newsletter “The good, the bad, and the ugly”, I should’ve just left it as the ugly…
What was the ugly? It was a reminder that this is still a bear market and that you should be tactical in deploying both long and short positions.
I’ve been on my twitter feed this past week highlighting new short plays to take advantage of the downside. That includes my absolute favorite short setup: the bear flag…more on that in a moment.
I want to start by revisiting our chart of the S&P 500 Index. Last week I noted the precarious position in the S&P, which was a confluence of resistance levels (4200 shown with dashed trendline and the 50-day moving average) along with the MACD resetting at the zero line. At the same time, near-term measures of stock market breadth were becoming very overbought (also recapped last week).
Those were warning signals that the downtrend could resume, which is exactly what transpired. The next level to monitor is around 3900, which is the lows from May where a move below can see the next substantial decline.
And this all happened in a week that saw a very hot CPI report…
What’s Inflation Got to Do With It?
The downside came on the heels of the most recent CPI inflation report, which showed prices gaining 8.6% from a year ago in May. That was higher than economists were expecting, and is leading to some key breakouts…just not the type of breakouts you want to see if you’re an equity bull.
I’m talking about breakouts in interest rates across the maturity curve. We were already tracking the potential for the 10-year yield to rally off support, which I updated below:
But that type of action isn’t just taking place in the 10-year. It’s happening in short-term maturities as well. Take a look at the 2-year treasury yield in the chart below, which is moving out to the highest level since 2018. I explained in this issue of The Market Mosaic why rising yields can negatively impact stock prices.
The other thing to note is that shorter-dated yields are jumping quicker than long-term yields. That’s sending yield curves back toward inversion, where short-term rates rise above long-term rates. Historically, that been a reliable recession indicator, so take note of the 2/10 yield spread chart below that is quickly moving toward inverting once again.
Crumbling Foundation
Truth be told, I was already noticing advance warning signals from key stock market sectors ahead of Friday’s blood bath.
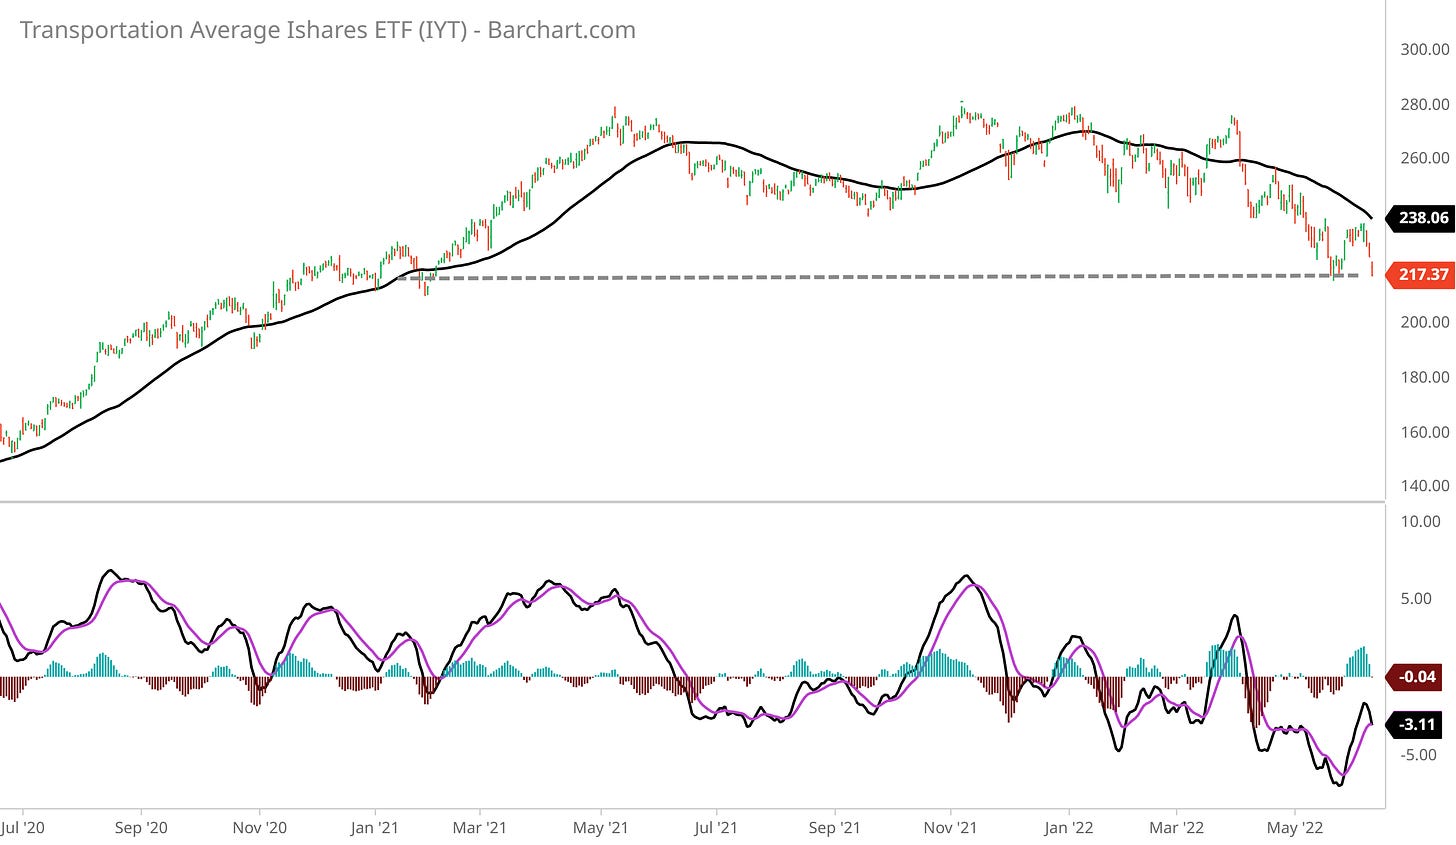
I closely follow stock prices in the sectors most sensitive to changes in economic activity, and recent developments paint a troubling picture. Take transportation stocks for example. It’s easy to understand why companies that move freight are impacted by the outlook for aggregate demand.
Here’s the transports exchanged-traded fund (ETF) IYT on the cusp of taking out a key level. A breakdown below $217 is a loss of a major support level and sends a huge warning about the economy (recession anyone?).
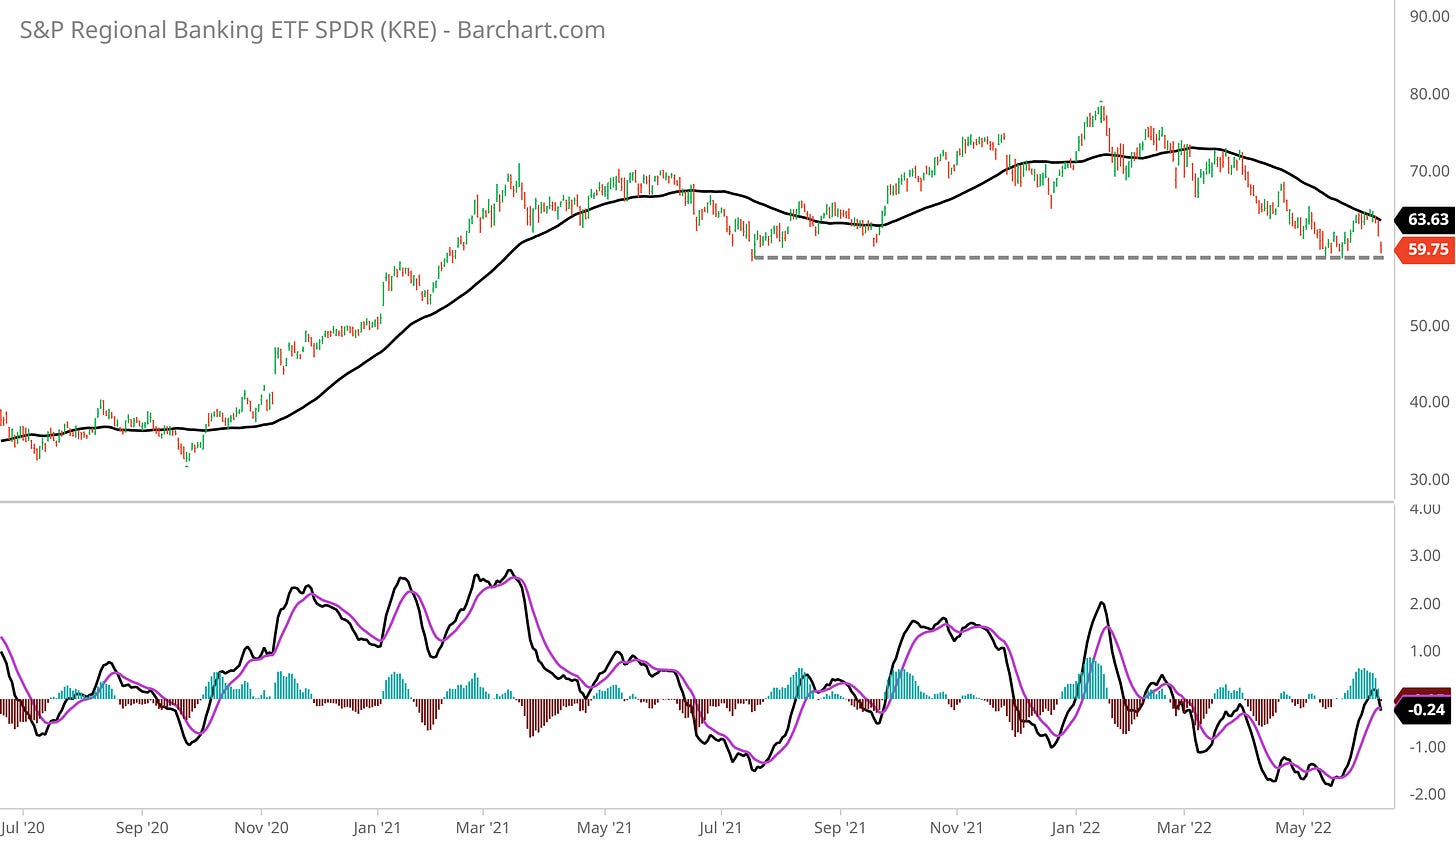
I also believe developments in the fixed income markets discussed above is a major obstacle for credit creation, and thus presents a headwind for the banking sector. That’s why I’m following the $59 level in the regional bank ETF KRE very closely. Similar to IYT current level, it’s a huge support zone that sends a major signal regarding what investors think about the economy.
Now What…
First, I want to remind you that cash is a position, especially if you can’t watch your portfolio and positions every day. Bear markets move fast on both the upside and downside, and you can see profits evaporate or losses get out of control if you can’t respond quickly.
Last week I noted that, for long positions, I look for relative strength and stocks bucking the overall market downtrend. That’s tough to find these days! I’ve highlighted several midstream energy plays recently, including WES, MMP, and a setup in PAA. MMP actually finished the week higher, while WES pulled back but is still holding above the $27 breakout level. PAA is just below the $12 breakout level, so I’m still waiting for that price trigger to add a position.
But my more recent positions have quickly pivoted to playing the downside. Now, I’ve pounded the table lately on the downside setup in fertilizer stocks like NTR, MOS, and IPI. Those followed thru last week, like with NTR. If you caught that one, I think its time to move on to other short/put opportunities as I posted here.
Now for those other short ideas. Several are in the crypto space. We’re seeing renewed breakdowns in several cryptocurrencies, including bitcoin, over the weekend. When I want to bet on falling crypto prices, I first look to crypto-related stocks as a higher beta way to gain exposure. Kind of like how gold miners tend to provide higher beta exposure to physical gold prices. There are two ideas I like here. One is with the blockchain ETF BLOK. Here’s the four-hour chart below, showing a bear flag just starting to breakdown. For an individual equity, Silvergate Capital (SI) hasn’t broken its flag pattern just yet but is setting up. I’m looking for a close under $70.
I’m also eyeing short setups in the airline space. Alaska Air (ALK) in particular has created a support zone since March to monitor. The four-hour chart below shows the level I’m watching, which is the $43/$44 zone.
I know there’s a lot to unpack this week, and it’s tough trying to stay level-headed and objective when markets are chaotic. But that’s also why having a well-defined process and trading plan can help you navigate difficult markets. In conclusion, this is still a bear market and recent developments point to another leg lower in stocks. I’m holding a few long positions that are still demonstrating relative strength and haven’t triggered stops, while looking to add more short positions. But right now, cash is the biggest position in my trading portfolio.
That’s all for this week. I hope you’ve enjoyed this edition of The Market Mosaic, and please share this newsletter with anyone you feel could benefit from an objective look at the stock market.
Make sure you never miss an edition by subscribing here.
And for updated charts, market analysis, and other trade ideas, give me a follow on twitter: @mosaicassetco
Disclaimer: these are not recommendations and just my thoughts and opinions…do your own due diligence! I may hold a position in the securities mentioned in this newsletter.


