The Market Mosaic 5.4.25
Can the S&P 500 rally past economic uncertainty?
👋Welcome back to The Market Mosaic, where I gauge the stock market’s next move by looking at macro, technicals, and market internals. I’ll also highlight trade ideas using this analysis.
If you find this report helpful please hit that “like” button, share this post, and become a subscriber if you haven’t already done so!
And be sure to check out Mosaic Traders Hub. It’s a members-only platform to alert trade ideas, track a model portfolio of open positions, and further analyze the message coming from the capital markets.
🚨You can start a 7-day free trial to the Hub by clicking here. By starting a trial, you will unlock all market updates and trade alerts reserved exclusively for members.
Now for this week’s issue…
For the first time in three years, a broad measure of economic growth dropped into negative territory.
The first quarter GDP report showed annualized growth falling by 0.3% compared to expectations for modest growth of 0.4%. It’s the latest sign that tariffs and trade wars are delivering a major hit to the economy.
But a closer look at the numbers shows it’s not all bad. The drop in GDP was driven by a 41% surge in imports ahead of announced tariffs. That caused a large negative contribution from net exports.
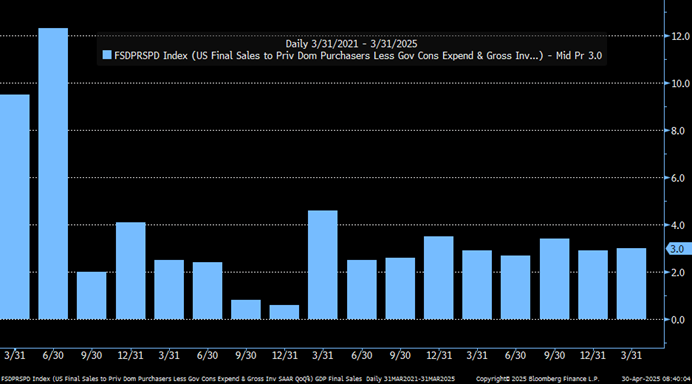
One measure in the GDP report looks at real final sales to private domestic purchasers, which excludes the impact of net exports and government spending. It grew at a 3% annualized rate, which is in line with recent quarters as you can see below.
We also had the April payrolls report last month, which mostly reflected a full month of jobs data following President Trump’s “Liberation Day” reciprocal tariffs. The report showed 177,000 jobs created during the month, and was ahead of expectations for 133,000. As I’ve discussed recently, that echoes weekly jobless claims that have stayed near low levels.
Evidence that the economy is holding up against the turmoil and uncertainty caused by trade war headlines is helping the S&P 500 to recover most of the selloff following the announcement of reciprocal tariffs.
It’s also driving the S&P to its best winning streak in over 20 years. The index has now seen nine consecutive trading days without a loss, which is the best streak since 2004 as you can see below.

This week, let’s look at conflicting evidence around the health of the economy, and why avoiding recession is critical for the S&P 500 to avoid tipping back into a bear market. We’ll also examine signs that the average stock is surging ahead, and why an opportunity could be brewing in small-caps.
The Chart Report
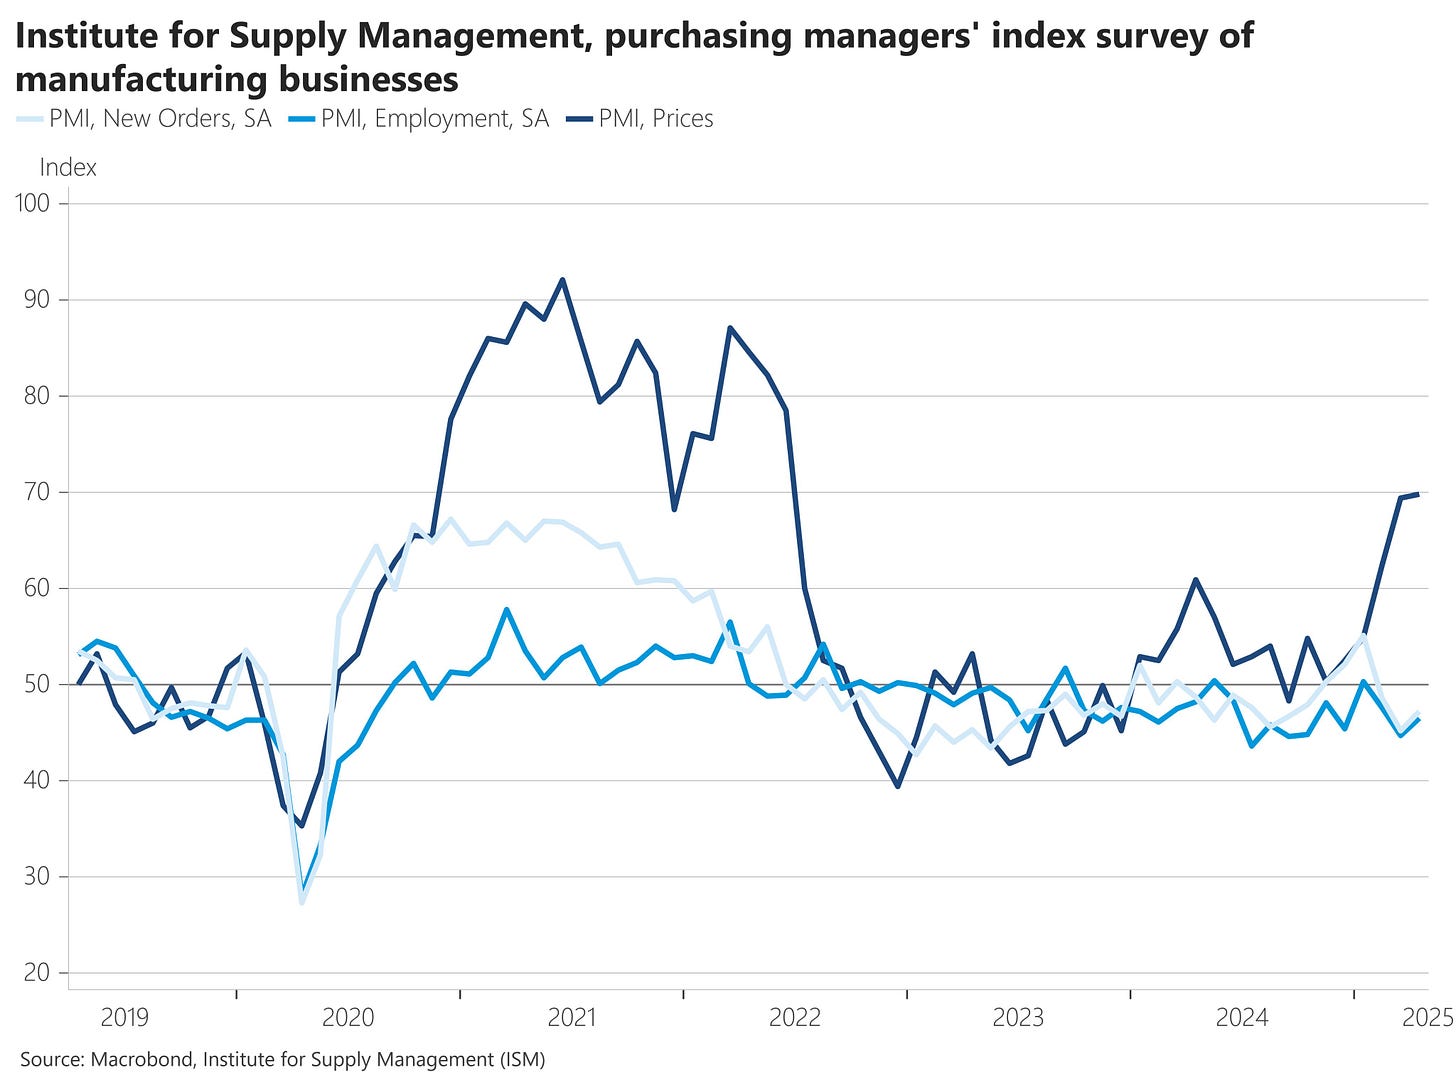
While the guts of the GDP report weren’t as bad as expected, not all economic reports contained positive details last week. That includes the Institute for Supply Management’s report on manufacturing sector activity. The report is designed so that a reading above 50 indicates expanding activity while below 50 points to contracting activity. The headline figure was reported at 48.7, which is the second consecutive month under 50. But the underlying components were more worrying, where leading new orders came in at 47.2 (light blue line) while prices paid (dark blue line) was reported at 69.8. That points to the possibility of stagflation ahead.

Following a quick drop into bear market territory, the forward path for the S&P 500 will come down to the earnings outlook. The chart below shows the progression of earnings for the S&P 500 heading into correction dates, and the subsequent movement in corporate earnings conditional on a recession hitting the economy within 12 months. As you would expect, recessions have a significant negative impact on earnings which is the light blue line in the chart. The purple line shows how earnings have performed historically when recession is avoided following a correction in the S&P 500. Over the long-term, stock prices ultimately follow earnings.

A combination of extremely bearish positioning among institutional investors along with subsiding volatility levels sparked the massive rally in the S&P 500 seen in April. That’s been accompanied by several breadth thrusts, which tracks extreme values in the ratio of advancing stocks relative to declining ones. The turnaround in the average stock is showing up in the S&P 500’s cumulative advance/decline line. The A/D line tracks the performance of the average stock in the S&P 500, and is making fresh highs (red line in the bottom panel below) while the capitalization-weighted index remains 7% below its February peak.
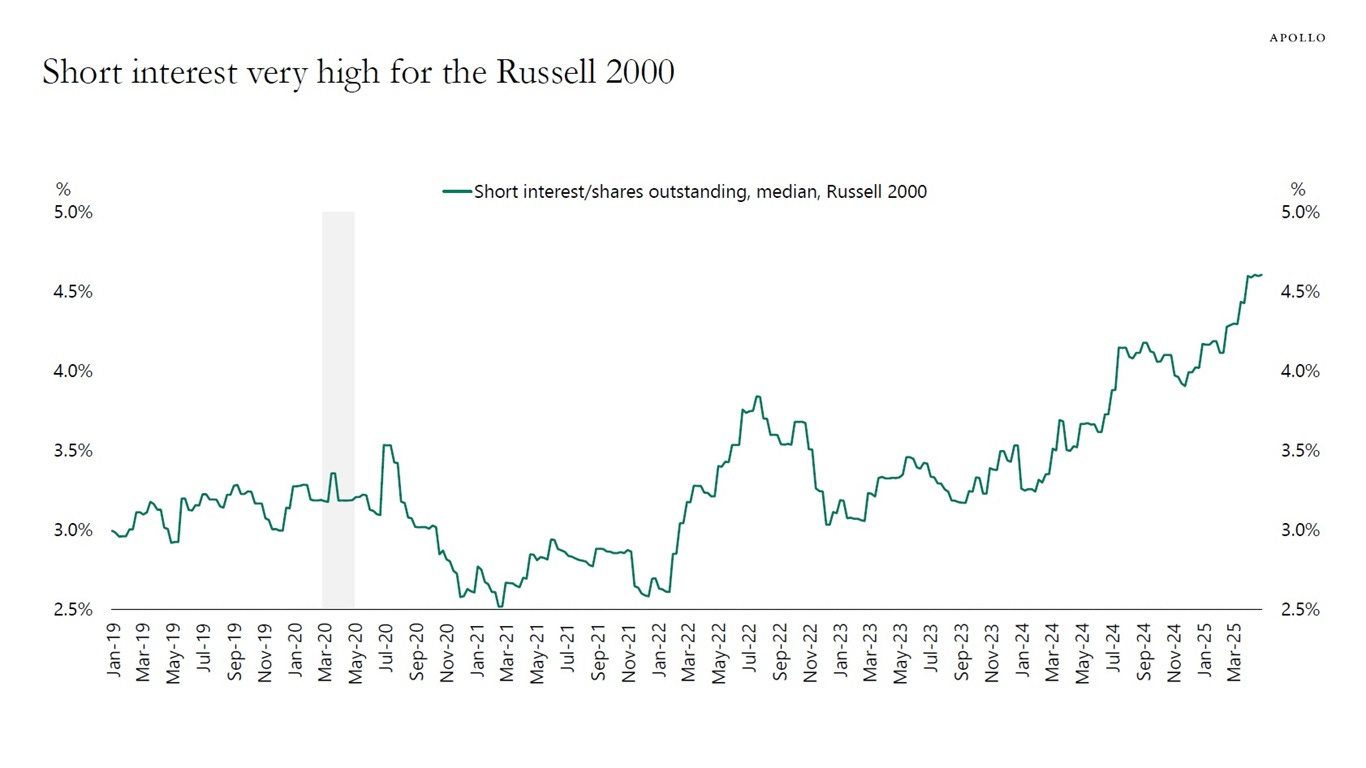
Despite the recent improvement in the average stock, underlying conditions could favor more upside especially among small-caps. Longer-term, small-caps are trading at a 40% valuation discount to cap-weighted large- and mid-cap stocks in the U.S. The discount has only been larger heading into the dot-com bubble in the late 1990s. Near-term, short interest in the Russell 2000 Index of small-caps is running at elevated levels in the chart below. We’ve recently seen how bearish positioning can help drive a rally in stock prices.
The S&P 500 has officially entered the “sell in May and go away” period of seasonality. That refers to the historical tendency for the S&P to see weak returns from the May through October six-month stretch. Looking back 20 years, there are pockets of strength and weak returns within that period. For example, July is one of the strongest month’s of the entire year. But over the near-term, a pocket of weak seasonality is coming up during the second half of May while June has experienced weaker trends as well. That alludes to a period of choppy price action ahead to consolidate the recent gains for the S&P 500.
Heard in the Hub
The Traders Hub features live trade alerts, market update videos, and other educational content for members.
Here’s a quick recap of recent alerts, market updates, and educational posts:
Timing a potential retest of the early April market lows.
How understanding technical conditions helped flag April’s rally.
Price versus breadth thrust indicators, and which is most important.
One biotech trade is rallying, and another is setting up for a position.
Adding a new position in an industry showing strong relative strength.
You can follow everything we’re trading and tracking by becoming a member of the Traders Hub.
By becoming a member, you will unlock all market updates and trade alerts reserved exclusively for members.
👉You can click here to join now👈
Trade Idea
GE Vernova (GEV)
Leading stock in 2024 that peaked back in January near the $450 level. Recent rally bringing the MACD back above zero. The first level I’m watching for a breakout is at $400. Ideally we see a smaller pullback before moving over that level, with confirmation by the relative strength line at new highs.
Key Upcoming Data
Economic Reports
Earnings Releases
I hope you’ve enjoyed The Market Mosaic, and please share this report with your family, friends, coworkers…or anyone that would benefit from an objective look at the stock market.
Become a member of the Traders Hub to unlock access to:
✅Model Portfolio
✅Members Only Chat
✅Trade Ideas & Live Alerts
✅Mosaic Vision Market Updates + More
Our model portfolio is built using a “core and explore” approach, including a Stock Trading Portfolio and ETF Investment Portfolio.
Come join us over at the Hub as we seek to capitalize on stocks and ETFs that are breaking out!
And if you have any questions or feedback, feel free to shoot me an email at mosaicassetco@gmail.com
Disclaimer: these are not recommendations and just my thoughts and opinions…do your own due diligence! I may hold a position in the securities mentioned in this report.


