
The Market Mosaic 5.3.26
S&P 500: Can Earnings Momentum Outrun Inflation Risks?

👋Welcome back to The Market Mosaic, where I gauge the stock market’s next move by looking at macro, technicals, and market internals. I’ll also highlight trade ideas using this analysis.
If you find this report helpful please hit that “like” button, share this post, and become a subscriber if you haven’t already done so!
🚨And be sure to check out Mosaic Traders Hub. It’s a members-only platform to alert trade ideas, track a model portfolio of open positions, and further analyze the message coming from the capital markets.
Now for this week’s issue…
High oil prices, the ongoing war with Iran, and growing hawkishness at the Federal Reserve couldn’t stop stocks from capping off strong gains in April.
A jump in inflation with the Fed’s preferred gauge followed the latest rate-setting meeting in which dissention among the Fed hit its highest level in over 30 years. Market-implied odds don’t point to any rate cuts until the end of 2027.
While uncertainty builds across the outlook for inflation and monetary policy, positive earnings revisions is sending stocks to record highs on one of the strongest monthly returns seen in recent years. The Nasdaq posted its best monthly gain in April since the recovery from the pandemic in 2020 (chart below).

Stocks capped off their fourth consecutive week of gains with indexes including the S&P 500 and Nasdaq jumping out to new high ground. Optimism over the earnings picture is playing a large role in the gains.
While earnings revisions are already moving higher, a report on economic activity is adding to bullish investor sentiment. The first quarter GDP report showed the economy growing at an annualized rate of 2.0% in the first quarter.
Although that missed estimates for growth of 2.3%, an important component of the report showed steady activity. Final sales to private domestic purchasers is a better gauge of underlying domestic demand, and expanded at a 2.5% annualized rate in the first quarter.
That’s inline with growth rates of the past few years. Investors are fixated on the positive messaging from earnings revisions and economic activity. But reports covering inflation and the rate outlook are growing risks to the bull market.
This week, let’s look at the growing problem with inflation and how its forcing a hawkish shift at the Fed. We’ll also look at source of inflation pressures beyond energy markets, and the key consumer inflation level that could impact stock valuations. Finally, we’ll unpack a key driver behind recent market gains and the outlook for the rest of 2026.
The Chart Report
While investors are pushing stock indexes to new record highs on earnings optimism, there’s a growing inflation risk facing the stock market. The Fed’s preferred inflation gauge, the PCE price index, increased by 3.5% in March compared to last year. That continues a recent trend of acceleration, with more recent annualized periods jumping sharply as well (chart below). That’s helping drive growing dissention at the Fed, where the latest rate-setting meeting saw the most dissenting votes since 1992. The primary reason for dissent was against language in the meeting statement indicating an easing bias. Leading indicators of the fed funds rate indicates that the Fed’s easing cycle is over for now.

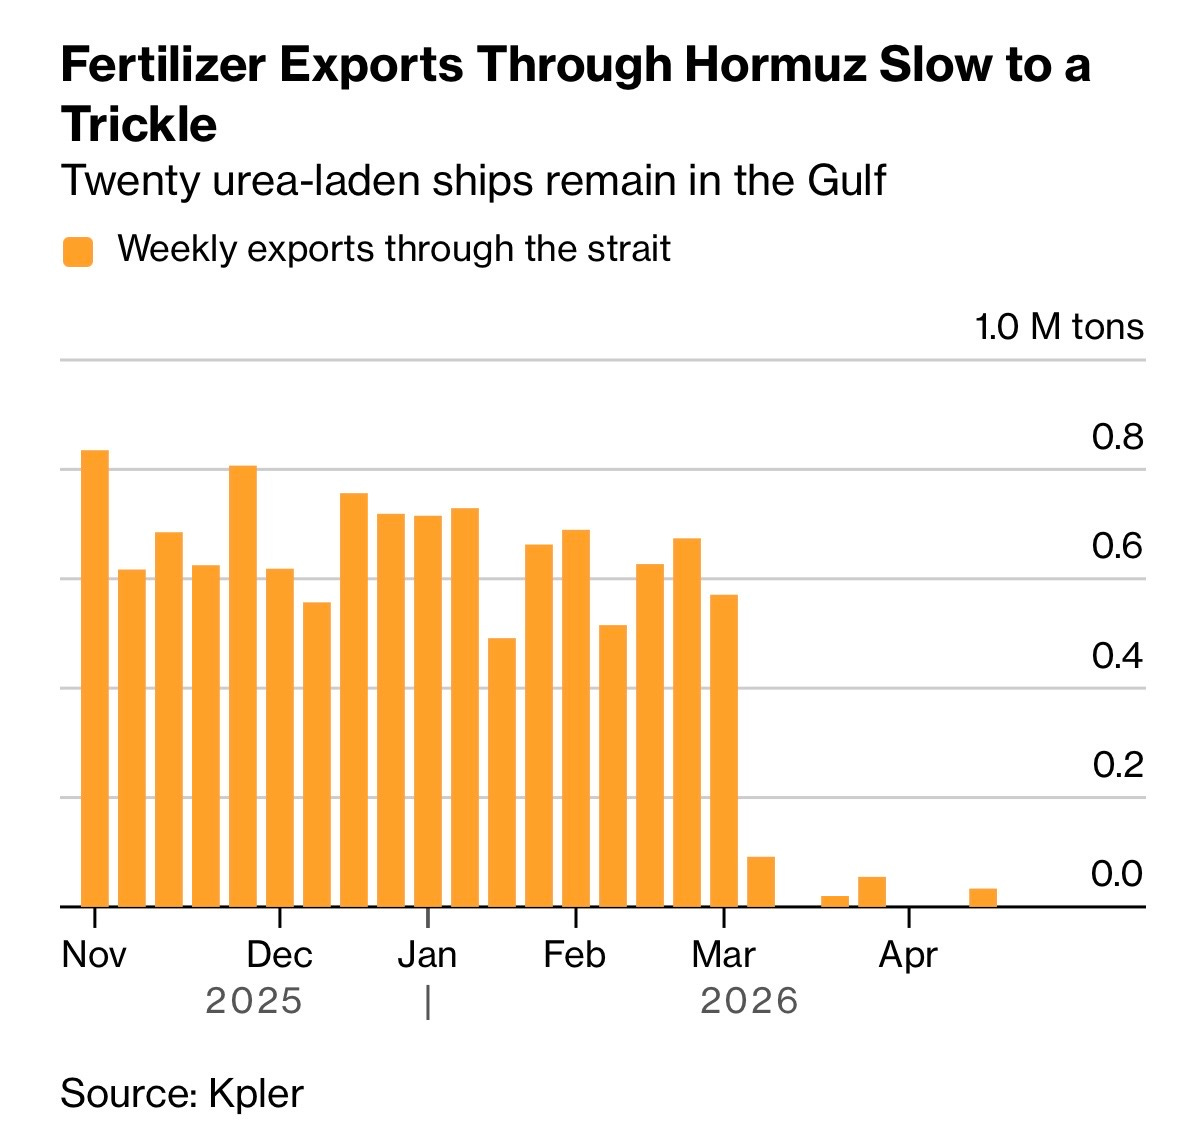
Most headlines around inflation pressures focuses on the impact to energy markets following the U.S./Iran war and halt of tanker traffic through the Strait of Hormuz. The Strait typically saw about 20% of global oil product consumption flow through every day before the war. But there’s another looming inflationary impact, and that’s on food prices. The Middle East is a key producing region for ingredients used in nitrogen-based fertilizers, including urea where the region produces 45% of global supply. As you can see in the chart below, fertilizer exports through the Strait have also collapsed following the war. Fertilizer shortages could push up crop prices and impact yields as the spring planting season is underway.
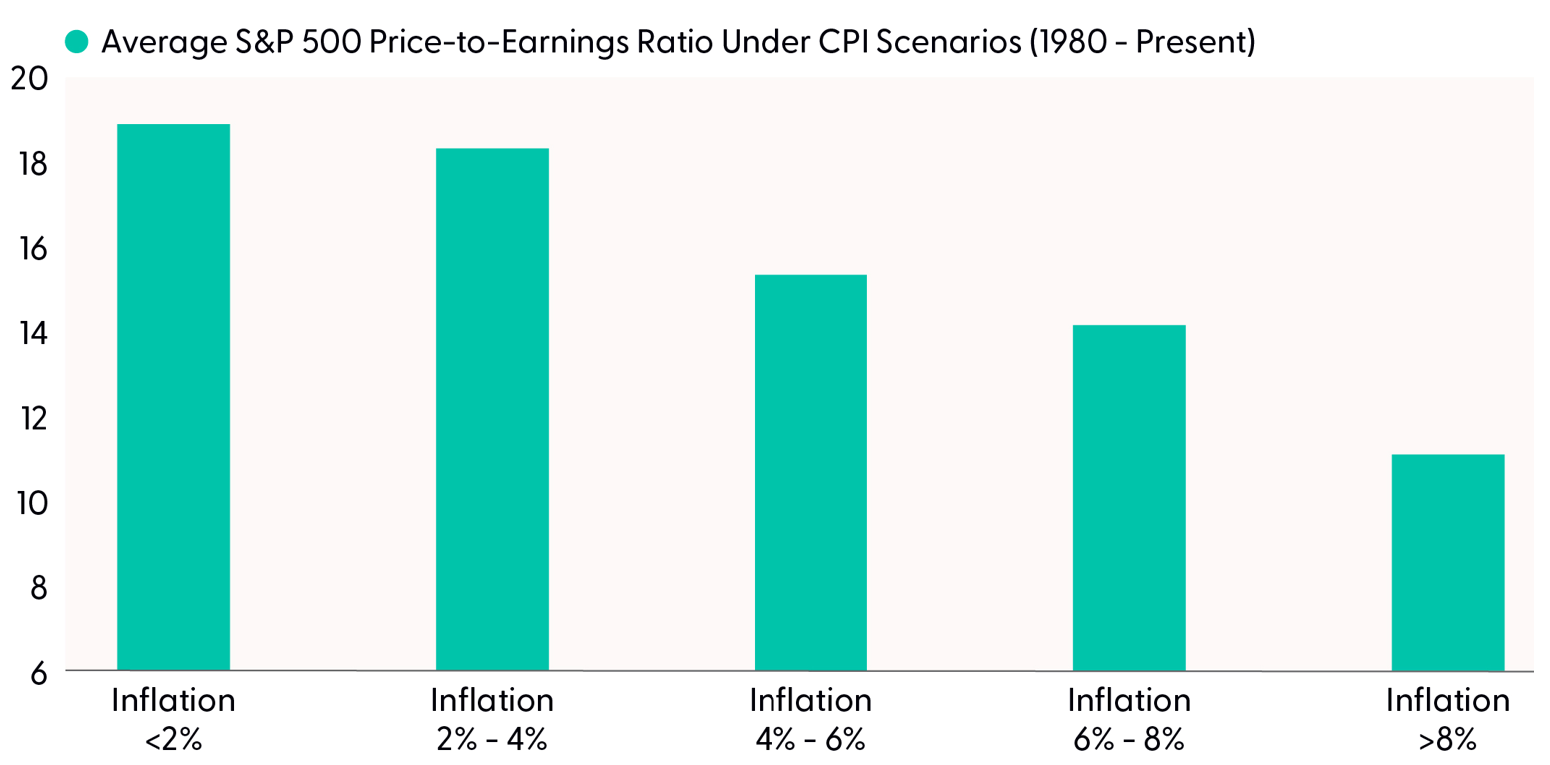
If inflation does start accelerating further in the months ahead, that could add significant pressure to stock valuations. High inflation tends to lead to high interest rates, which makes the present value of future corporate profits worth less in present value terms. The chart below shows the average S&P 500 P/E ratio under different inflation regimes going back to 1980. You can see that average valuations start taking a big hit as inflation moves above 4%. With headline consumer inflation running over 3%, potential acceleration in the months ahead could have a major impact on valuations.
While dissent among the Fed’s rate-setting committee is growing, key indicators are already broadcasting a pivot on monetary policy is underway. Market-implied odds show the fed funds rate holding steady through the end of 2027. The 2-year Treasury yield, which tends to lead changes in fed funds, has recently jumped above the upper range of the current target. That shows the bond market is starting to price rate hikes instead of cuts. A survey of households on the rate outlook is quickly evolving as well. The chart below plots interest rate expectations from a consumer survey. The percent of respondents is rising quickly from a low level, which is a similar dynamic ahead of past tightening cycles.

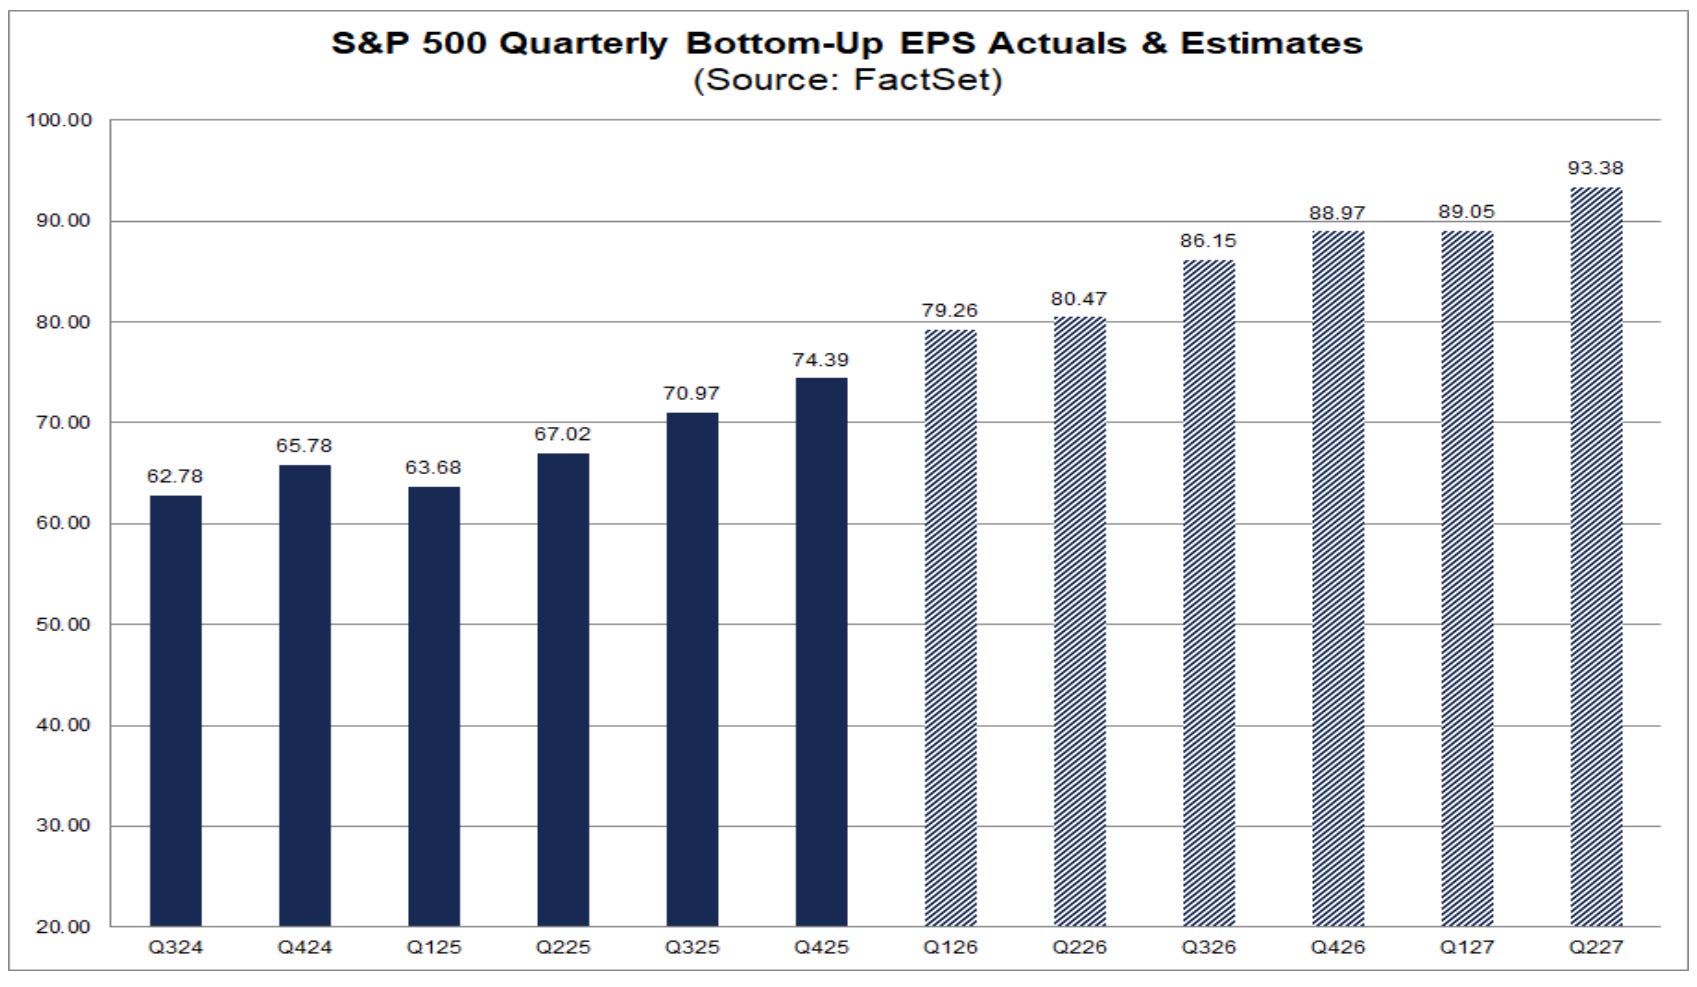
A sharp jump in corporate earnings and the outlook for more growth is a key factor behind the move in the S&P 500 to record highs. Earnings revisions for 2026 have been steadily moving higher since the start of the year, which is a break from the traditional path of current year revisions that typically drifts lower. The first quarter growth rate in earnings is tracking around 27% following earnings from several of the “Mag 7” companies. If it holds, that would be the highest quarterly growth rate since the fourth quarter of 2021. Looking ahead, current estimates point to about 20% or better year-over-year earnings growth for every quarter in 2026 (chart below).
Heard in the Hub
The Traders Hub features live trade alerts, market update videos, and other educational content for members.
Here’s a quick recap of recent alerts, market updates, and educational posts:
The S&P 500 is following a familiar path.
What’s fueling the stock market to record highs.
The next commodity sector that could breakout.
A huge risk from the Iran war…and it’s not energy.
How the outlook for AI productivity is feeding the earnings outlook.
You can follow everything we’re trading and tracking by becoming a member of the Traders Hub.
By becoming a member, you will unlock all market updates and trade alerts reserved exclusively for members.
Trade Idea
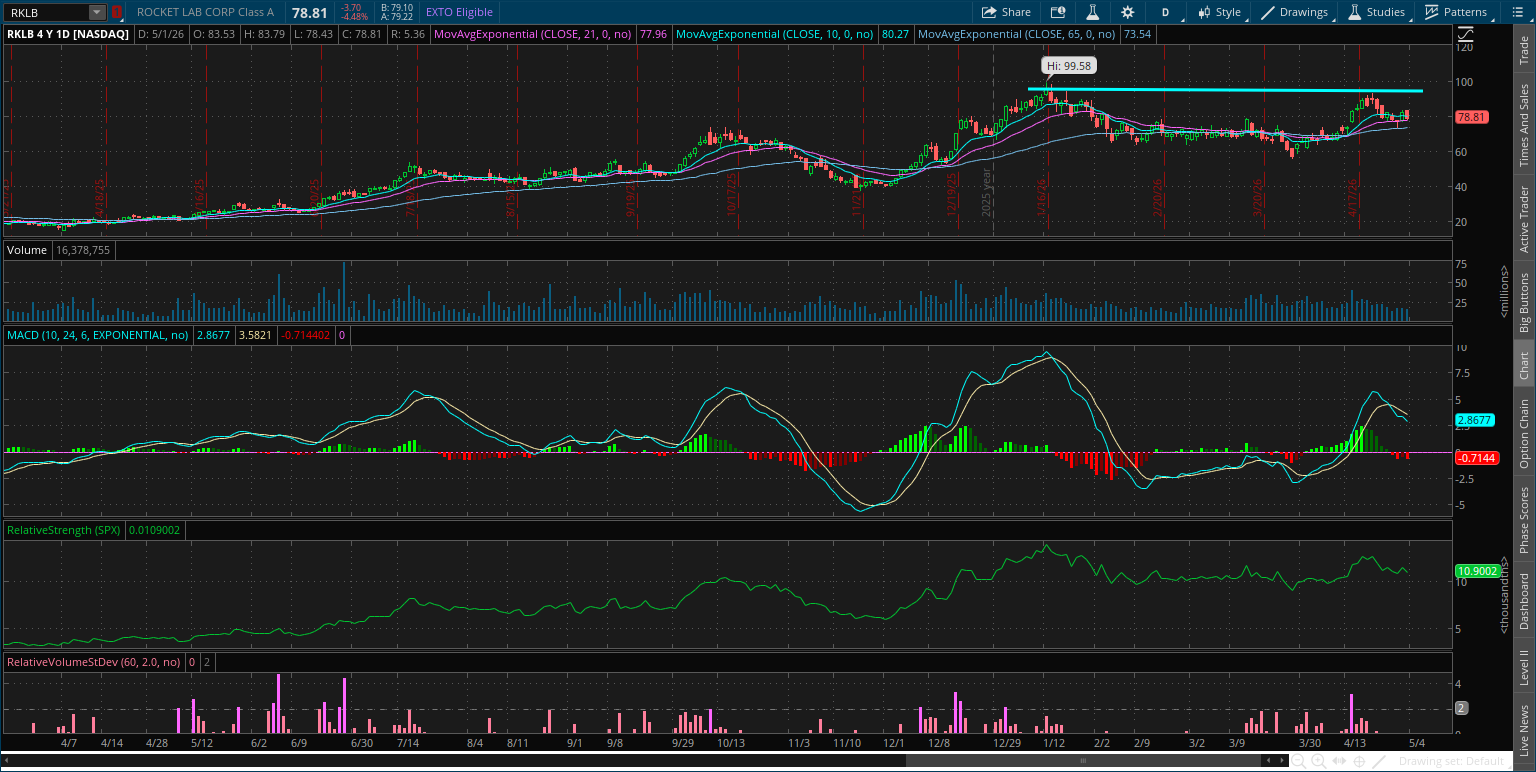
Rocket Lab Corp (RKLB)
The stock peaked near the psychologically important $100 level in January and is recently testing that level again. A smaller pullback is underway that’s resetting the MACD above zero. I’m watching for a move over $100.
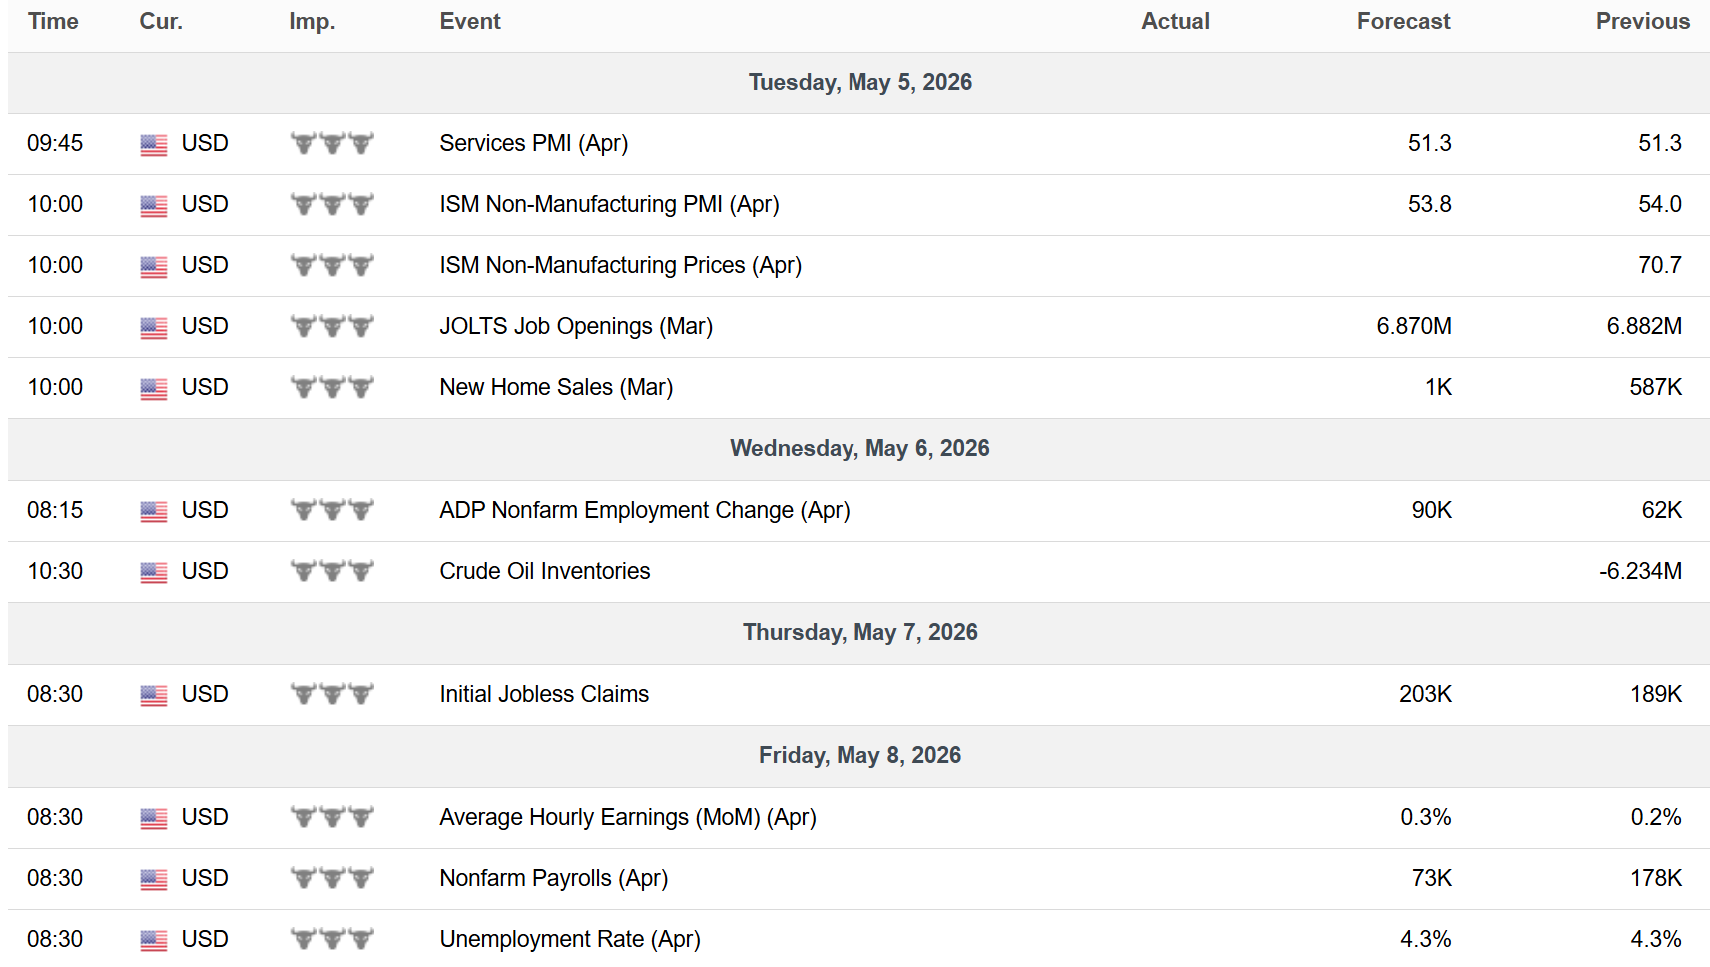
Key Upcoming Data
Economic Reports
Earnings Reports

I hope you’ve enjoyed The Market Mosaic, and please share this report with your family, friends, coworkers…or anyone that would benefit from an objective look at the stock market.
Become a member of the Traders Hub to unlock access to:
✅Model Portfolio
✅Members Only Chat
✅Trade Ideas & Live Alerts
✅Mosaic Vision Market Updates + More
Our model portfolio is built using a “core and explore” approach, including a Stock Trading Portfolio and ETF Investment Portfolio.
Come join us over at the Hub as we seek to capitalize on stocks and ETFs that are breaking out!
And if you have any questions or feedback, feel free to shoot me an email at mosaicassetco@gmail.com
Disclaimer: these are not recommendations and just my thoughts and opinions…do your own due diligence! I may hold a position in the securities mentioned in this report.