
The Market Mosaic 5.25.25
Is a fiscal crisis brewing?

👋Welcome back to The Market Mosaic, where I gauge the stock market’s next move by looking at macro, technicals, and market internals. I’ll also highlight trade ideas using this analysis.
If you find this report helpful please hit that “like” button, share this post, and become a subscriber if you haven’t already done so!
🚨And be sure to check out Mosaic Traders Hub. It’s a members-only platform to alert trade ideas, track a model portfolio of open positions, and further analyze the message coming from the capital markets.
Now for this week’s issue…
A Moody’s debt downgrade initially did little to dent the risk-on appetite from investors. A poor bond auction might have proved the rating agency’s point.
Moody’s downgraded the U.S. credit rating and took away its top rating a week ago. Concerns over the outlook for fiscal deficits and debt levels is hardly new. S&P and Fitch already downgraded the U.S. rate years ago.
Stocks initially shrugged off the downgrade as the S&P 500 reacted with its sixth daily consecutive gain to start last week. But a poor 20-year Treasury bond auction sent longer-dated yields surging higher…showing the downgrade from Moody’s may prove timely.
The 30-year Treasury yield jumped higher following the auction. You can see in the chart below that the 30-year Treasury yield went to 5.08%. That’s completing an ascending triangle pattern shown with the trend lines. A move out of the pattern could send the 30-year rate to the highest level in 18 years.

Higher rates can be a negative catalyst for stock prices in a number of ways. Higher borrowing costs impacts consumer spending and the ability of corporations to fund new projects. Both effects can call the corporate earnings outlook into question.
Rising interest rates makes future corporate profits worth less in today’s terms, which impacts valuations. The current state of above average valuations makes them even more susceptible to rising rates. A jump in interest rates also presents competition for investor capital since bonds offer a more attractive return than before.
This week, let’s look at why rising debt levels may finally present a concern for investors. We’ll also look at how the U.S. dollar could be impacted, and why that may become a tailwind for precious metals and other commodities.
The Chart Report
Moody’s is the last major agency to downgrade the U.S. credit rating from its top level as S&P and Fitch did the same years ago. But the Moody’s rating change could prove more timely given the recent jump in longer-dated yields. Besides a brief jump in 2023, the last time the 30-year yield traded above 5% was back in 2007. Debt levels back then were running near $9 trillion compared to $36 trillion today as you can see in the chart below. Debt-to-GDP stands at 120% today compared to 63% in 2007. But large annual deficits aren’t going away, and are expected to stay around 6% of GDP and rise to $2.5 trillion by 2035.

A deteriorating fiscal situation could be the catalyst driving the U.S. Dollar Index (DXY) below a key level. After peaking in September 2022, DXY traded in a large range with support at the 100 level tested on several occasions. In April, DXY broke below that level. The loss of a key chart level could see downside accelerate, especially as longer-term measures of momentum turn negative. The chart below shows the rolling 10-year return of DXY. You can see the rolling 10-year return is close to turning negative, which has been a major inflection point for more downside based on history.

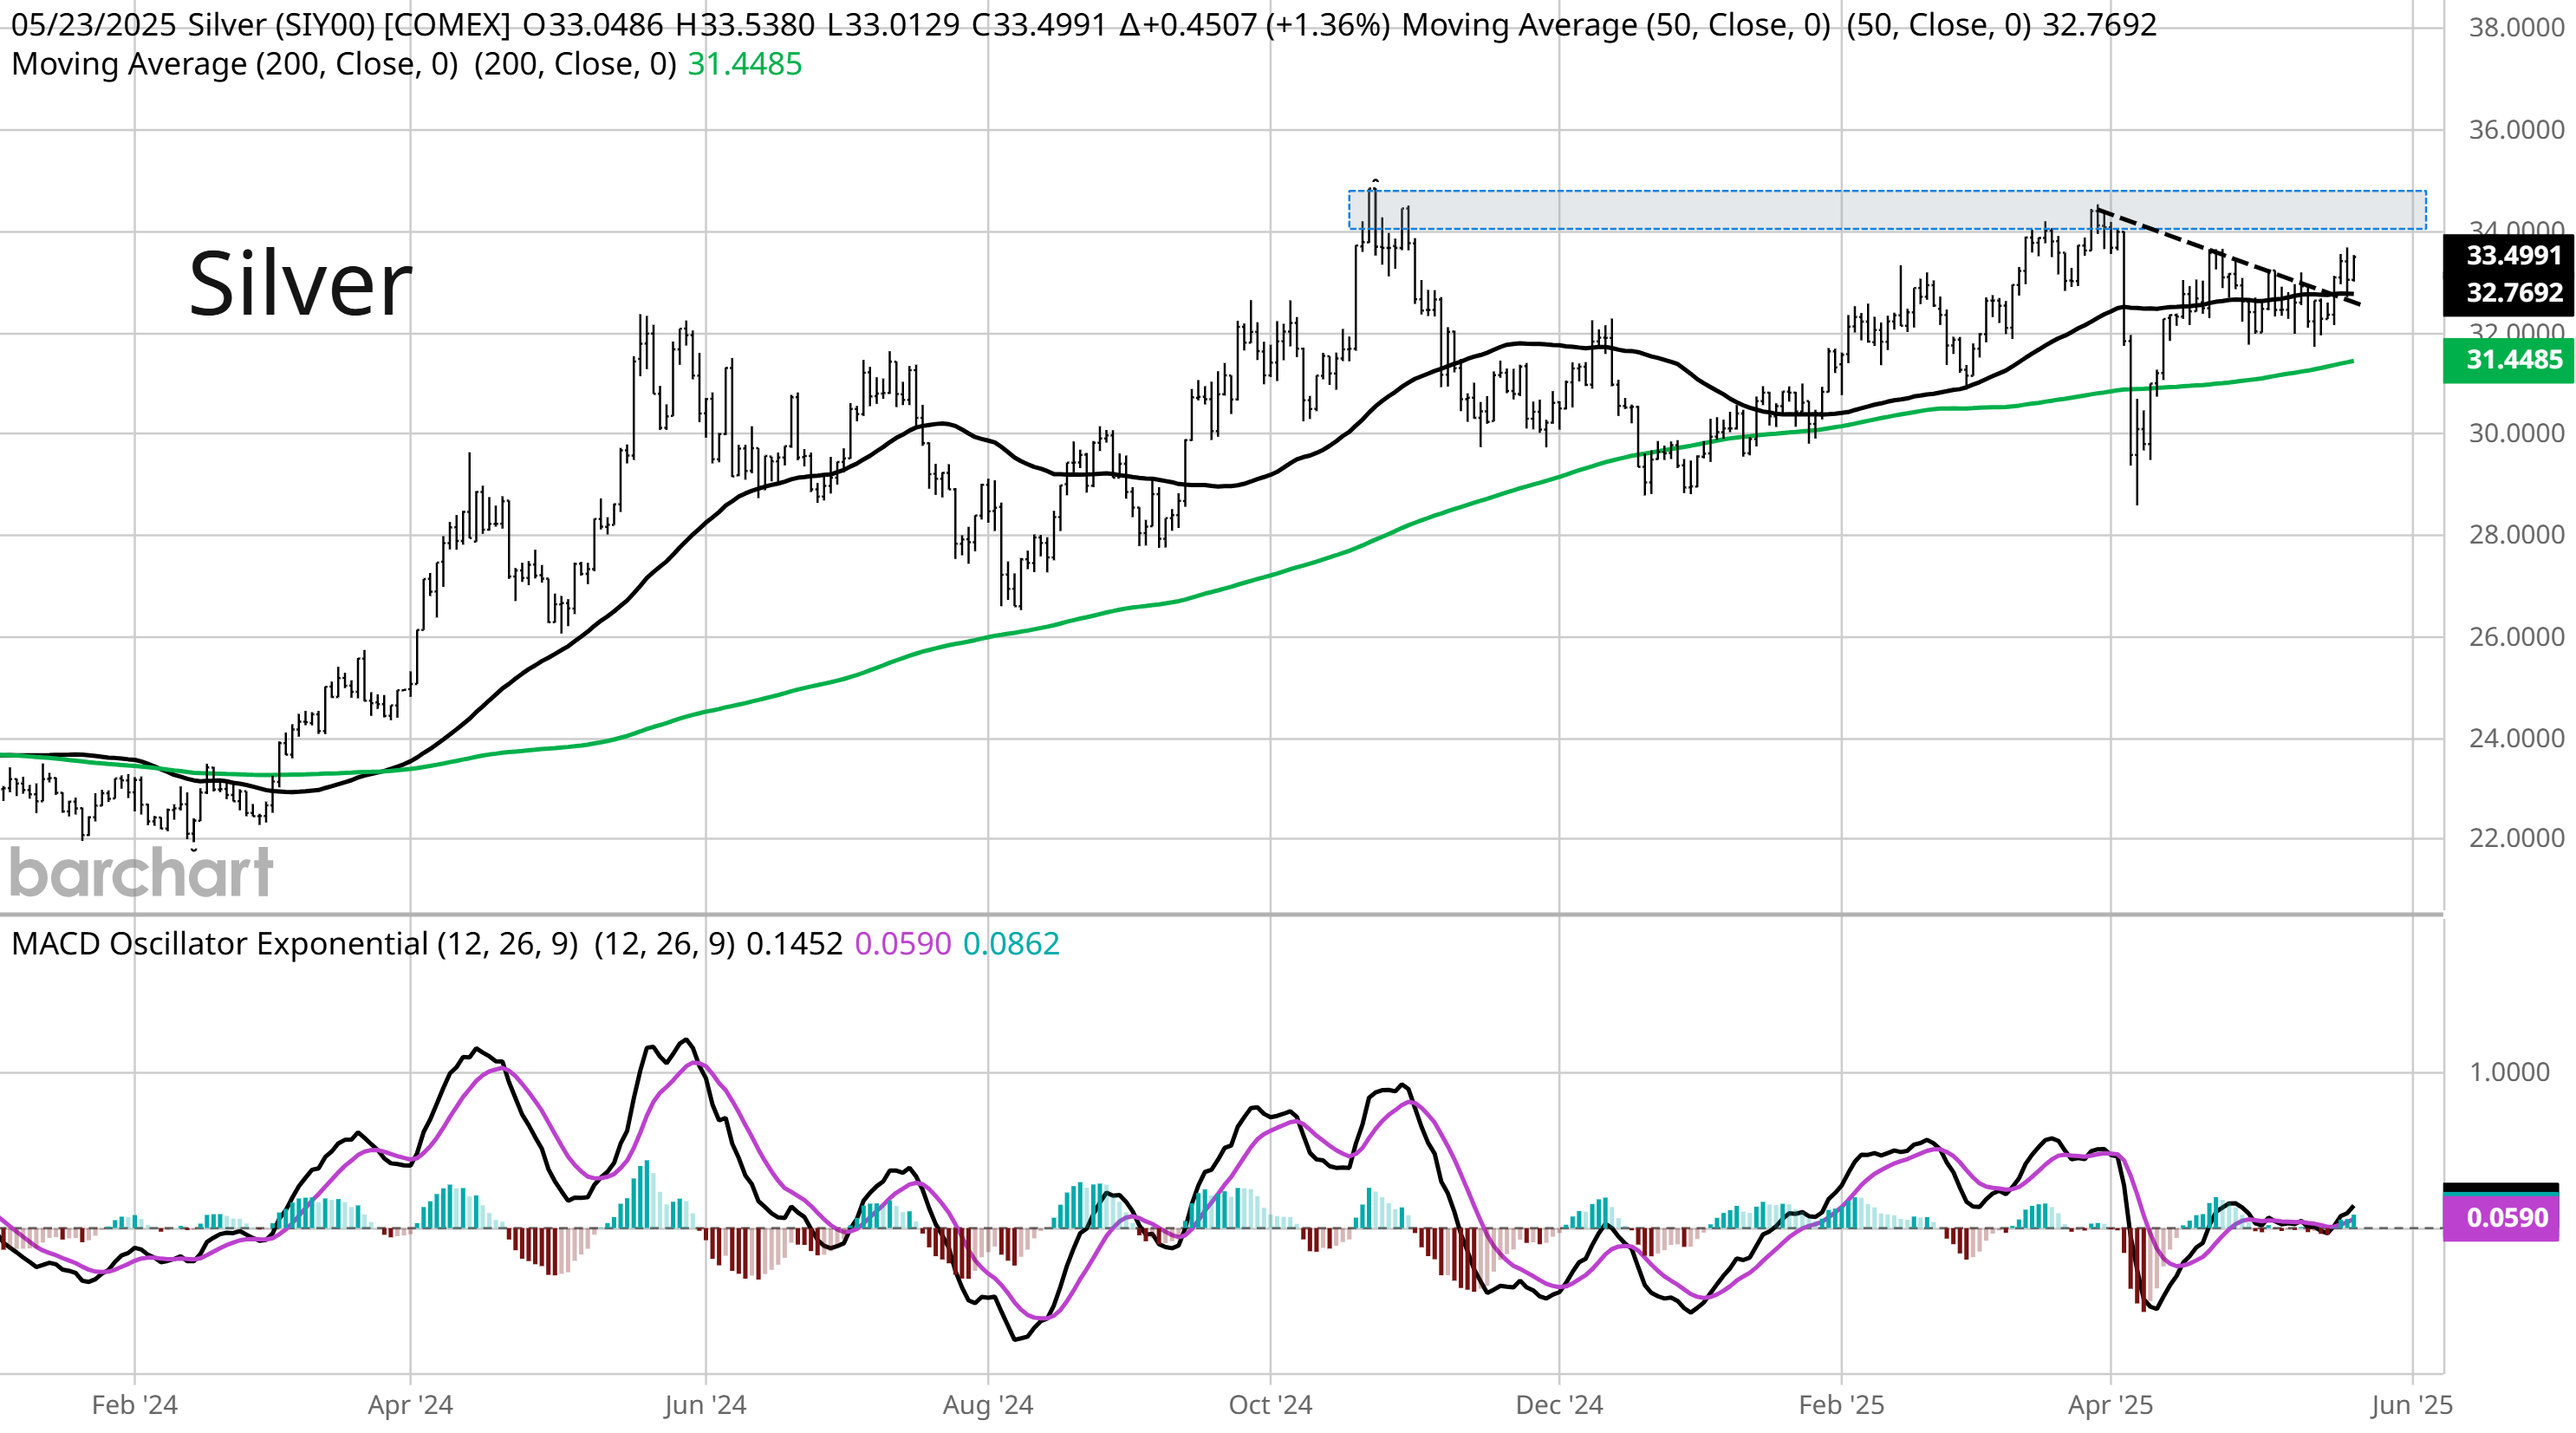
The recent drop in DXY is supporting the rally in gold to record levels. A further drop on the loss of chart support and deteriorating long-term momentum means that a weakening dollar will remain a tailwind for gold. It could also finally drive a breakout in silver. Silver has lagged the gains in gold, with the gold/silver ratio rising to the high end of its historical range. While the bullish catalysts remain in place, silver could be the next major breakout to monitor. Silver is taking out minor downtrend resistance at the dashed trendline. The next level to watch is a move over $34 per ounce, which would be the highest level in over 10 years.
While rising interest rates could pressure stocks in the near-term, there are other catalysts that could drive equities higher this year. That includes positioning by fund managers. I’ve previously showed you how volatility-targeting strategies significantly cut equity exposure and would be drawn back with a collapse in VIX levels. I believe that was a major factor behind the rally into May. An unwinding of a US equity underweight position among fund managers could be the next catalyst. According to a survey by BofA, fund managers have the largest underweight to US equities since May 2023 (chart below) which was shortly after the bank crisis that year.

Fund managers may be feeling bearish based on the recent trend in earnings revisions. The chart below measures how many upward revisions to earnings estimates analysts are making versus downward revisions over a given period. The ratio is at the lowest level since 2020 and the pandemic’s impact on the economy. But if you look back, a low revisions ratio in negative territory tends to happen around market bottoms compared to peaks.

Heard in the Hub
The Traders Hub features live trade alerts, market update videos, and other educational content for members.
Here’s a quick recap of recent alerts, market updates, and educational posts:
Why a small pullback in Bitcoin could setup a major breakout.
Studying base-on-base patterns to prepare for trading opportunities.
Why the Moody’s downgrade makes this feel like 2011 for the S&P 500.
A negative breadth divergence shows up for the first time sine the peak.
The Fed’s not coming to the rescue, and what that means about the April lows.
You can follow everything we’re trading and tracking by becoming a member of the Traders Hub.
By becoming a member, you will unlock all market updates and trade alerts reserved exclusively for members.
👉You can click here to join now👈
Trade Idea
Antero Resources (AR)
The stock peaked at the $41 level back in January and started a new consolidation. May be forming the right side of the base with a smaller pullback after testing $41 again in May. Watching for the MACD to reset above zero followed by a breakout over $41.

Key Upcoming Data
Economic Reports

Earnings Releases

I hope you’ve enjoyed The Market Mosaic, and please share this report with your family, friends, coworkers…or anyone that would benefit from an objective look at the stock market.
Become a member of the Traders Hub to unlock access to:
✅Model Portfolio
✅Members Only Chat
✅Trade Ideas & Live Alerts
✅Mosaic Vision Market Updates + More
Our model portfolio is built using a “core and explore” approach, including a Stock Trading Portfolio and ETF Investment Portfolio.
Come join us over at the Hub as we seek to capitalize on stocks and ETFs that are breaking out!
And if you have any questions or feedback, feel free to shoot me an email at mosaicassetco@gmail.com
Disclaimer: these are not recommendations and just my thoughts and opinions…do your own due diligence! I may hold a position in the securities mentioned in this report.