
The Market Mosaic 5.24.26
S&P 500 Defies the Odds: Can the Rally Survive the Wall of Worry?

👋Welcome back to The Market Mosaic, where I gauge the stock market’s next move by looking at macro, technicals, and market internals. I’ll also highlight trade ideas using this analysis.
If you find this report helpful please hit that “like” button, share this post, and become a subscriber if you haven’t already done so!
🚨And be sure to check out Mosaic Traders Hub. It’s a members-only platform to alert trade ideas, track a model portfolio of open positions, and further analyze the message coming from the capital markets.
Now for this week’s issue…
Developments surrounding the conflict in the Middle East remain fluid while a new chairman takes the helm of the most important economic institution in the world.
Speculation over a lasting peace deal between the U.S. and Iran made headlines several times last week with little substance. But the best chance appears to be developing this weekend as a ceasefire looks to be extended and a framework for a deal is reportedly growing closer.
While headlines coming out of the Middle East are leading to a quick burst of volatility, a much bigger catalyst for investors is evolving. Just as Kevin Warsh becomes the new chairman of the Federal Reserve, key members on the the Fed’s Board of Governors are growing more hawkish.
In a speech last week, Christopher Waller stated that “inflation is not moving in the right direction” and can “no longer rule out rate hikes further down the road”. Waller previously was a leading proponent for cutting rates on labor market concerns.
That’s contributing to a jump in volatility across interest rates. The 30-year Treasury yield is holding onto a breakout above 5% and hit the highest level in nearly 20 years. Market-implied probabilities now point to a rate hike as soon as December.
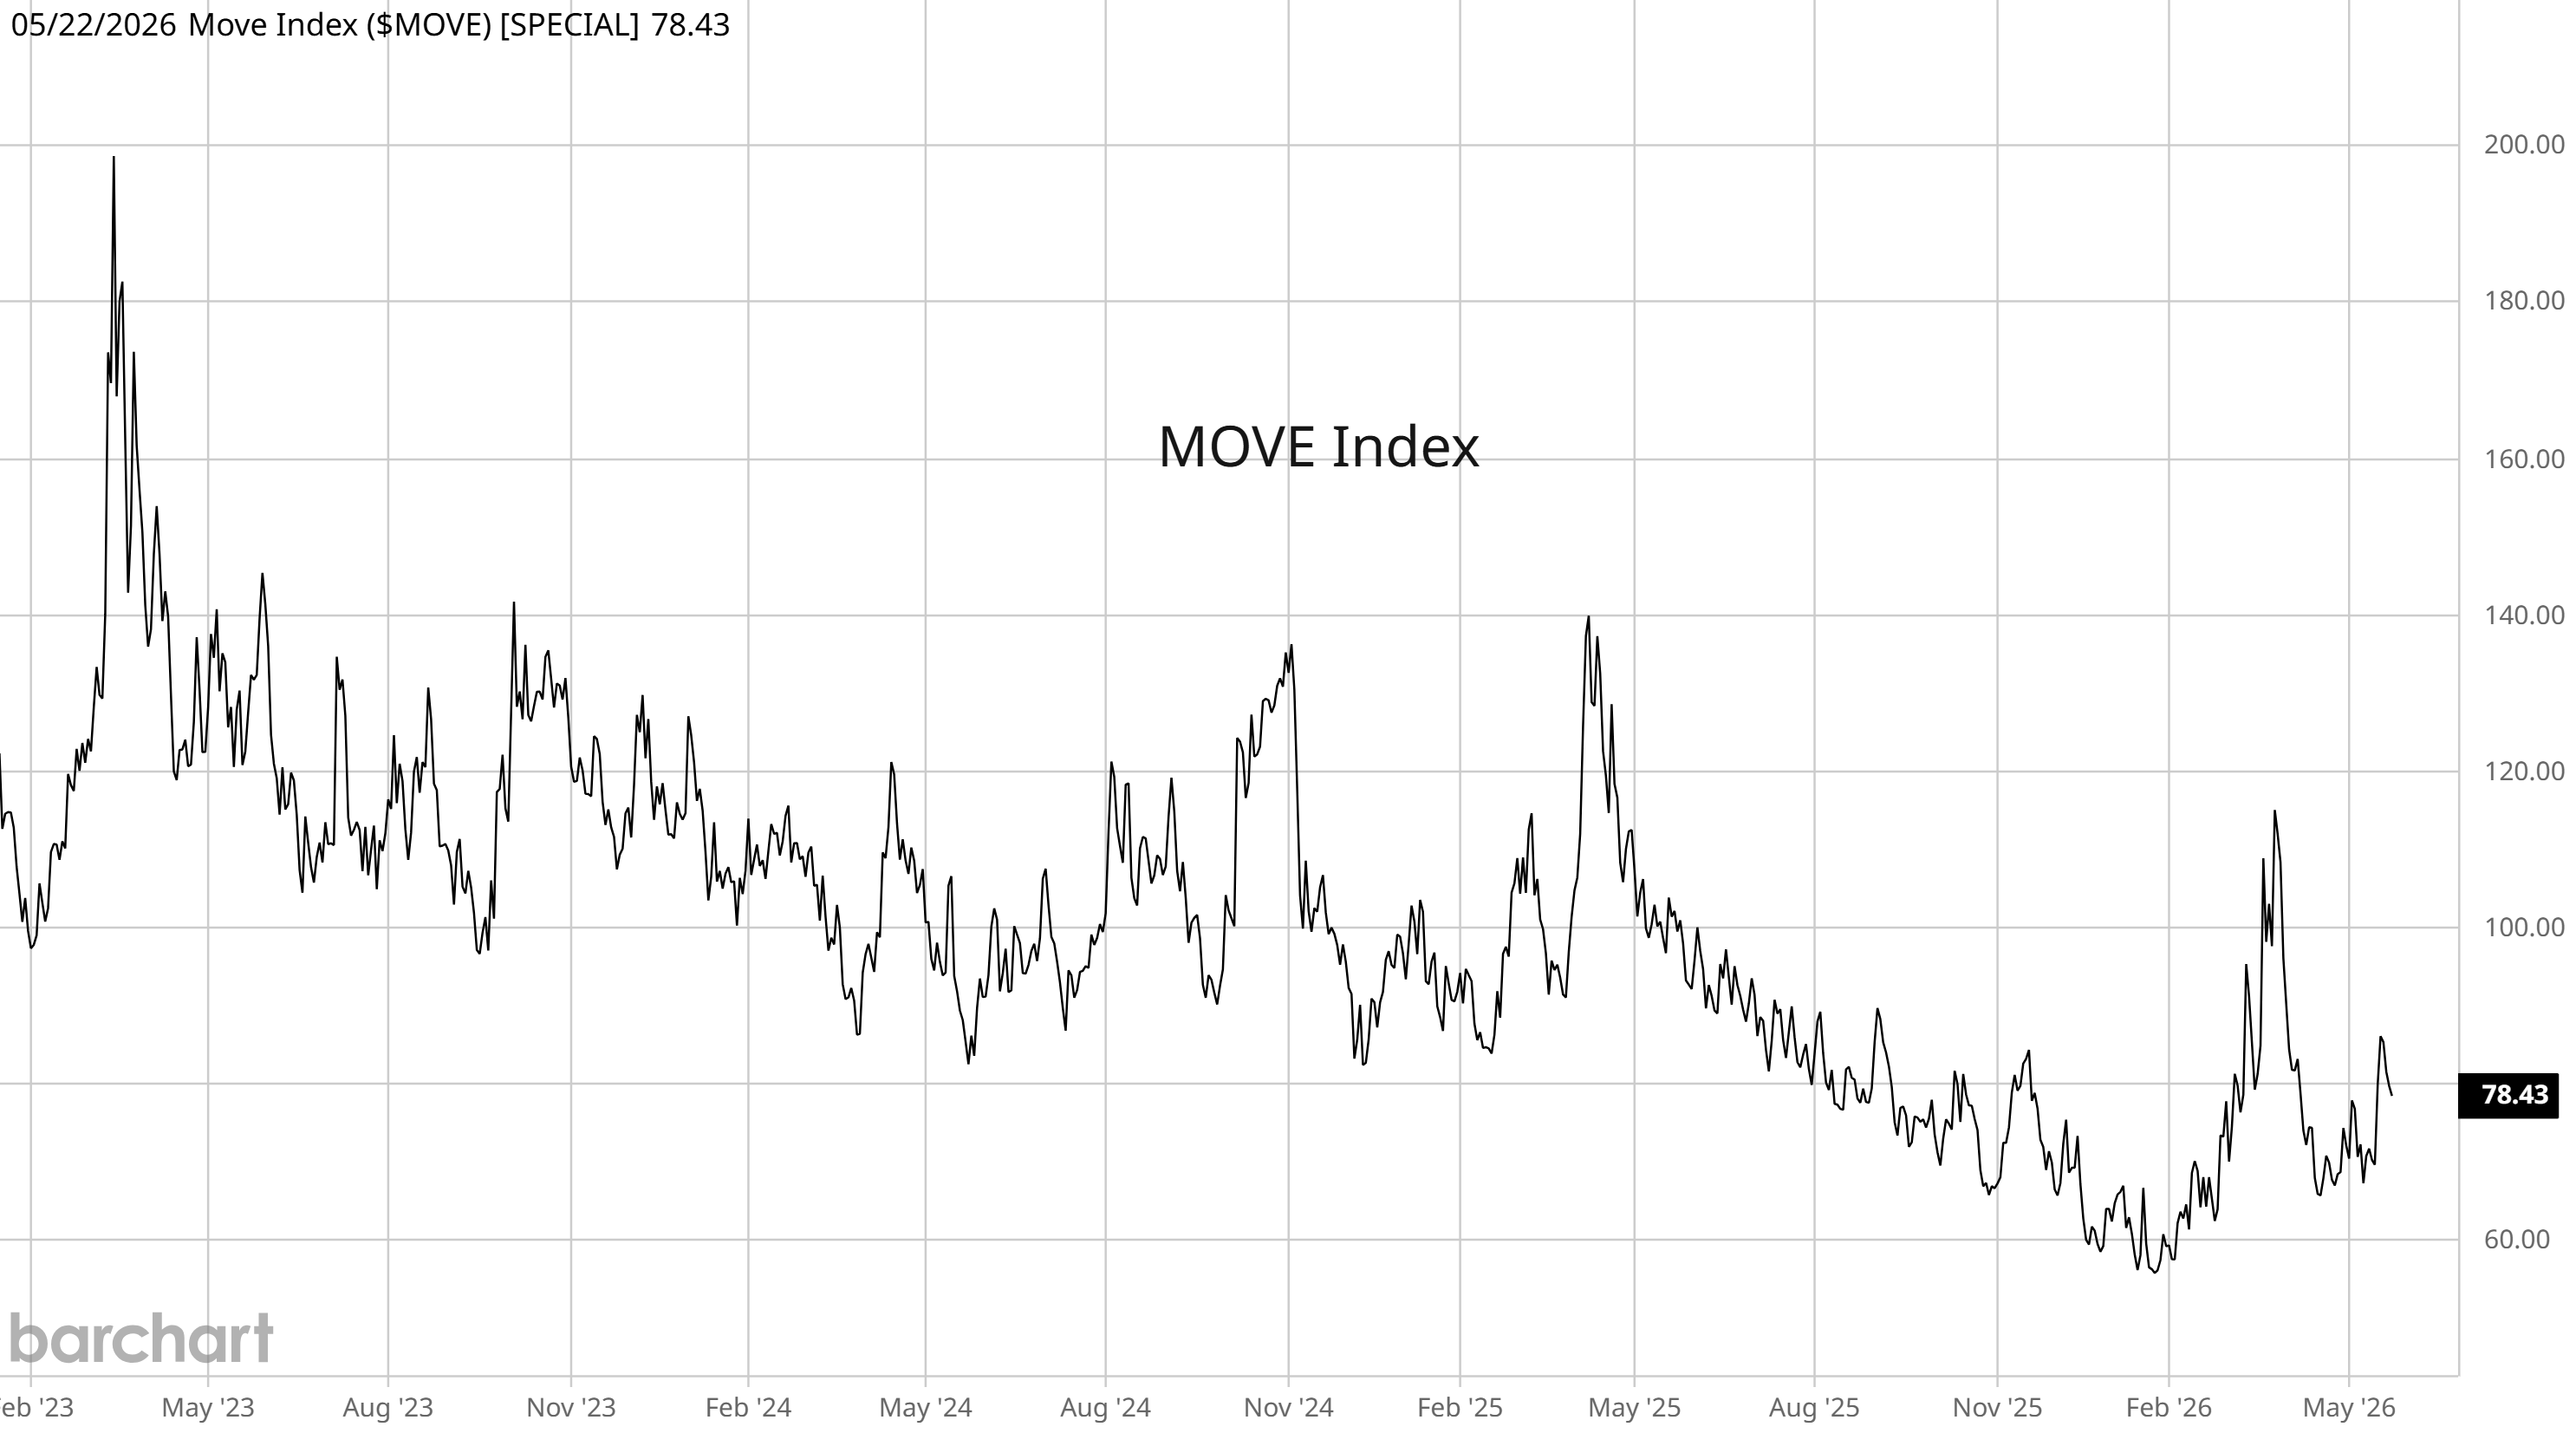
Following a steady decline over the past couple years, a measure of bond market volatility hit a low in late January and is turning higher as you can see in the chart below plotting the MOVE index that tracks volatility in Treasury securities.
Indexes like the S&P 500 and Nasdaq are holding near record highs as concentration in mega-cap stocks linked to the AI infrastructure buildout remain buoyant. But elsewhere in the market, the average stock is reflecting the jump in inflation and impact on interest rates.
But bullish conditions are emerging with short-term breadth hitting oversold levels while investor sentiment turns more negative, with bearish views among retail investors jumping to the highest level since the market drawdown into late March.
This week, let’s look at developments with leading indicators of inflation and what it means for rising price levels. We’ll also look at the rebound in corporate earnings and how it could be another catalyst for higher interest rates. Finally, we’ll look at conditions across breadth and sentiment and how that can keep the rally intact.
The Chart Report
Evidence continues building that a significant jump in inflation is underway. The most recent reports covering consumer and producer inflation showed prices jumping by the most in years. While investors and economists are hopeful that a resolution to the conflict in the Middle East will ease energy prices and translate to a temporary bump in inflation, various core measures of inflation excluding food and energy prices are turning higher as well. At the same time, leading indicators of inflation continue jumping higher. That includes the prices paid component of various business surveys covering the service and manufacturing sector of the economy. The chart below plots price components being incurred and passed along, where a reading above 50 indicates rising prices. Businesses are citing both supply chain constraints and impact of energy markets as key drivers behind the jump in prices.

While the economy faces growing uncertainty, that hasn’t slowed a sharp rise in corporate earnings. More recently, AI-driven capex and rise in energy prices that positively impacts producers are behind a rise in earnings estimates looking ahead. The chart below shows the growth in forward earnings for the S&P 500, which could also be a leading indicator for the path of monetary policy. The change in the short-term fed fuds rate is plotted as well (black line). You can see that forward earnings growth tends to change trend ahead of fed funds, where earnings growth reflects economic activity. A rebound in corporate earnings is another warning that tighter monetary policy could be lurking ahead.

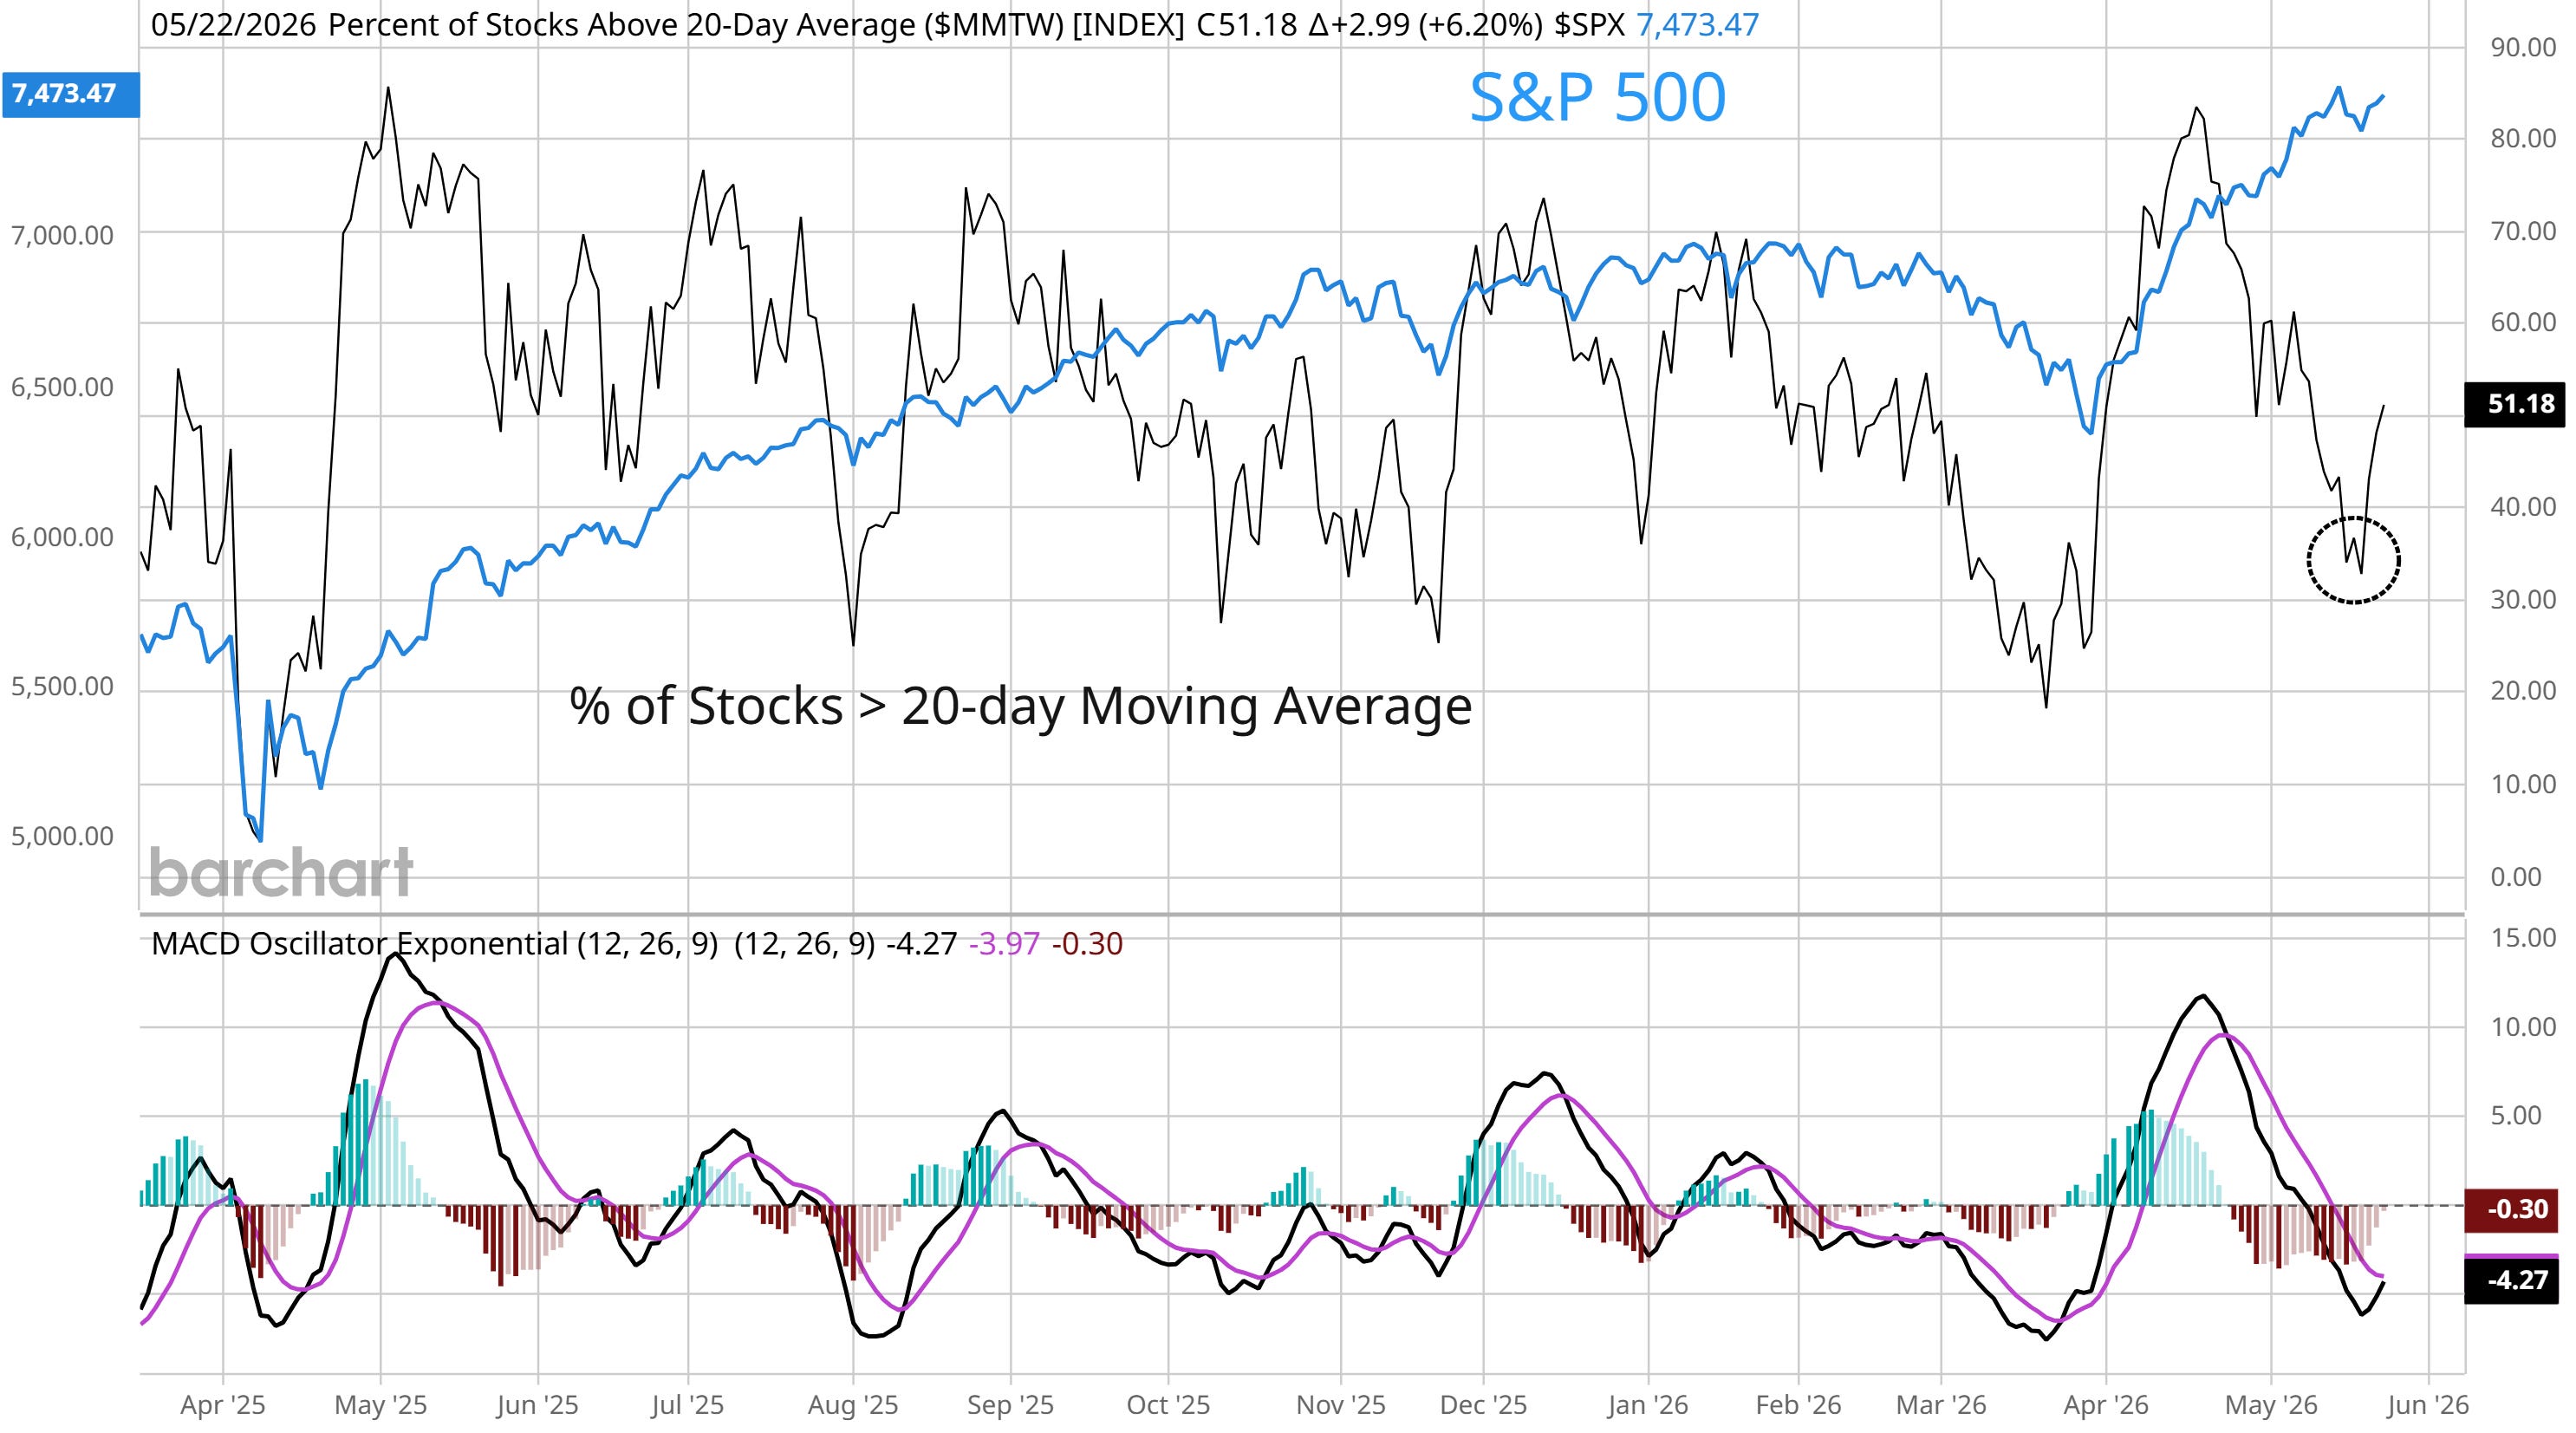
While indexes like the S&P 500 and Nasdaq are holding near record highs as mega-cap stocks linked to AI drive upside, the average stock has been pulling back. The NYSE cumulative advance/decline line has dropped sharply while the percent of stocks trading in short-term uptrends has fallen as well. The percent of stocks across major exchanges trading above their 20-day moving average fell to 33% recently, which is lowest level since the broader market selloff into late March (chart below). But that’s creating an oversold breadth condition, with the percent of stocks in short-term uptrends nearing levels that marked the end of past selloffs. After touching 33% a week ago, the average stock has been turning higher.
Even with the S&P 500 hovering near record highs, various measures of consumer and investor sentiment are turning more negative. The most recent AAII survey of retail investors showed bearish views jumping to 43.6%. That’s well above the long-term average of 31.0% and is the highest level of bears since coming off the correction into late March. Other measures of consumer sentiment are deteriorating as well, including the University of Michigan’s Index of Consumer Sentiment. The index fell to a reading of 44.8 in the most recent update, which is the lowest level ever seen in the history of the report that goes back to the 1950s (chart below).

Heard in the Hub
The Traders Hub features live trade alerts, market update videos, and other educational content for members.
Here’s a quick recap of recent alerts, market updates, and educational posts:
Are stocks due for an oversold bounce?
The average is telling a different story than the index.
A breakout that will have ripple effects across the market.
This same condition appeared before the internet bubble popped.
An energy stock showing relative strength trading near a key pivot.
You can follow everything we’re trading and tracking by becoming a member of the Traders Hub.
By becoming a member, you will unlock all market updates and trade alerts reserved exclusively for members.
Trade Idea
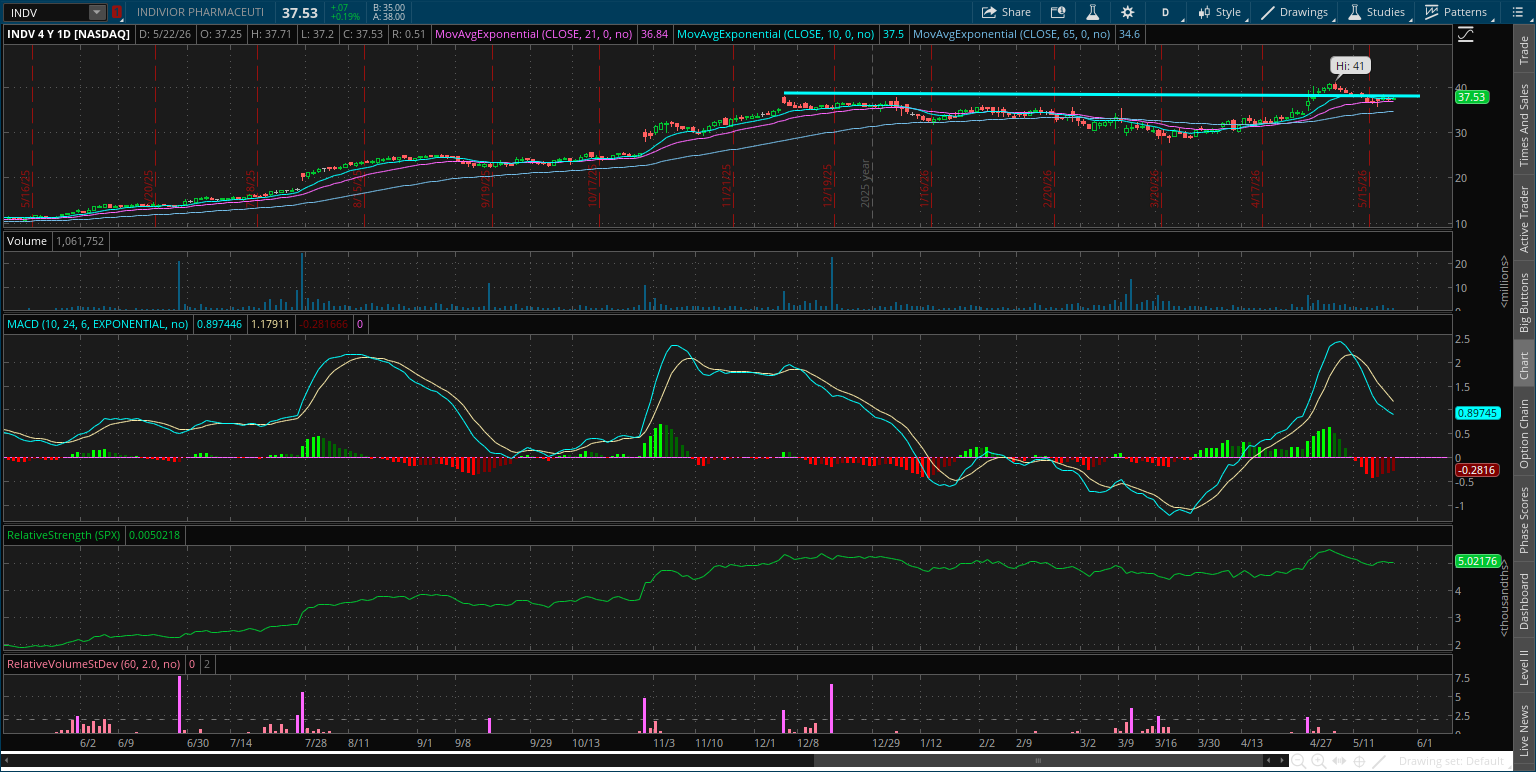
Indivior Pharmaceuticals (INDV)
The stock is progressing through a new basing pattern since December. Recently attempting a move to new highs, but now making a smaller pullback that’s resetting the MACD at the zero line. I’m watching for a move over $40.
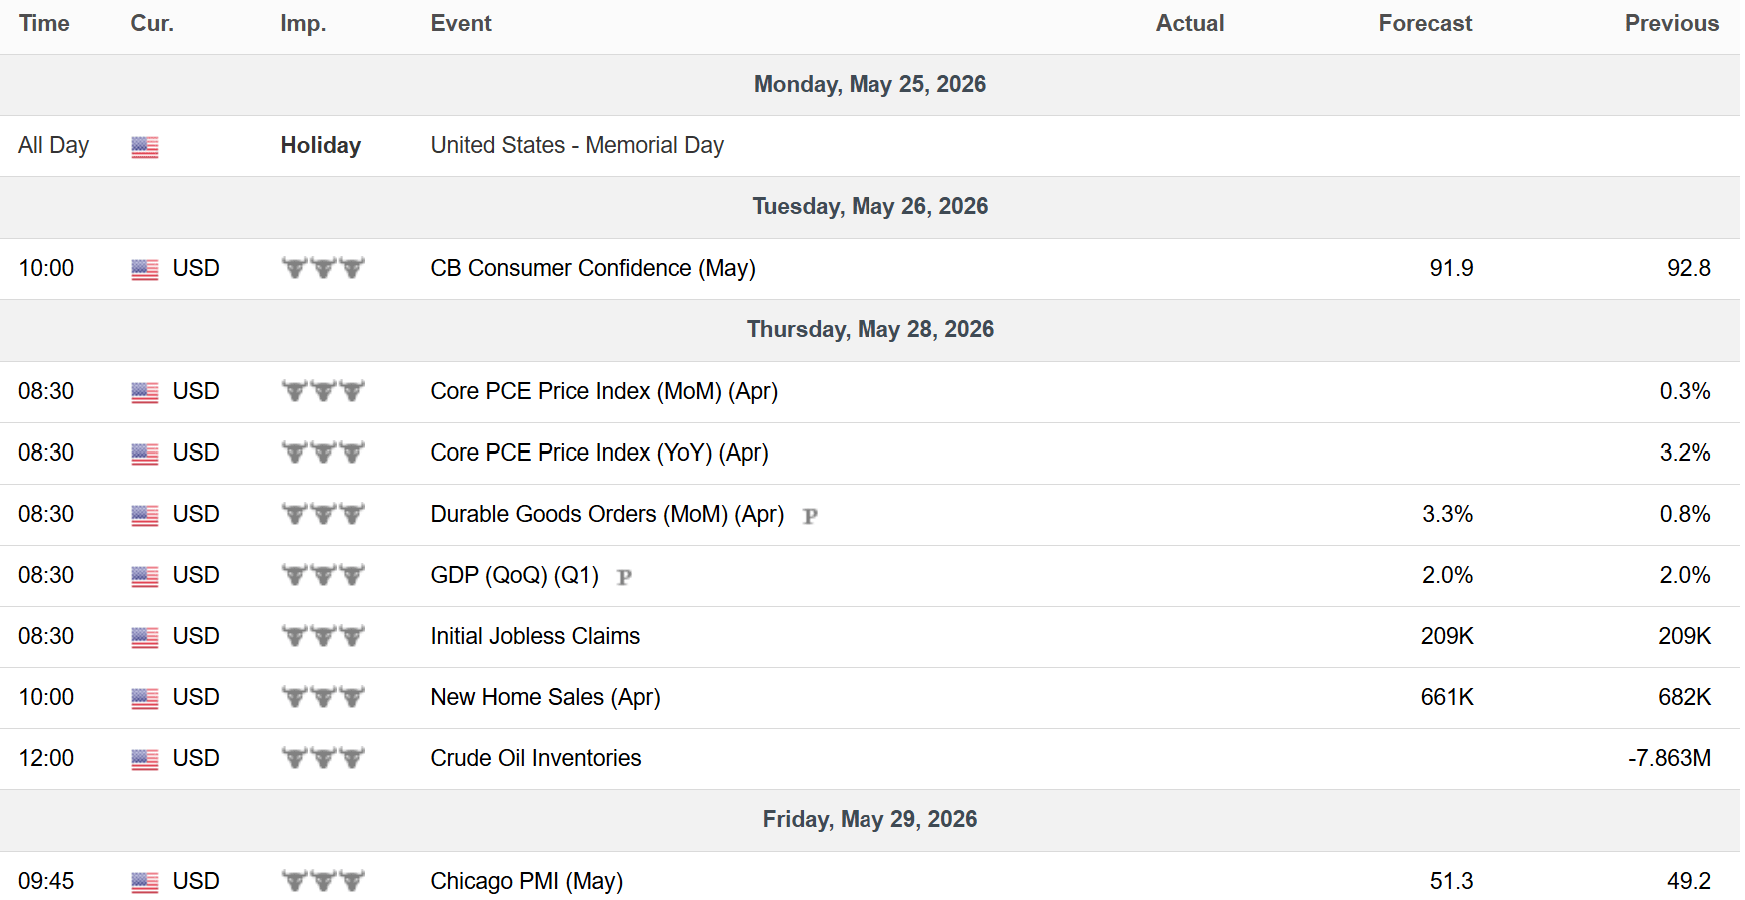
Key Upcoming Data
Economic Reports
Earnings Reports

I hope you’ve enjoyed The Market Mosaic, and please share this report with your family, friends, coworkers…or anyone that would benefit from an objective look at the stock market.
Become a member of the Traders Hub to unlock access to:
✅Model Portfolio
✅Members Only Chat
✅Trade Ideas & Live Alerts
✅Mosaic Vision Market Updates + More
Our model portfolio is built using a “core and explore” approach, including a Stock Trading Portfolio and ETF Investment Portfolio.
Come join us over at the Hub as we seek to capitalize on stocks and ETFs that are breaking out!
And if you have any questions or feedback, feel free to shoot me an email at mosaicassetco@gmail.com
Disclaimer: these are not recommendations and just my thoughts and opinions…do your own due diligence! I may hold a position in the securities mentioned in this report.