The Market Mosaic 5.19.24
Is meme stock mania signaling the S&P 500's top?
Welcome back to The Market Mosaic, where I gauge the stock market’s next move by looking at macro, technicals, and market internals. I’ll also highlight trade ideas using this analysis.
If you find this content helpful please hit that “like” button, share this post, and become a subscriber to this always free report if you haven’t already done so!
And be sure to check out Mosaic Chart Alerts. It’s a midweek update covering chart setups among long and short trade ideas in the stock market, along with levels I’m watching.
Now for this week’s issue…
While news on the inflation front didn’t seem to offer much for stock market bulls, investors found reasons to celebrate anyways.
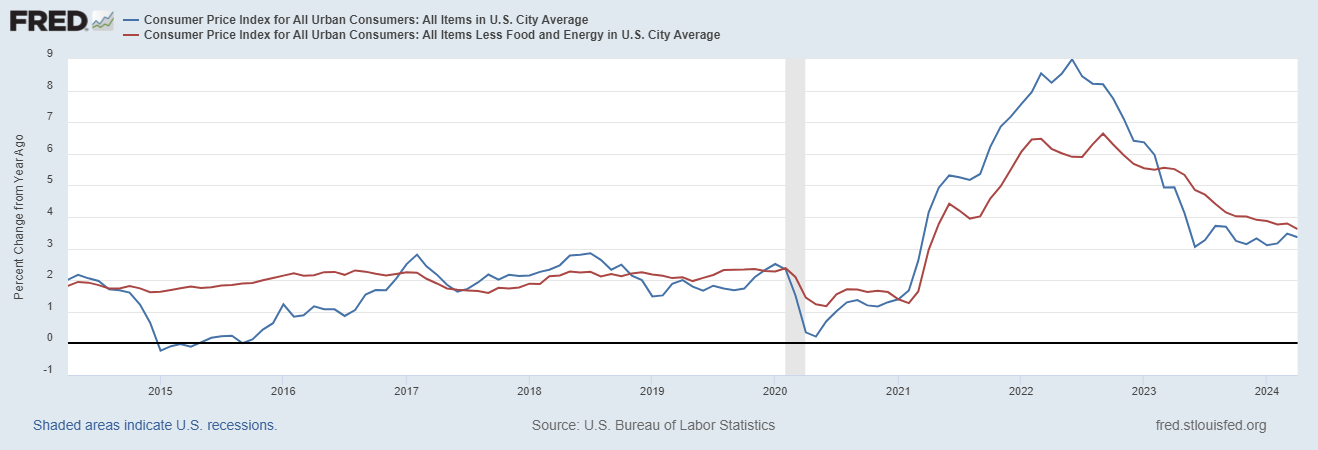
The Consumer Price Index (CPI) rose by 3.4% (blue line in the chart below) in April compared to last year while the core figure that strips out food and energy prices gained 3.6% (red line). Both data points were in line with economist estimates.
Although both readings remain well above the Federal Reserve’s 2% inflation target, things are at least heading in the right direction. As you can see in the chart, the core figure is continuing the trend of disinflation and is at the lowest level in three years.
Despite comments from Fed Chair Jerome Powell that the central bank’s confidence in slowing inflation “is not as high as it was”, market-implied odds took a dovish turn in the interest rate outlook.
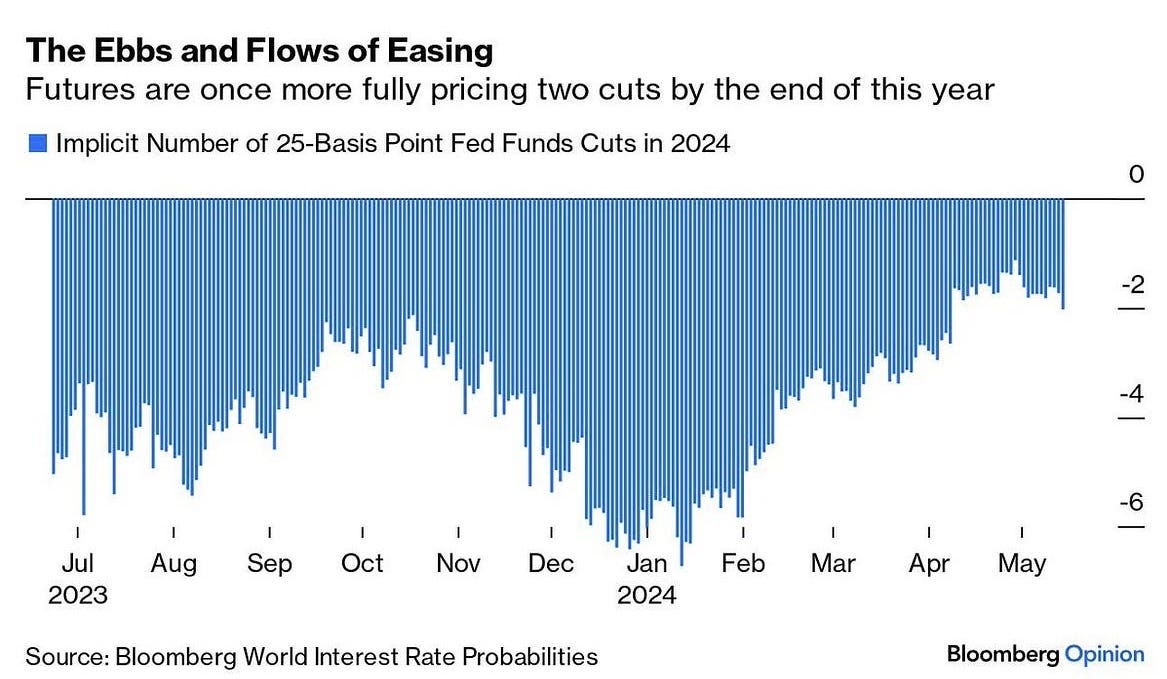
Odds for a rate cut at the Fed’s September meeting now stand at 65%, while there are now two cuts being priced for 2024. The chart below tracks over time how many 0.25% rate cuts are being priced by the futures market for 2024.
After a pricing fewer rate cuts since the start of the year, odds are inflecting in the other direction since late April. That’s sending risk assets soaring, with the S&P 500 tacking on 1.5% for the week to new all-time highs while the Dow Jones Industrial Average rose above 40,000 for the first time ever.
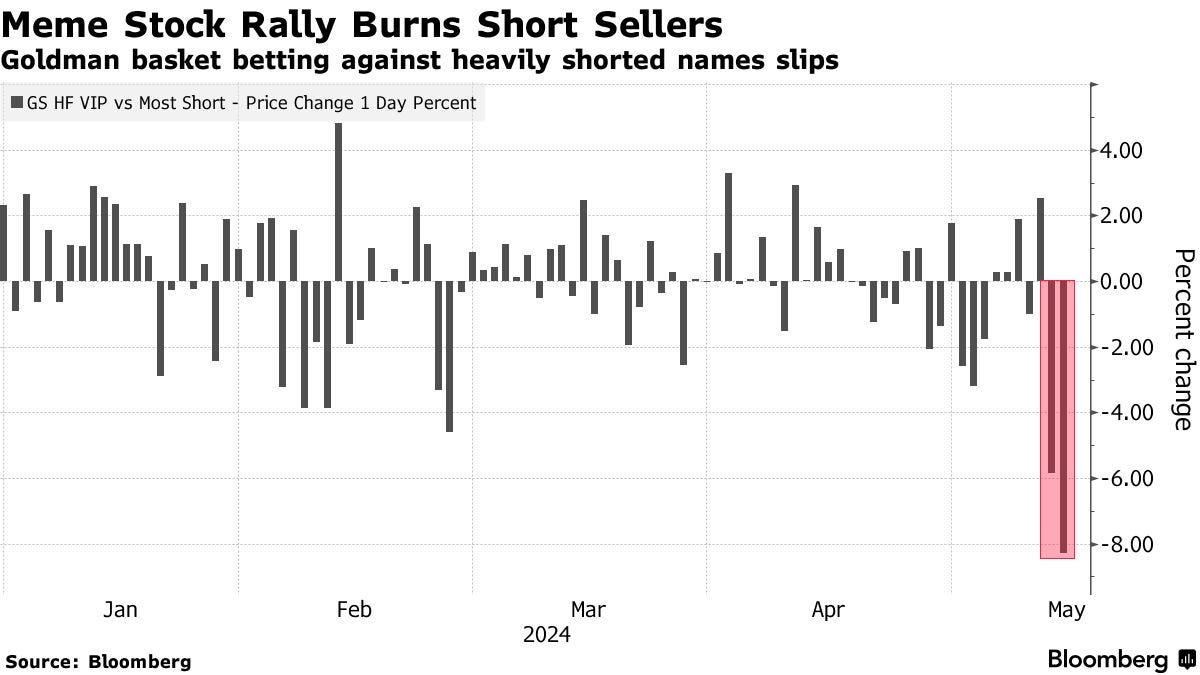
The mood was so euphoric that investors caught another glimpse of meme stock mania, with names like GameStop rising as much as 271% to start the week before flaming out. A basket of top owned stocks relative to those heavily-shorted (like GameStop and AMC Entertainment) fell by 8% in a single day (chart below). At one point early last week, GameStop shorts were sitting on $1.3 billion in losses since the start of May.
The bearish take on the past week’s developments is that it’s wrong to ignore stubbornly high inflation, and the return of meme stock booms and busts shows complacency is everywhere.
But the recent market action is revealing something else important about the underlying backdrop supporting stock prices, and is something that can lead to further gains still.
Not Feeling Stressed
When the S&P 500 bottomed in October 2022, that also marked the turning point in financial conditions. I look at financial conditions as the cost and availability of credit, with loose conditions supporting various asset classes including stocks (and vice versa).
I like to follow the Chicago Fed’s measure that you can access here. As you can see in the chart below, their index (blue line) started tightening about nine months before the Fed embarked on their rate hiking campaign in March 2022, and coincided with the peak in the stock market (red line).
But around mid-2022, conditions stopped tightening as the stock market found a bottom and have been loosening ever since. And despite the Fed’s hold on interest rates at their highest level in over 20 years, conditions are becoming looser still. That shows you there is more than just the level of interest rates impacting credit and liquidity.
That’s why various other signs of falling stress levels in the capital markets is a major tailwind to stock prices, even if it seems like monetary policy should be weighing more heavily.
Like what you’re seeing with high yield bond spreads. Issuers of high yield debt have to pay higher borrowing costs since they are more likely to default. That relative borrowing cost over a safer fixed income asset like U.S. Treasuries can fluctuate, reflecting the probability of defaulting. That means the relative borrowing cost, or spread, is sensitive to the economic outlook and is a big factor in financial conditions.
But as you can see in the chart below, the spread on high yield bonds are hovering near the lowest levels of the past 27 years. That’s having a big impact on loosening financial conditions, and is a positive reflection on the economic outlook and appetite for riskier assets.
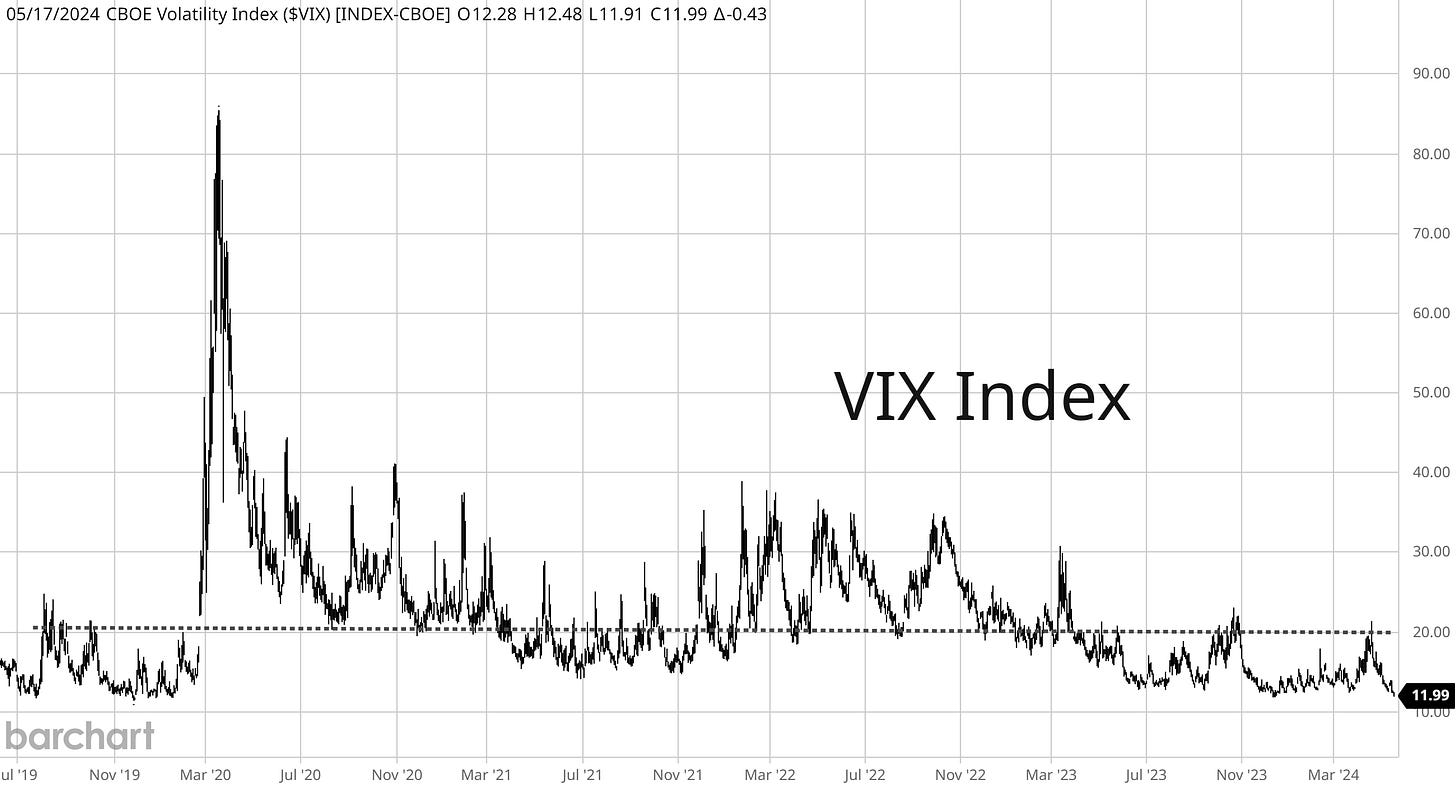
Signs of stress in the stock market are running at low levels as well, and can create a feedback loop of fund flows into the stock market. The Volatility Index (VIX) tracks expected volatility for the S&P 500.
Expected volatility levels (VIX chart below) in stocks can have a significant impact on how risk-parity and other volatility-targeting strategies position their funds. These strategies operate based on a “risk budget”, and if stock market volatility (i.e. risk) is coming in lower these institutional investors tend to allocate more to equities.
I put a dashed line at 20 in the VIX chart, which is around the long-term average for the VIX and can mark a shift from high-vol to low-vol regimes. You can see that we’ve mostly been in a lower volatility regime since early 2023, with the VIX recently moving toward the lowest levels of the past five years.
Various indicators point to low stress in the capital markets and a good liquidity backdrop overall, which is good for stocks. And despite the recent gains, the S&P 500 is lagging the typical gain seen during cyclical bull markets while the average duration of past bull markets suggests there is room to run as well.
Now What…
While most of the attention last week was on surging meme stocks, other important developments were happening under the hood. That includes the expansion in net new 52-week highs across the stock market.
Oversold breadth in mid-April gave way to positive breadth divergences. Now last week is seeing an expansion of net new highs (chart below) to the best level since the end of March, when the S&P 500 was last making new all-time highs.
That shows it’s more than just GameStop and AMC participating in the recent gains in the stock market. And historical precedent suggests that this bull market has much further to run. The table below looks at the S&P 500’s cyclical bull markets going back to the 1940s.

The average bull market lasts a little over five years, and gains nearly gains 58% two years into the run. This current bull market is still less than two years old, and has more upside into the two year anniversary this October based on the historical averages.
But in order for more gains to materialize, I maintain that earnings need to take the baton in driving further upside in stock prices. And there’s good new developing on the economic and corporate earnings outlook.
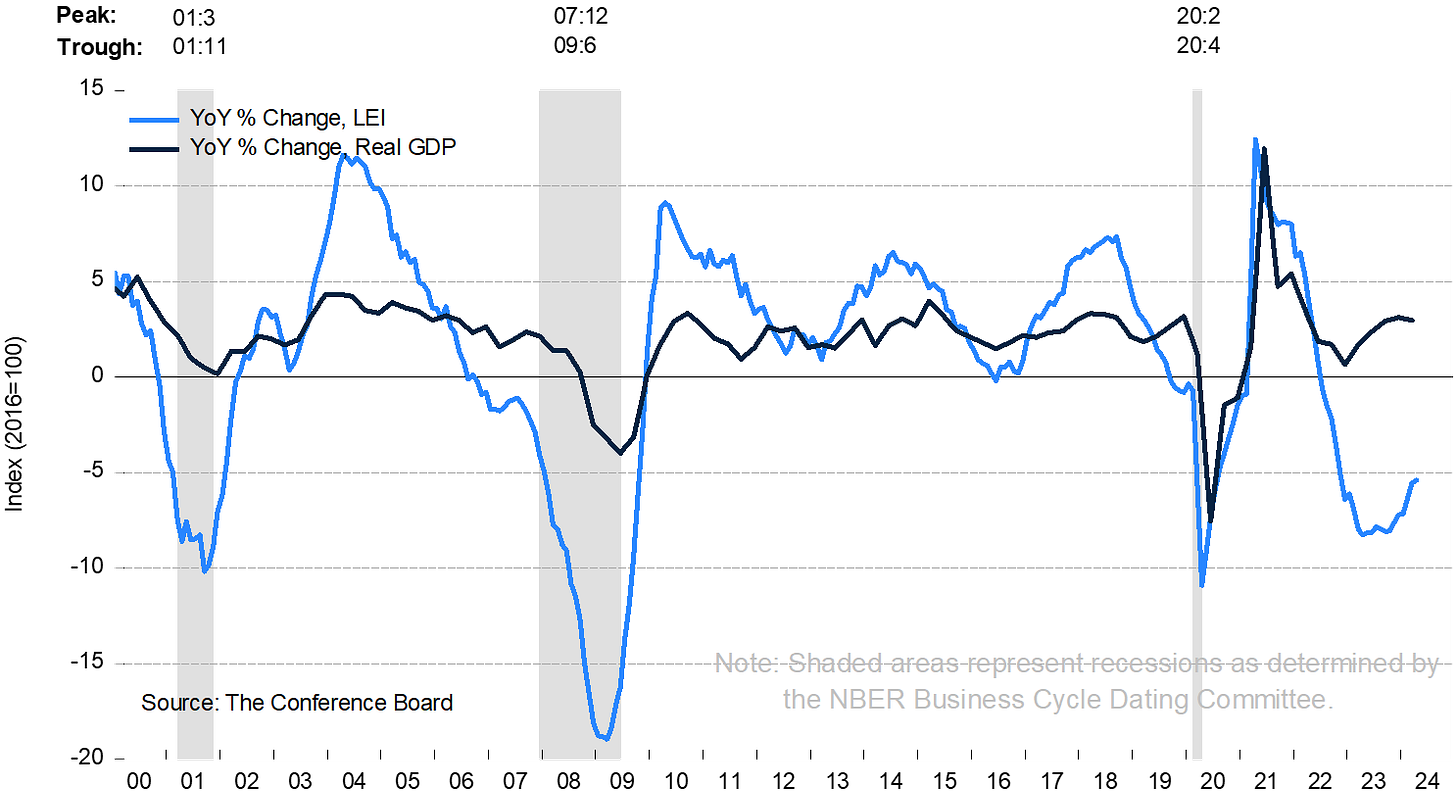
Loose financial conditions are also associated with driving positive economic activity. Amidst last week’s inflation reports and meme stock headlines, many didn’t catch the updated report on the Conference Board’s Leading Economic Index (LEI).
While the monthly change fell 0.6% in April compared to March, the yearly rate of change keeps improving (chart below). That’s the most important LEI metric to watch in my opinion, with an improving rate of change off a low level also the best regime for stock returns historically.
I’ve also maintained that if a good economy is ahead of us, then resource and commodity sectors should be receiving a boost (or hinting through their chart setups that a boost is on the way).
You’ve already seen cooper prices, which are sensitive to developments with the economy, breaking out to new all time highs. Two months ago I highlighted the chart setups in copper and mining company Freeport-McMoRan (FCX) suggesting breakouts, and the positive implications that would have on the economic outlook.
Other breakout setups are still developing in commodity sectors. The XLE energy sector exchange-traded fund is setting up in a bullish flag pattern just below prior highs at the $100 level that I covered here.
There’s also the Invesco Commodity Index Tracking Fund (DBC) turning up from support at the 50-day moving average (chart below). The fund is potentially making a bullish “inverse head and shoulders” pattern just below resistance at the $24 level. The recent pullback reset the MACD at the zero line while the RSI held support at the 40 level.
That’s all for this week. Following a week heavy on key economic releases, the calendar is much quieter this week. There will be plenty of speakers from the Fed making speeches, so that can provide insight on rate path following the most recent CPI report. But with asset prices responding to loose financial conditions, I’ll look for confirmation from more commodity sectors that conditions are boosting the economy as well.
P.S.
Don’t forget to join me in Substack’s Chat feature!
I want to be more active in highlighting how trade setups are developing and breaking out. But I don’t want to flood your email inbox constantly with updated thoughts and analysis.
So I found the Chat to be a good place to share trade ideas…like I’ve already highlighted with ITRI recently and URA just last week.
You can get to the chat from my homepage at mosaicassetco.com.
But it’s also easy to access the Chat on Substack’s app, which you can get by clicking this link. Substack Chat should work on both iOS and Android.
I hope you’ve enjoyed The Market Mosaic, and please share this report with your family, friends, coworkers…or anyone that would benefit from an objective look at the stock market.
And make sure you never miss an edition by subscribing here:
For updated charts, market analysis, and other trade ideas, give me a follow on X: @mosaicassetco
And if you have any questions or feedback, feel free to shoot me an email at mosaicassetco@gmail.com
Disclaimer: these are not recommendations and just my thoughts and opinions…do your own due diligence! I may hold a position in the securities mentioned in this report.


