
The Market Mosaic 5.18.25
Will the Moody's U.S. credit downgrade wreck the rally?

👋Welcome back to The Market Mosaic, where I gauge the stock market’s next move by looking at macro, technicals, and market internals. I’ll also highlight trade ideas using this analysis.
If you find this report helpful please hit that “like” button, share this post, and become a subscriber if you haven’t already done so!
🚨And be sure to check out Mosaic Traders Hub. It’s a members-only platform to alert trade ideas, track a model portfolio of open positions, and further analyze the message coming from the capital markets.
Now for this week’s issue…
Easing trade tensions between the U.S. and China delivered a spark that kept the stock market rally intact.
While the U.S. and China didn’t exactly come to a deal, they did announce a 90-day pause on significantly higher tariff rates. The U.S. will cut the tariff rate on Chinese imports to 30% from 145%. China is cutting the tariff on U.S. imports to 10% from 125%.
The pause will allow trade negotiations to continue. But the de-escalation in tensions was enough to drive equity markets higher through key levels. The S&P 500 jumped over 5% on the week which took it above the 200-day moving average (MA - green line) in the chart below. That was also the next price resistance level at the 5800 area (shaded area).

The stock market was also buoyed by softer than expected inflation data. The Consumer Price Index (CPI) came in lower than expected. The headline figure came in at 2.3% year-over-year for April, which is the lowest level since early 2021. The core figure that strips out food and energy increased by 2.8% which matched estimates.
But just as the weekend got started, Moody’s came out with a surprise downgrade. The bond-rating agency cut the U.S. credit rating from its top Aaa rating to Aa1. Moody’s cited the nation’s rising debt level, which stands at $36 trillion, along with increasing interest costs as the catalyst for the downgrade.
Moody’s was the last of the three major credit rating agencies to cut the U.S. rating from top-ranked territory. At the same time, negative breadth divergences and bullish investor sentiment are appearing.
This week, let’s look at what stock market price thrusts means for forward returns, and why near-term bearish conditions are spreading across breadth and sentiment data. We’ll also look at why the market is beginning to price fewer interest rate cuts ahead despite cooler inflation data.
The Chart Report
The extreme stock market reaction to tariffs and trade tensions highlights the binary nature of the trade war, especially with China. Bad news and rising tensions sent stocks crashing, while easing tensions and a pause on much higher tariff rates has sent the S&P 500 back toward the prior all-time highs. While the U.S. runs a $295 billion trade deficit with China, companies in the S&P 500 collectively generate $1.2 trillion in sales from China (chart below). That’s 7% of total revenues for the S&P 500, and shows the risk to earnings from a trade war.

The surge in the S&P 500 is surpassing levels associated with extreme price thrusts. The index is up more than 18% in just 25 trading days, which has only happened six times in the past 50 years. Similar to breadth thrusts tracking the ratio of advancing stocks to declining issues, price thrusts have historically been positive for forward market returns. The chart below shows returns for the S&P 500 following a 25-day advance of 18% or more. A year later, the index was up every time with an average gain of 30%.

While price and breadth thrusts bode well for forward longer-term returns, breadth divergences show bearish conditions are clouding the near-term outlook. The chart below shows the percent of stocks trading above their 20-day moving average. The percent of stocks across the market in a short-term uptrend made a lower high as the S&P 500 has continued rallying (dashed lines in the chart below). That means there are fewer stocks in short-term uptrends relative to the start of May even as the S&P 500 has moved higher.

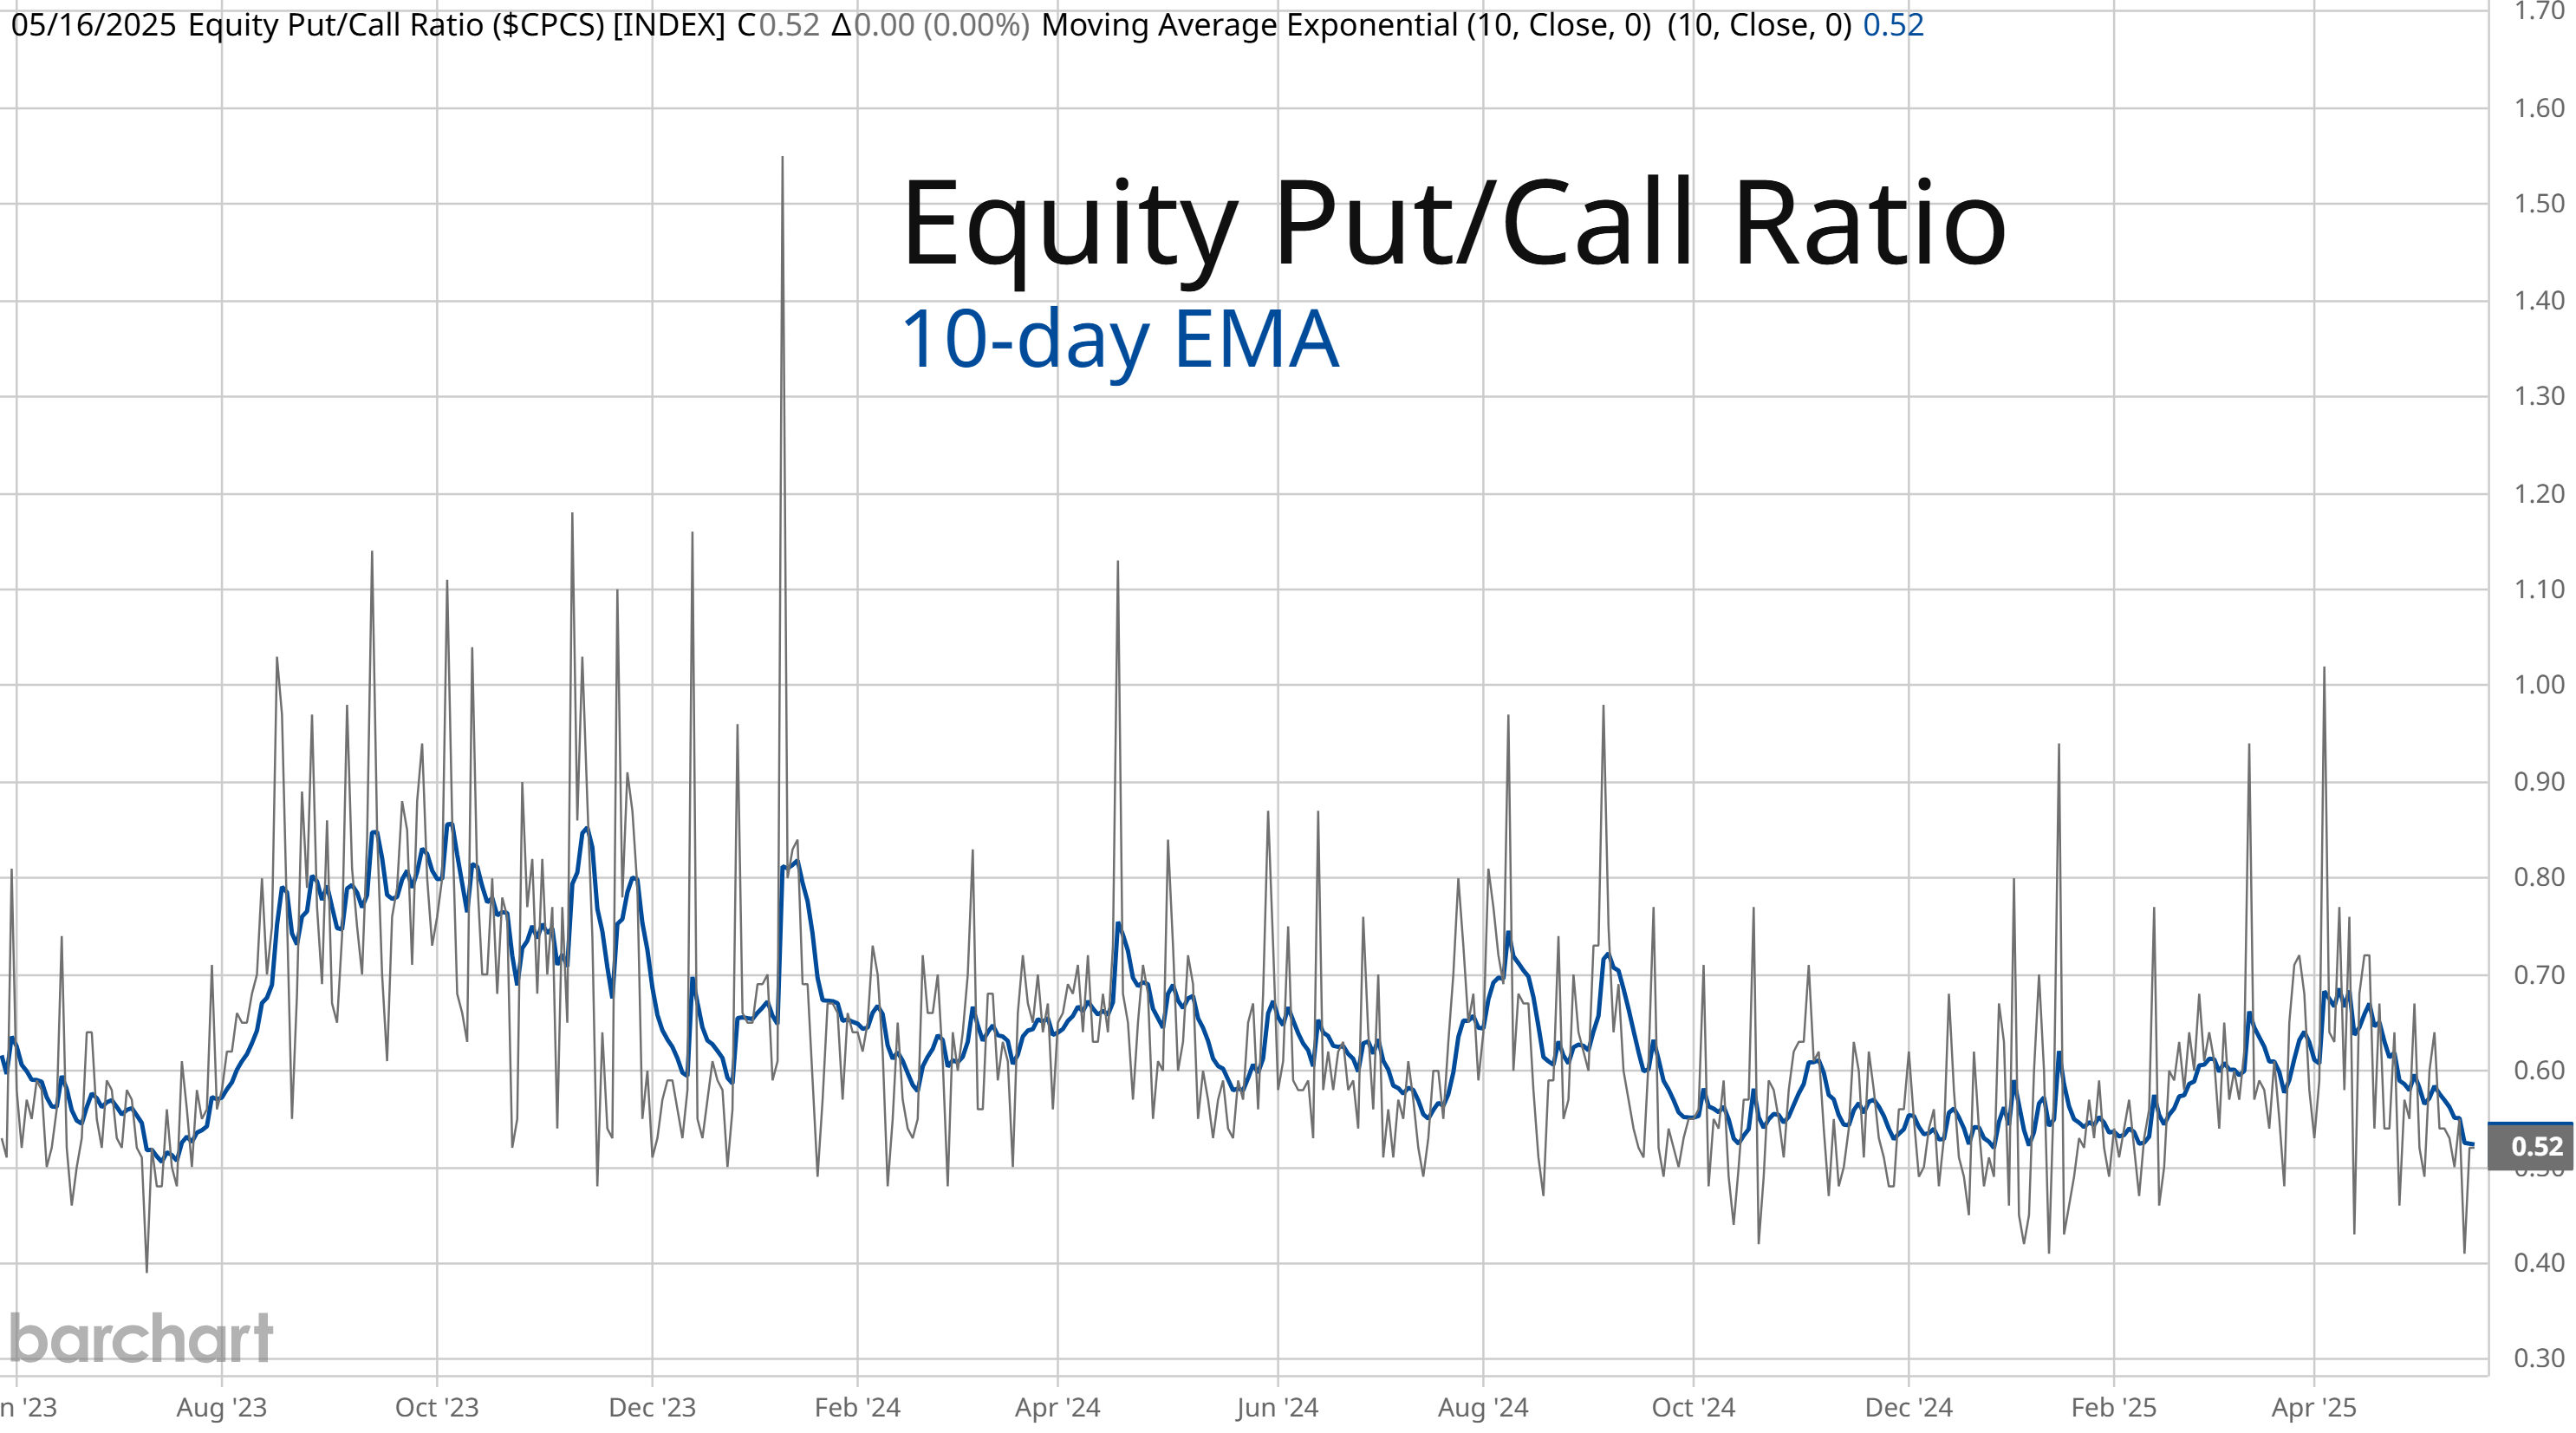
At the start of April, several measures of investor sentiment were showing extreme bearish views. With the rally in the S&P 500, sentiment has quickly swung back into greed territory and too much bullishness. CNN’s Fear & Greed Index is hovering just below “extreme greed”. Data tracking put and call option volumes also shows investors are loading into bullish bets. In early April, the put/call ratio hit the highest level in a year as investors made bearish bets. That aligned with the low in the stock market. Last week, that ratio fell to one of the lowest levels of the past couple years as call volumes jumped relative to puts.
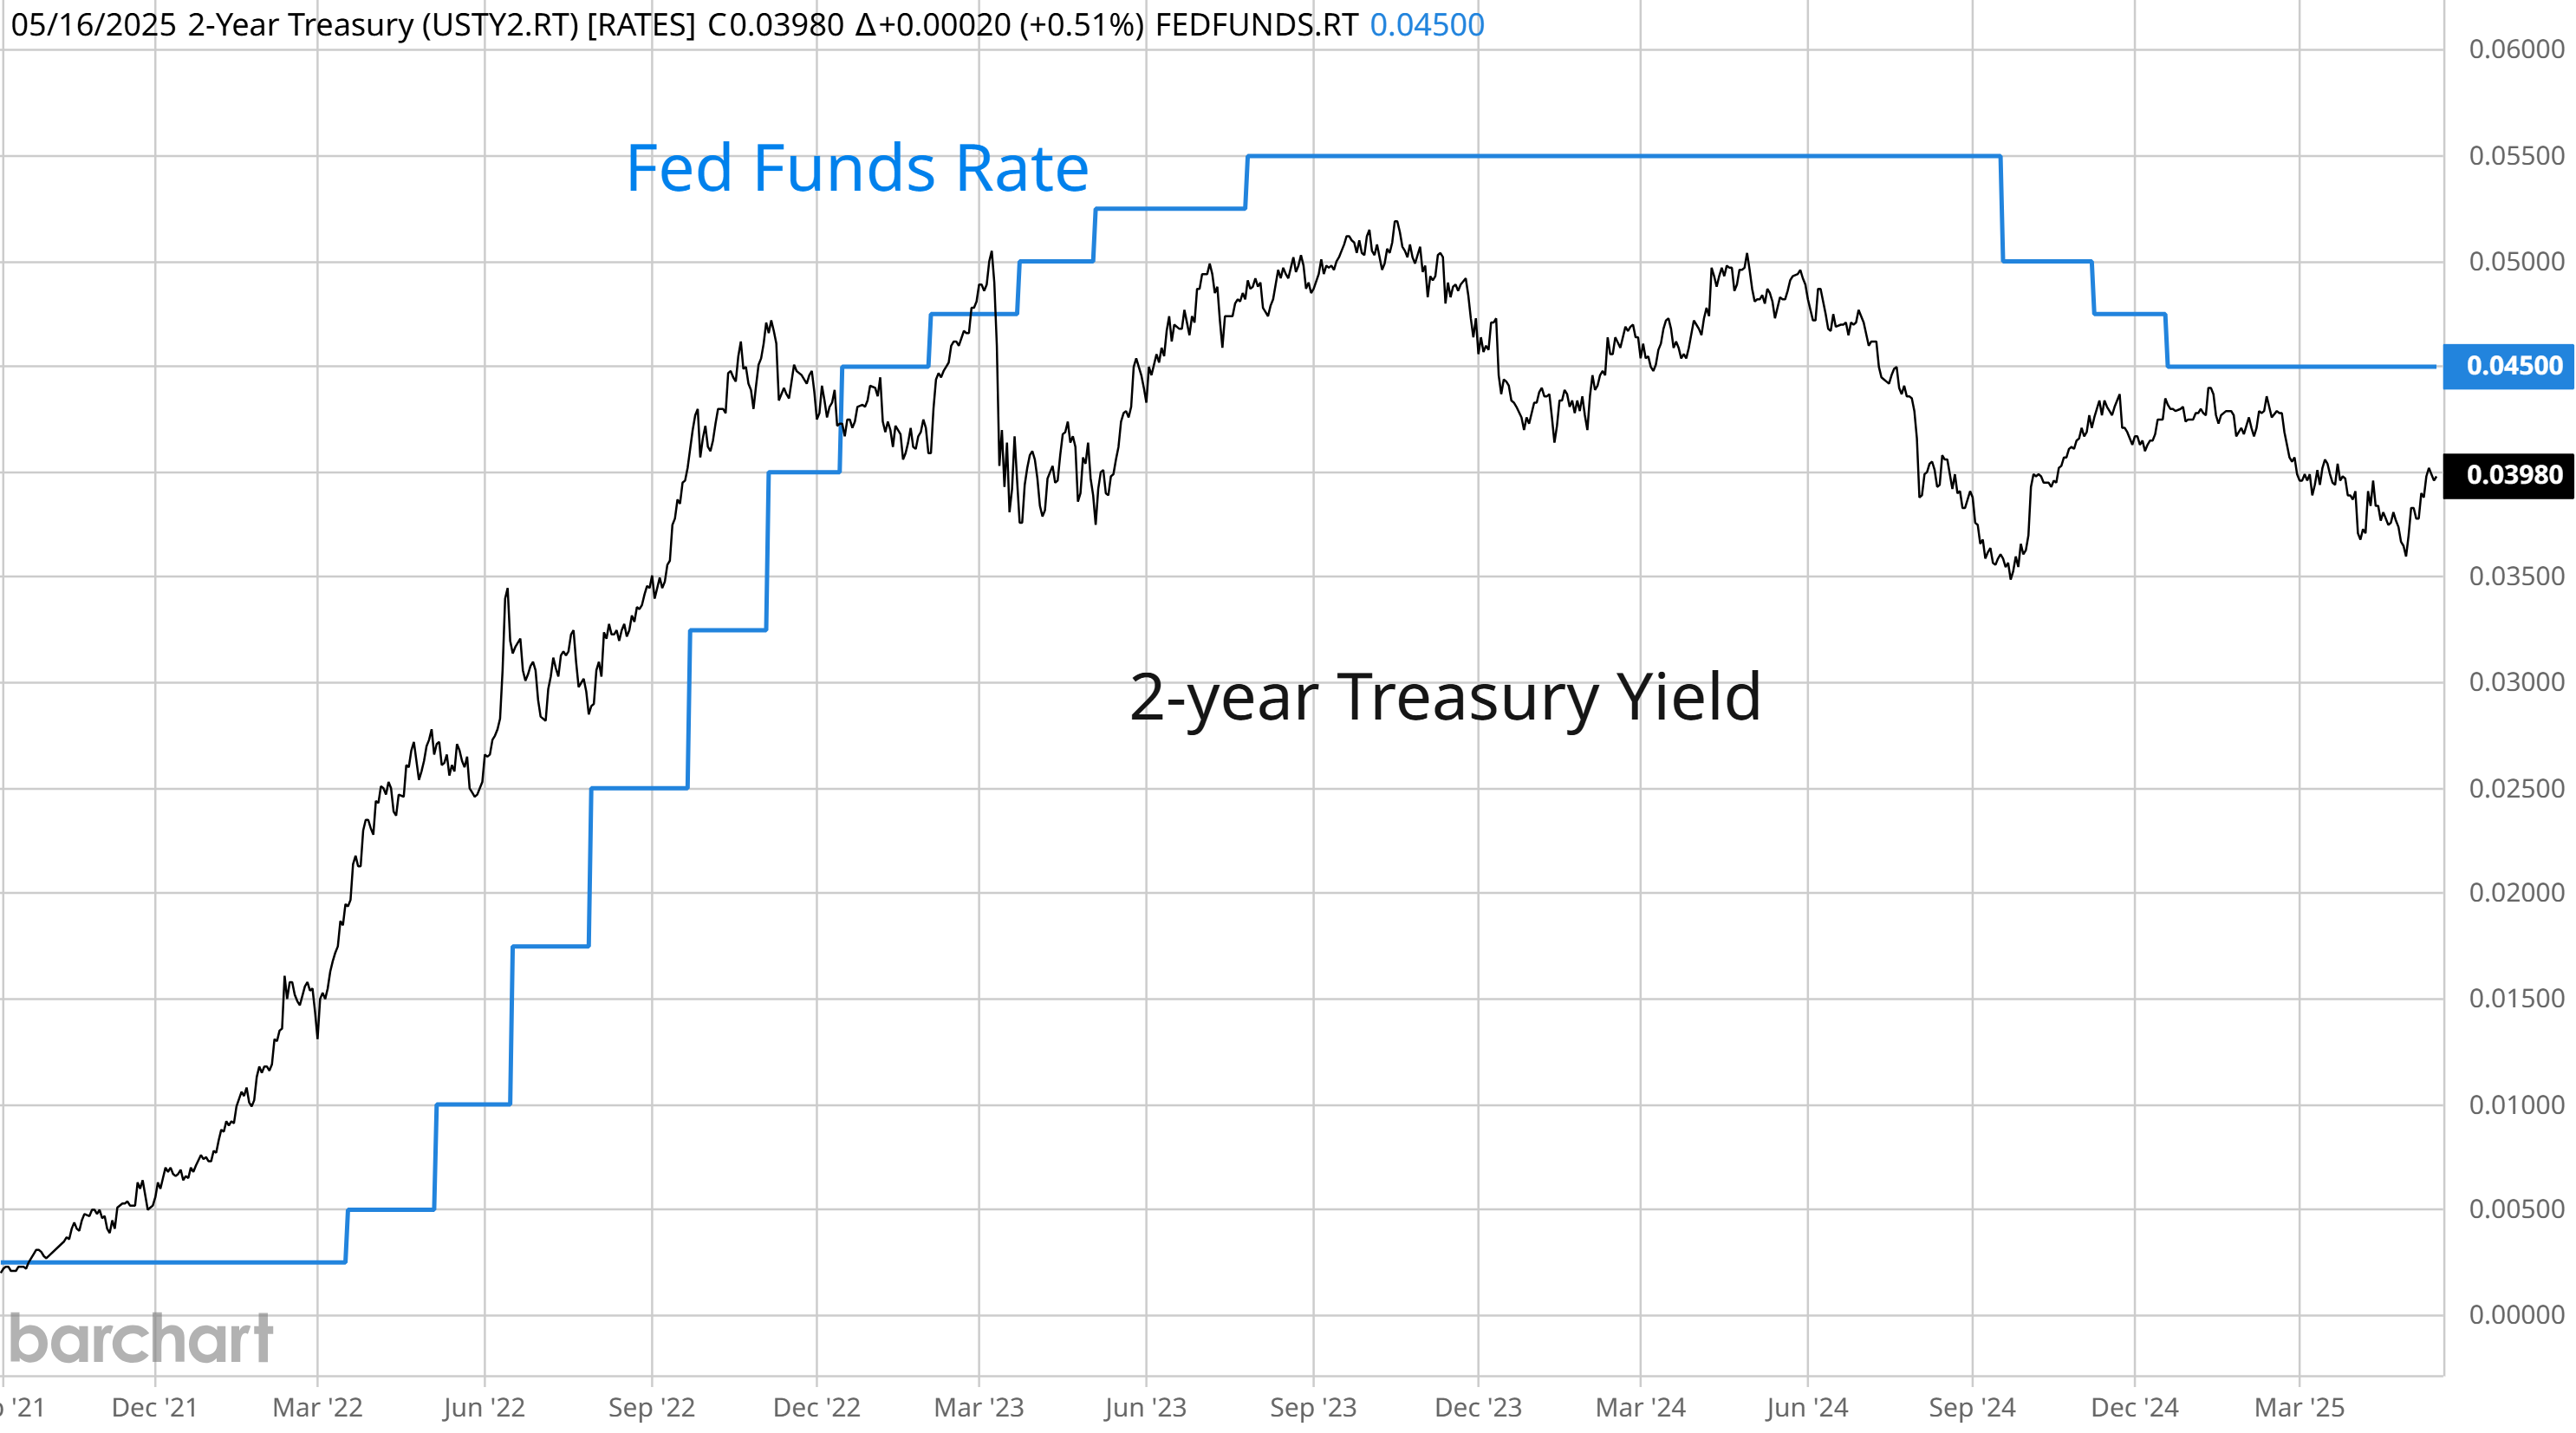
Last week featured cooler than expected inflation reports across both consumer and producer gauges. While that may support more interest rate cuts by the Federal Reserve this year, the level of the 2-year Treasury yield is suggesting otherwise. The chart below shows the 2-year against the fed funds rate. The 2-year can lead changes in fed funds, and is moving higher toward current fed funds since the start of May. The 2-year yield is now around 0.50% below fed funds, suggesting just two quarter-point rate cuts ahead.
Heard in the Hub
The Traders Hub features live trade alerts, market update videos, and other educational content for members.
Here’s a quick recap of recent alerts, market updates, and educational posts:
A new pattern to follow in the market’s leading stocks.
The setup in Spotify’s (SPOT) chart and my trading plan.
How the “rate of change” in liquidity is a bullish catalyst.
Easing trade tensions are fueling a risk-on move across the market.
How to use breadth and sentiment indicators to forecast stock trends.
You can follow everything we’re trading and tracking by becoming a member of the Traders Hub.
By becoming a member, you will unlock all market updates and trade alerts reserved exclusively for members.
👉You can click here to join now👈
Trade Idea
Ollie's Bargain Outlet Holdings (OLLI)
Developing a base-on-base after moving above the $100 level in December. The stock is back testing that level as support several times, while making a new resistance level at $120. Watching for a smaller pullback off that level to reset the MACD above zero followed by a breakout.

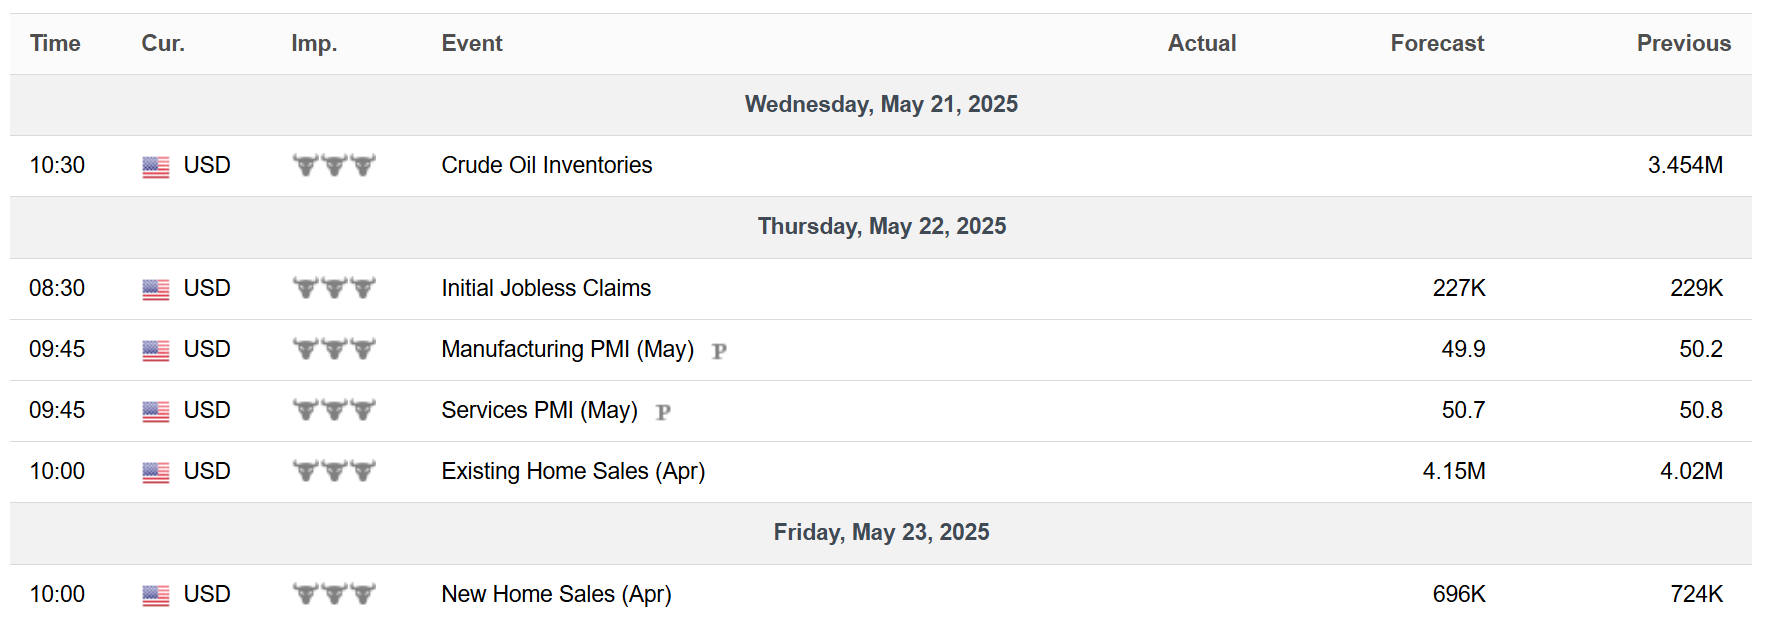
Key Upcoming Data
Economic Reports
Earnings Releases

I hope you’ve enjoyed The Market Mosaic, and please share this report with your family, friends, coworkers…or anyone that would benefit from an objective look at the stock market.
Become a member of the Traders Hub to unlock access to:
✅Model Portfolio
✅Members Only Chat
✅Trade Ideas & Live Alerts
✅Mosaic Vision Market Updates + More
Our model portfolio is built using a “core and explore” approach, including a Stock Trading Portfolio and ETF Investment Portfolio.
Come join us over at the Hub as we seek to capitalize on stocks and ETFs that are breaking out!
And if you have any questions or feedback, feel free to shoot me an email at mosaicassetco@gmail.com
Disclaimer: these are not recommendations and just my thoughts and opinions…do your own due diligence! I may hold a position in the securities mentioned in this report.