
The Market Mosaic 5.17.26
Rising Bond Turmoil Threatens to Drag Stocks Lower.

👋Welcome back to The Market Mosaic, where I gauge the stock market’s next move by looking at macro, technicals, and market internals. I’ll also highlight trade ideas using this analysis.
If you find this report helpful please hit that “like” button, share this post, and become a subscriber if you haven’t already done so!
🚨And be sure to check out Mosaic Traders Hub. It’s a members-only platform to alert trade ideas, track a model portfolio of open positions, and further analyze the message coming from the capital markets.
Now for this week’s issue…
The impact on energy prices from the war in the Middle East is pushing inflation to its highest level in years.
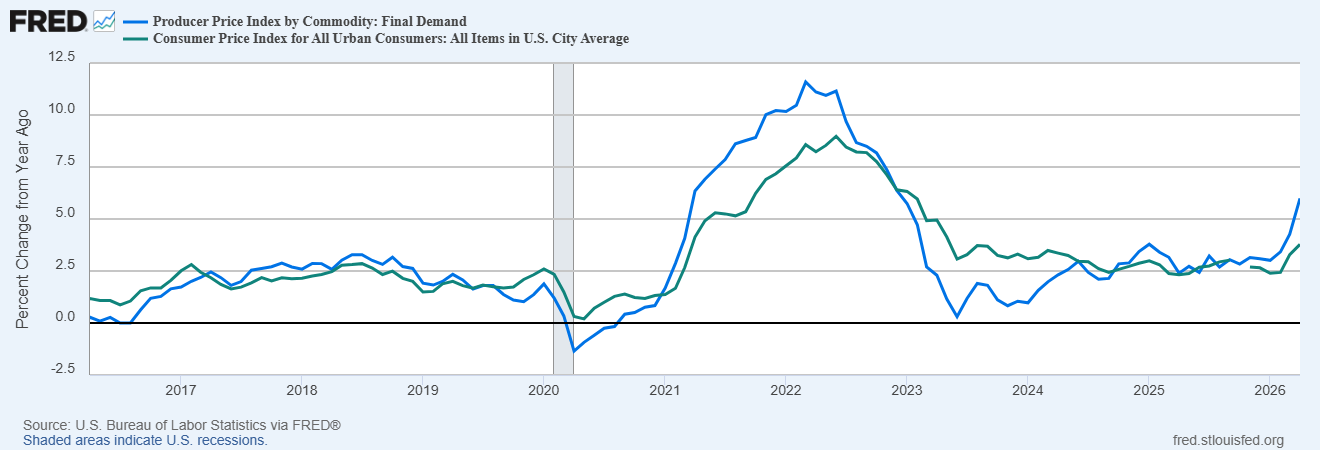
The Consumer Price Index (CPI) increased by 3.8% in April compared to last year, which is the largest gain in nearly three years. The Producer Price Index (PPI), which tends to lead changes in the CPI, increased by 6.0% in April and was the largest gain since the end of 2022.
While a spike in energy prices are helping drive inflation higher, the most recent reports continue a trend of growing price pressures. The chart below plots the year-over-year change in CPI (green line) and PPI (blue line) for the past 10 years.
Investors initially shrugged off the inflation reports and sent the S&P 500 and Nasdaq to fresh record highs. But a quickly evolving outlook for monetary policy and jump in longer-dated yields was felt at the end of the week.
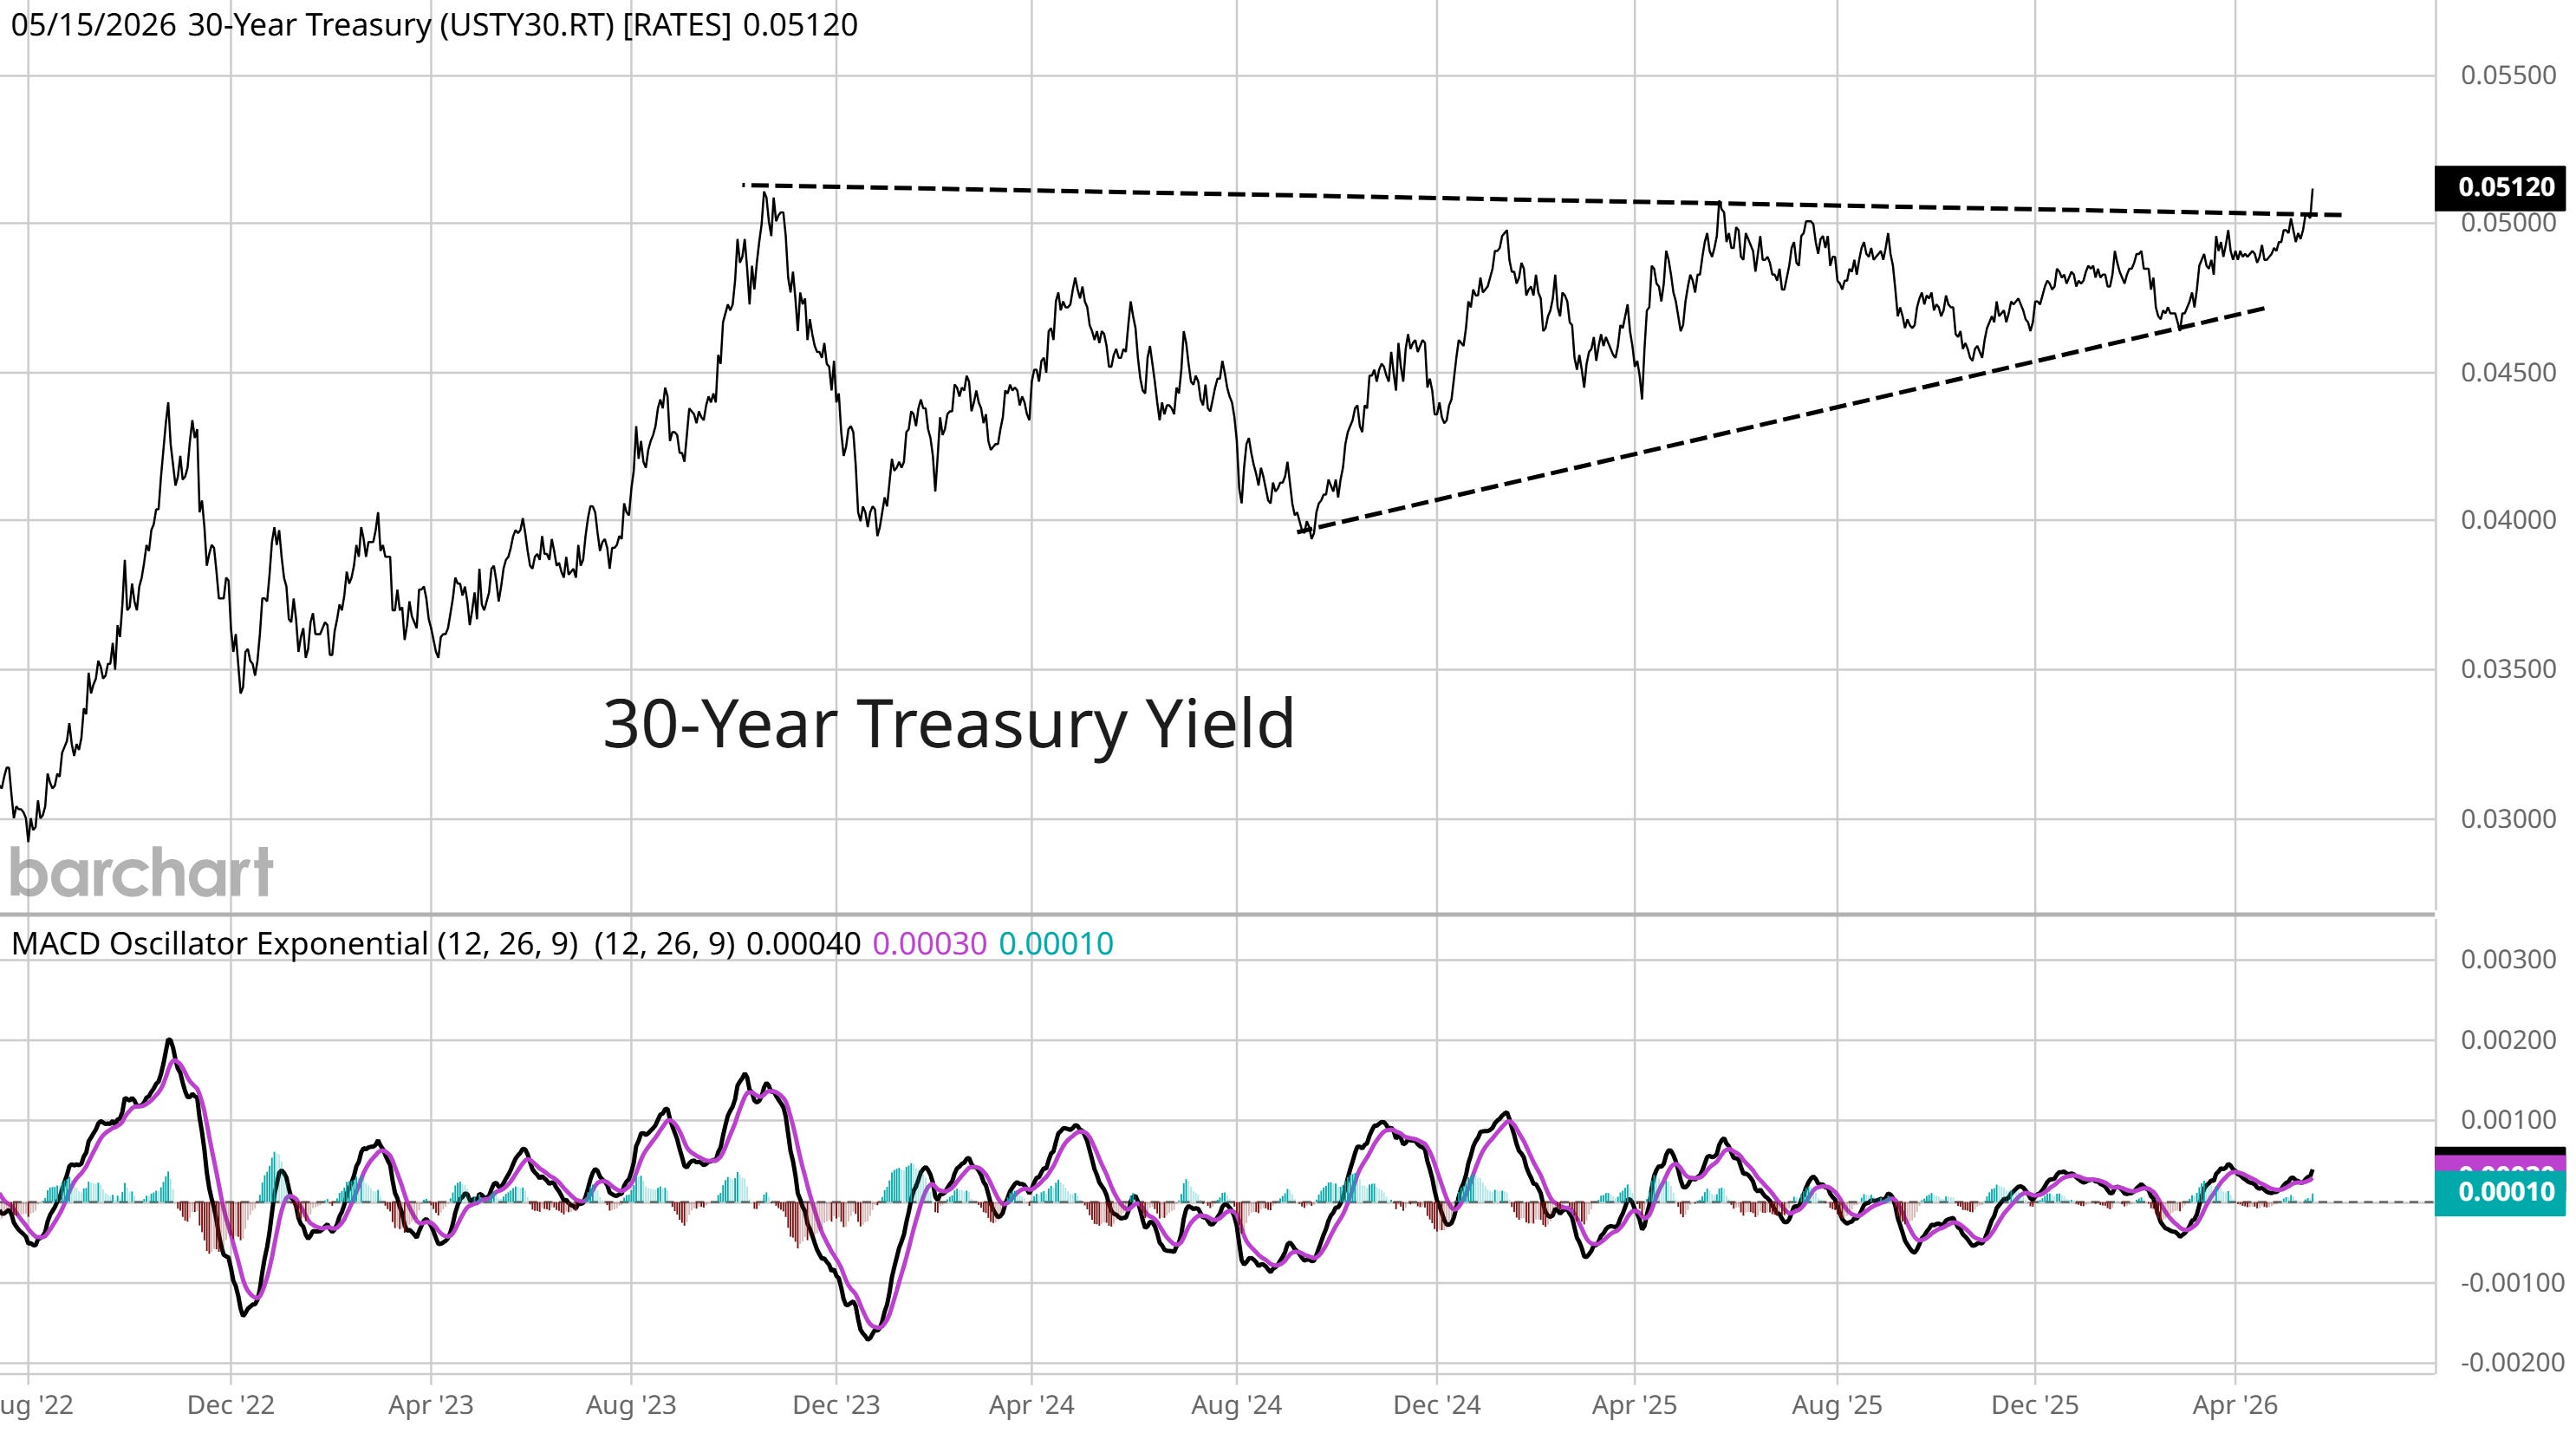
On Friday, the 30-year Treasury yield jumped above the 5% level which is the high tested several times over the past couple years. A sustained breakout could have serious implications at a time when federal debt and deficit spending is surging.
The rate outlook on the short-end of the yield curve is becoming more hawkish as well. Market-implied odds now favor a rate hike within the next six months. That comes as Kevin Warsh looks set to become the next Federal Reserve chairman, who is under intense political pressure to cut rates.
While the narrative of positive earnings revisions on soaring AI capex spending is helping drive the S&P 500 to a 17% gain since the end of March, the impact of rising rates on valuations and financial conditions could challenge the rally.
This week, let’s look at signs that inflation is becoming a bigger problem beyond an energy-drive gain in headline measures and why the next big inflation wave could be underway. We’ll also look at why equities struggle in rising inflation environments and the implications of a breakout in longer-dated interest rates.
The Chart Report
Many investors and economists are hopeful that a resolution to the war in the Middle East means an energy-driven jump in inflation will be temporary. But other inflation measures show that pressure in key core categories that exclude food and energy prices are inflecting higher as well. The chart below shows several categories of core inflation. Core services ex-housing, which is also called supercore inflation, increased by 3.3% in April (light blue line in the chart below) and is the biggest gain since February 2025. Back in 2022, outgoing Fed chair Jerome Powell called supercore inflation “the most important category for thinking about future inflation down the road” since it tracks underlying price pressures in labor intensive industries.

Various inflation catalysts are coming together at the same time and share many similarities with the wave into mid-2022. Supply chain upheaval from the trade war, a spike in energy prices, and stimulus from federal deficit spending including the One Big Beautiful Bill are all impacting the economy at the same time. Back in 2022, you had supply chain disruptions from the pandemic, stimulus to support the economy, and Russia’s invasion of Ukraine that spiked oil prices. Consumer inflation is following another track, and that’s with the inflation cycle of the 1970s. The chart below compares CPI since 2014 (green line) with how CPI evolved from 1966 through 1982. If the cycle continues tracking, CPI is on the verge of another spike higher.

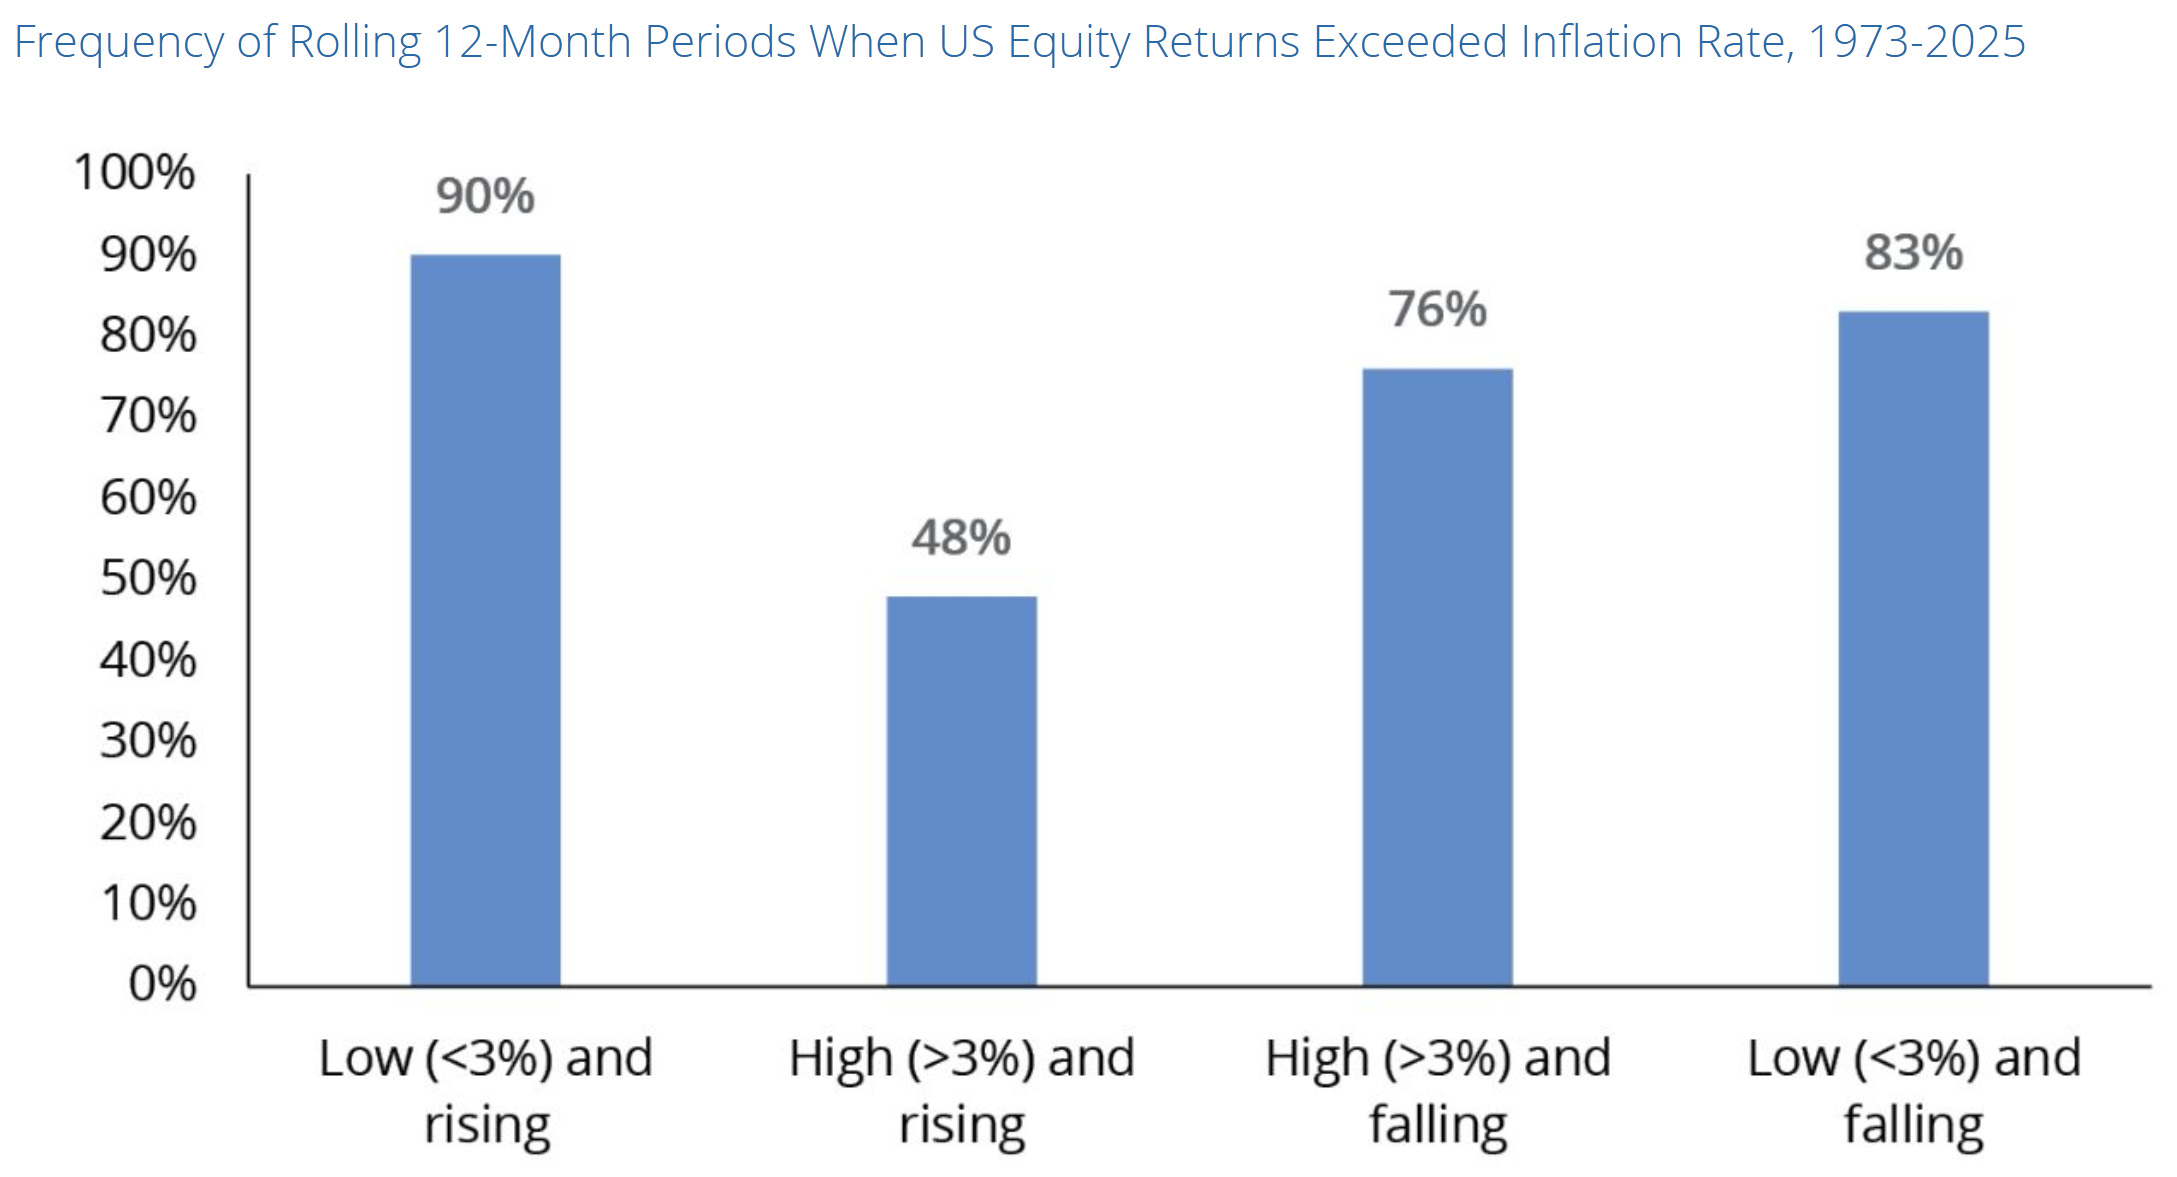
The stock market has been resilient despite numerous challenges facing the economy and war in the Middle East. Surging AI capex is helping drive positive earnings revisions, which is helping to boost indexes that are heavily weighted in AI-related stocks. But the impact of inflation on the stock market shouldn’t be ignored especially as various inflation gauges inflect higher. The chart below shows the percent of time historically that U.S. equity returns exceed the rate of inflation under different inflation regimes. You see that high and rising inflation tends to exert the biggest negative impact on stock returns, which is the regime the economy is currently facing.
Rising inflation is a headwind to equity returns due to the impact on interest rates across the yield curve. Higher inflation triggers a hawkish response from central banks that move to tighten monetary policy and push rates higher on the short-end. Yields on longer-dated bonds get pushed higher as well since fixed coupon payments lose their purchasing power faster when inflation is accelerating. Higher rates present competition for investor capital and drags down valuation multiples. While there’s a shift in market views toward potential Fed rate hikes, keep close watch on long-term yields as well. The 30-year Treasury yield is breaking out from an ascending triangle pattern going back to 2023. A sustained move above resistance at the 5% level would put the 30-year yield at the highest level since 2007.
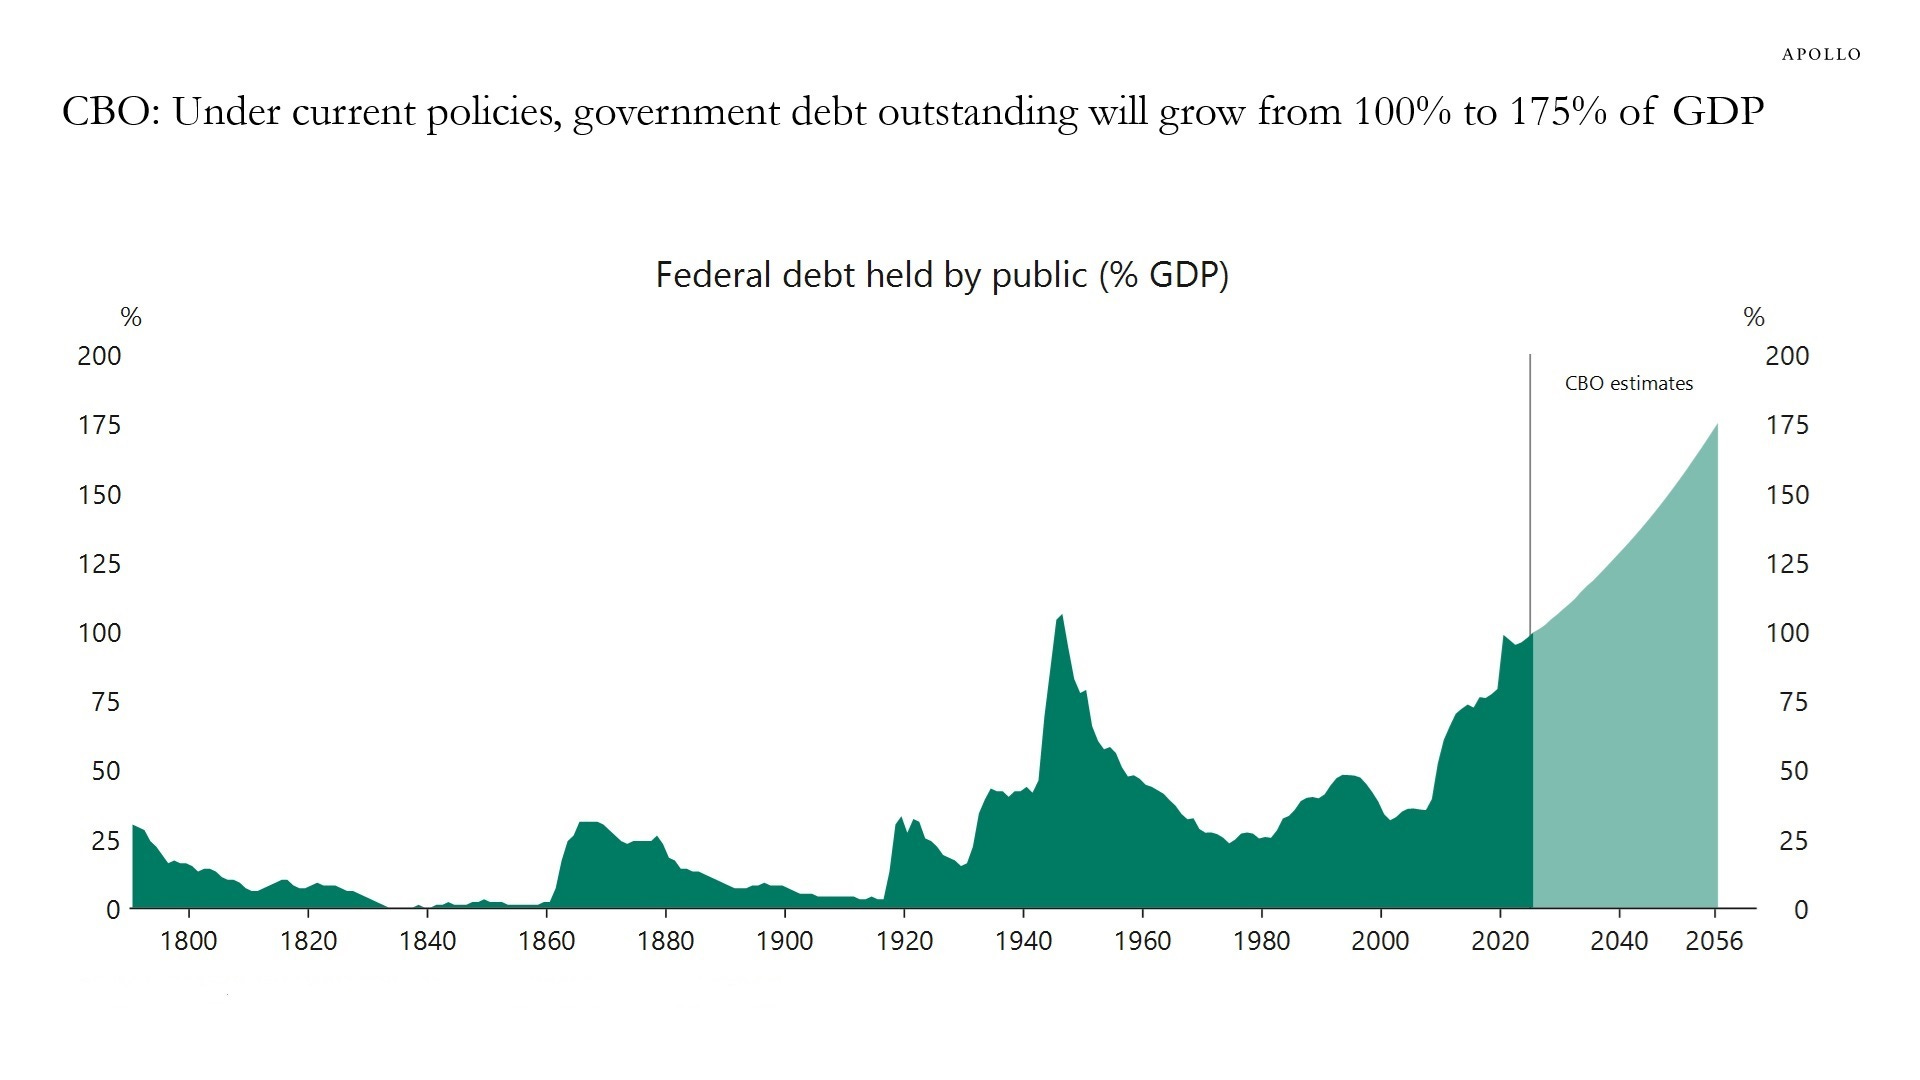
Rising inflation and upward pressure on interest rates are happening at a time when the state of U.S. public finances are deteriorating. Even though the economy is expanding, federal deficit spending could top 6% of GDP this year. Cumulative budget deficits are projected to run around $24 trillion over the next decade. Against those projections, federal debt held by the public as a percent of GDP currently stands at 100% and is the highest level since coming out of World War II. Under current projections, debt to GDP is forecast to rise sharply and hit 175% in the next 30 years. A combination of rising inflation and concerns around the state of public finances could drive a burst of volatility in the bond market.
Heard in the Hub
The Traders Hub features live trade alerts, market update videos, and other educational content for members.
Here’s a quick recap of recent alerts, market updates, and educational posts:
Inflation is more than an energy story.
Forces coming together for the rate outlook.
A hawkish (global) central bank pivot is underway.
How this stock market bubble stacks up against history.
Similarities to the internet bubble and what happens next.
You can follow everything we’re trading and tracking by becoming a member of the Traders Hub.
By becoming a member, you will unlock all market updates and trade alerts reserved exclusively for members.
Trade Idea
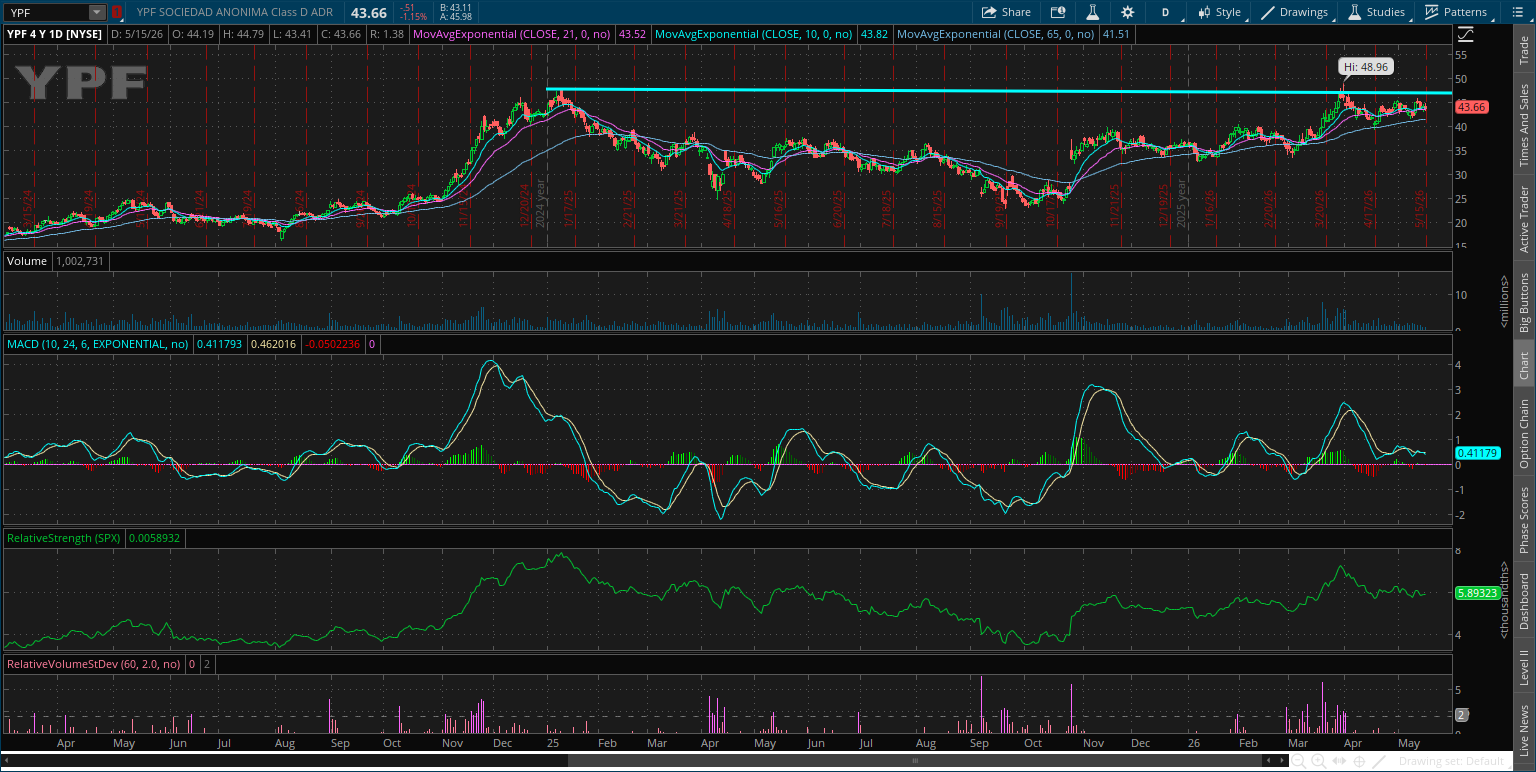
YPF SA (YPF)
Forming a massive basing structure going back over a year and recently testing the high end of the range. A series of smaller pullbacks is underway since December with the stock forming a MACD hook. I’m watching for a move over $49.
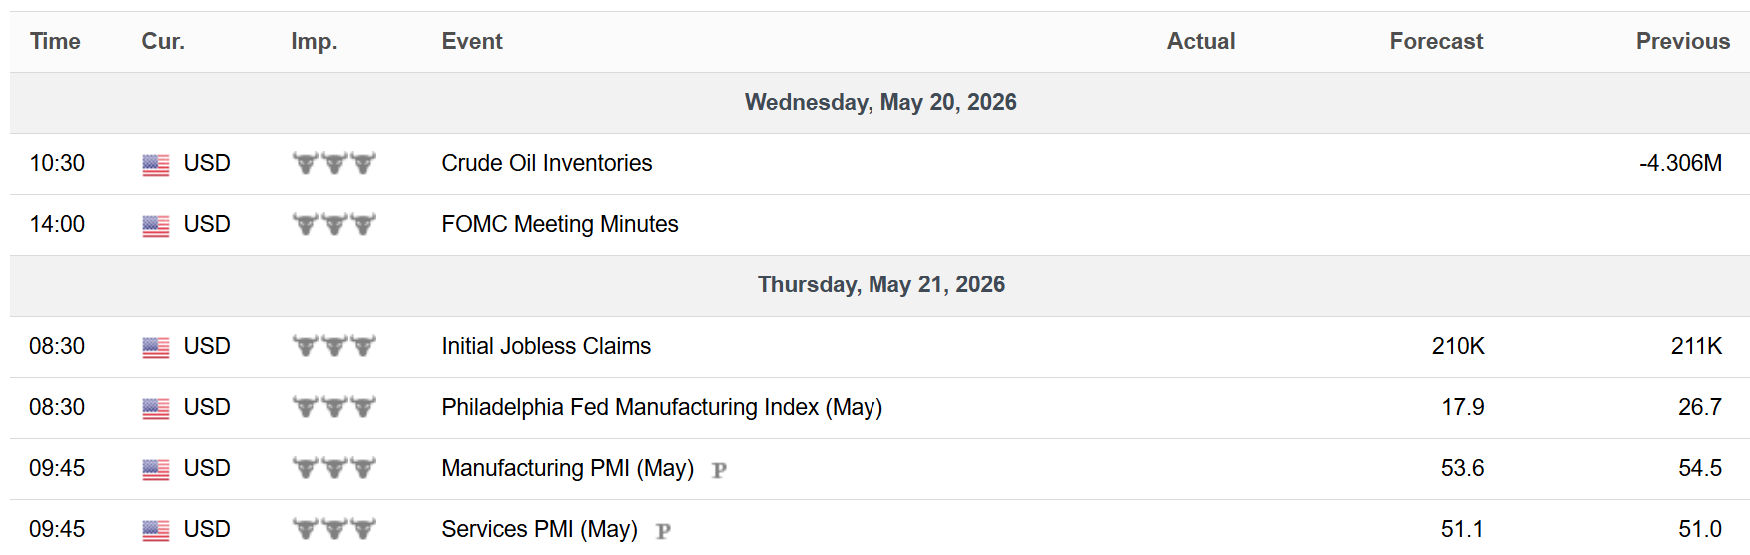
Key Upcoming Data
Economic Reports
Earnings Reports

I hope you’ve enjoyed The Market Mosaic, and please share this report with your family, friends, coworkers…or anyone that would benefit from an objective look at the stock market.
Become a member of the Traders Hub to unlock access to:
✅Model Portfolio
✅Members Only Chat
✅Trade Ideas & Live Alerts
✅Mosaic Vision Market Updates + More
Our model portfolio is built using a “core and explore” approach, including a Stock Trading Portfolio and ETF Investment Portfolio.
Come join us over at the Hub as we seek to capitalize on stocks and ETFs that are breaking out!
And if you have any questions or feedback, feel free to shoot me an email at mosaicassetco@gmail.com
Disclaimer: these are not recommendations and just my thoughts and opinions…do your own due diligence! I may hold a position in the securities mentioned in this report.
The supercore inflation inflection is the most underappreciated element of this print, and the TAA consensus has not yet rotated to account for it.
Equities remain 61.5% overweight (ranked 1st, declining trend), while the 30-year yield breakout above 5% is exactly the scenario that historically compresses multiples fastest in high-and-rising inflation regimes.
Consumer Discretionary, where the purchasing power squeeze is most direct, sits 50.0% underweight in the TAA consensus (ranked 9th, declining trend), which is the correct response.
Consumer Staples at 42.9% underweight (ranked 10th, upward trend in underweight) is the harder paradox: if real wages are negative, staples should theoretically benefit from defensiveness, yet the consensus is moving against them.
UBP, Asset Allocation Award winner 2026, captured the structural risk clearly: "earnings expectations could face downward revisions in the coming months" as "higher energy and input costs could erode corporate margins, while weaker consumer purchasing power and softer business confidence may weigh on revenue growth."
The SAA lens adds a second layer: US equities carry a 10-year consensus return of just 6.13% annualised with the highest dispersion among developed markets (std dev 1.7), per Alpha Research Capital Market Assumptions, April 1, 2026, assetallocationreport.com. Low conviction on long-term return, mounting short-term multiple compression risk.
If supercore stays above 3% for a third consecutive month, does the equity overweight in the TAA consensus become harder to defend even for managers who are still constructive on AI earnings?