The Market Mosaic 5.15.22
Dead cat bounce, or stock market bottom?
Welcome back to The Market Mosaic, where I gauge the stock market’s next move by looking at trends, market internals, and the mood of the crowd.
I’ll also highlight one or two trade ideas I’m tracking using this information.
And if you find this content helpful, hit that “like” button (you know, the one that looks like a heart). Because I heart you too…
Please share this post, and become a subscriber to this always free newsletter if you haven’t already done so!
Now for this week’s issue…
Oh, where to start. Last week, I concluded with this remark about trading bear markets:
“Bear markets are tricky, where downside moves happen fast, and massive bear market rallies can easily wipe out gains from shorts or put options. Focus only on the best setups, and be flexible and quick to take profits!”
Last week perfectly sums up the incredible opportunities AND difficulties in trading these types of markets. Because for weeks now, I’ve been highlighting a very common and very profitable pattern that shows up when the bear comes out: bear flags.
On Wednesday, I posted on Twitter the returns for several bear flag breakdowns that were highlighted right here in this newsletter or my Twitter feed. I trade bear flags by either going short or trading put options on the break of support in the chart patterns.
But in the same tweet, I also said it was time to exit these positions and wait for new setups to develop. That’s because incredibly powerful rallies can transpire after such quick downside. That’s exactly what happened on Friday!
In other words, if you weren’t quick to secure profits from shorts/puts, a big chunk of your gains disappeared going into the weekend.
More Rally Ahead?
Now back to that Friday action. After briefly touching bear market territory last week, the S&P 500 ripped 2.4% higher on Friday.
But it had all the hallmarks of a short-covering rally. Volumes across the stock market were light, and the most beaten-up names soared…like Silvergate Capital (SI) up 19% and Rivian (RIVN) up almost 10%. Those were stocks that previously broke down from bear flag patterns.
So, the big question becomes: is this a dead cat bounce or the start of a more durable rally?
First the good news. One is the VIX pattern I laid out last week continues to move in the right direction. Last week I commented that VIX is “repeating a pattern that developed just before the March rally in the S&P…We have a trendline break, and back test of that break. That happened before the S&P exploded higher in March too. I would love VIX under 25 to see stocks scoot higher in a hurry.”
VIX refused to move over the 35 level even as the stock market sold off earlier last week, then Friday’s rally drove the index beneath 30. I would still look at 25 as the next breakdown level to sustain more gains. Why do I watch VIX in this manner? Because there are huge sums of money in institutional strategies that use volatility to adjust stock market exposure. When volatility rises, they sell. When volatility falls, they get back in.
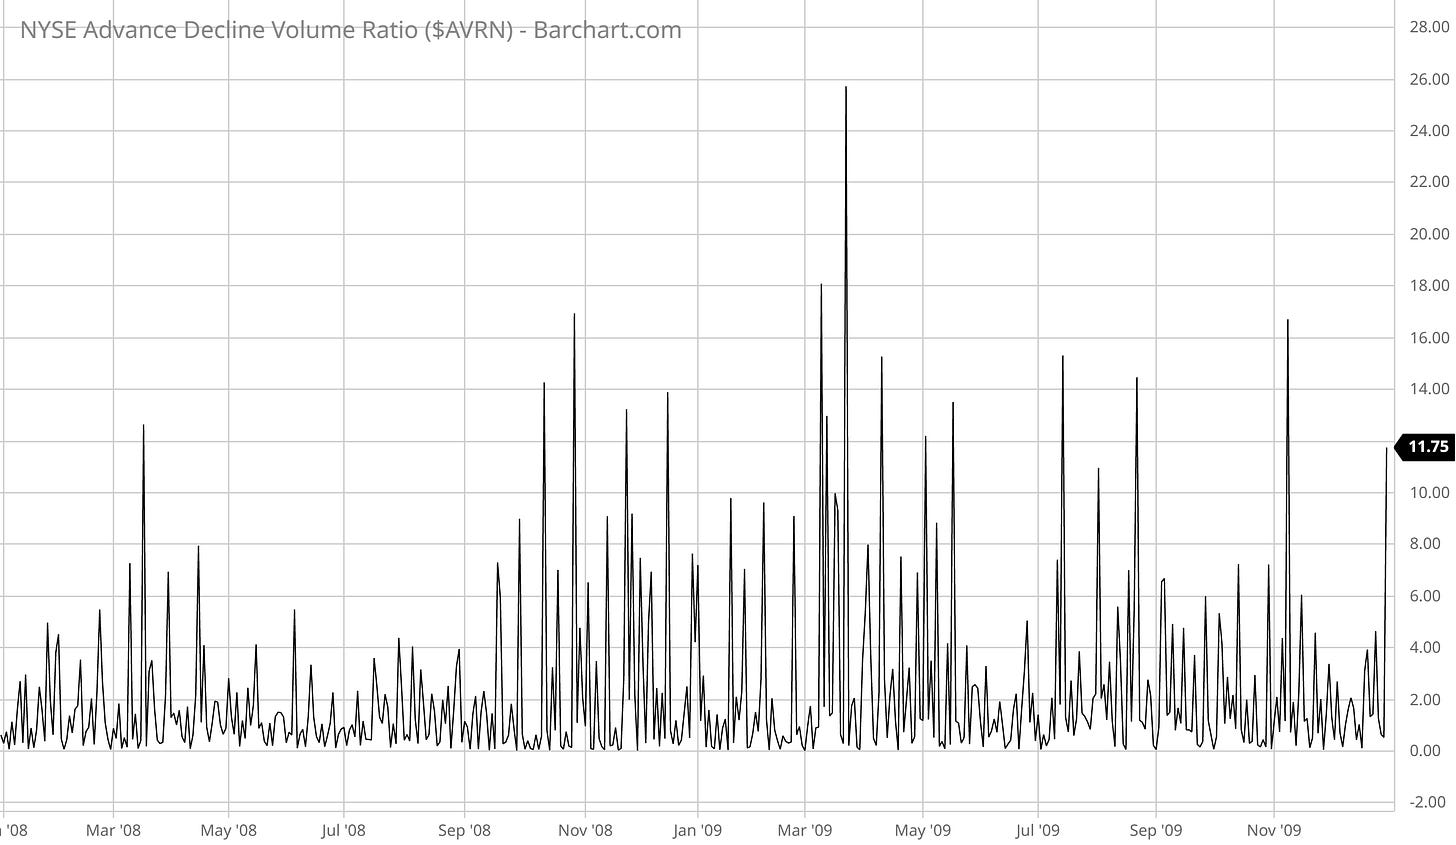
Another positive was the ratio of volume in advancing stocks versus declining stocks on the NYSE. It hit 11.7 on Friday, which is the highest ratio in nearly two years as you can see below. That’s typically a sign of strong institutional buying.
Finally, I also noted on Twitter how a bullish dynamic could play out in the stock market next week with options expiration:
Now What?
Despite the short-term bullish implications of the aforementioned catalysts, I’m not doing much here.
One major development for concern is occurring in high yield bonds. The spread on CCC-rated bonds are really starting to surge higher, indicating that financial distress is quickly accelerating. This is often a coalmine canary for the economy and stock market.
Next, that A/D volume ratio mentioned above is a strong figure. But similar levels were seen right in the middle of other bear market bounces, like in 2008/2009 (below). During the true bottom in 2009 and in 2018’s selloff, this ratio hit levels in the mid-20s!
Finally, I also don’t see many bullish chart patterns that fit my criteria. I target long positions in stocks that are emerging from a base-building process, and where longer-term momentum indicators (i.e. weekly and monthly charts) support a move higher. Aside from a few longs highlighted here in recent weeks (like TAP, MYE, and POST)…I just don’t see any high quality setups at the moment.
So once again, don’t feel compelled to chase stocks in this market, and I intend to wait patiently on the sidelines. I think stocks can rally in the short-term, but currently expect that to create fresh bear flag patterns to play. I’ll post any setups as they develop, so stay tuned!
That’s all for this week. I hope you’ve enjoyed this edition of The Market Mosaic, and please share this newsletter with anyone you feel could benefit from an objective look at the stock market.
Make sure you never miss an edition by subscribing here.
And for updated charts, market analysis, and other trade ideas, give me a follow on twitter: @mosaicassetco
Disclaimer: these are not recommendations and just my thoughts and opinions…do your own due diligence! I may hold a position in the securities mentioned in this newsletter.


