
The Market Mosaic 5.14.23
A credit crunch and the stock market.

Welcome back to The Market Mosaic, where I gauge the stock market’s next move by looking at macro, technicals, and market internals. I’ll also highlight trade ideas using this analysis.
If you find this content helpful please hit that “like” button, share this post, and become a subscriber to this always free report if you haven’t already done so!
And be sure to check out Mosaic Chart Alerts. It’s a midweek update covering my best chart setups among long and short ideas in the stock market, along with levels that could trigger a trade.
Now for this week’s issue…
For much of the past year, its been hard to find any positives in inflation data.
The biggest price increases since the early 1980s led to the fastest rate tightening cycle by the Federal Reserve in history.
But the mood among investors was more celebratory following last week’s inflation figures. The Consumer Price Index (CPI) showed consumer inflation decelerating with a less-than-expected 4.9% increase in April compared to last year…the smallest increase in nearly two years (long-term chart of headline and core CPI below).

Underlying components of the report delivered reason for optimism as well, like with shelter that slowed for the first time in over two years. It makes up around a third of the CPI basket calculation, giving hope that more moderation is on the way.
But despite the good news, the S&P 500 still couldn’t escape the same resistance level going back to early February. While inflation was the headline event of the week, it was a lesser known report that kept a lid on stock prices.
And that belongs with the Senior Loan Officer Opinion Survey (SLOOS). While a mouthful to say, it’s an important report covering the availability and demand for credit across the economy.
Last week’s update showed an increase to a net 46% of banks tightening lending standards for new loans to large- and mid-sized firms (chart below from Reuters). Not only that, but demand for credit from businesses of all sizes is falling as well.

In other words, a credit crunch could be in the making with both the demand and supply for loans falling. And with the ongoing bank crisis, the concern is that tightening lending standards and signs of falling loan demand are starting to reverberate though the economy.
So today, I want to look at three real-time indicators I’m tracking to know if a credit crunch is coming for the economy and stock market.
3 Sectors to Track a Credit Crunch
The challenge with waiting around for economic data like SLOOS is that the forward-looking stock market is already reacting. But there are plenty of cyclical areas of the market to track signs of a growing economic impact due to a credit crunch.
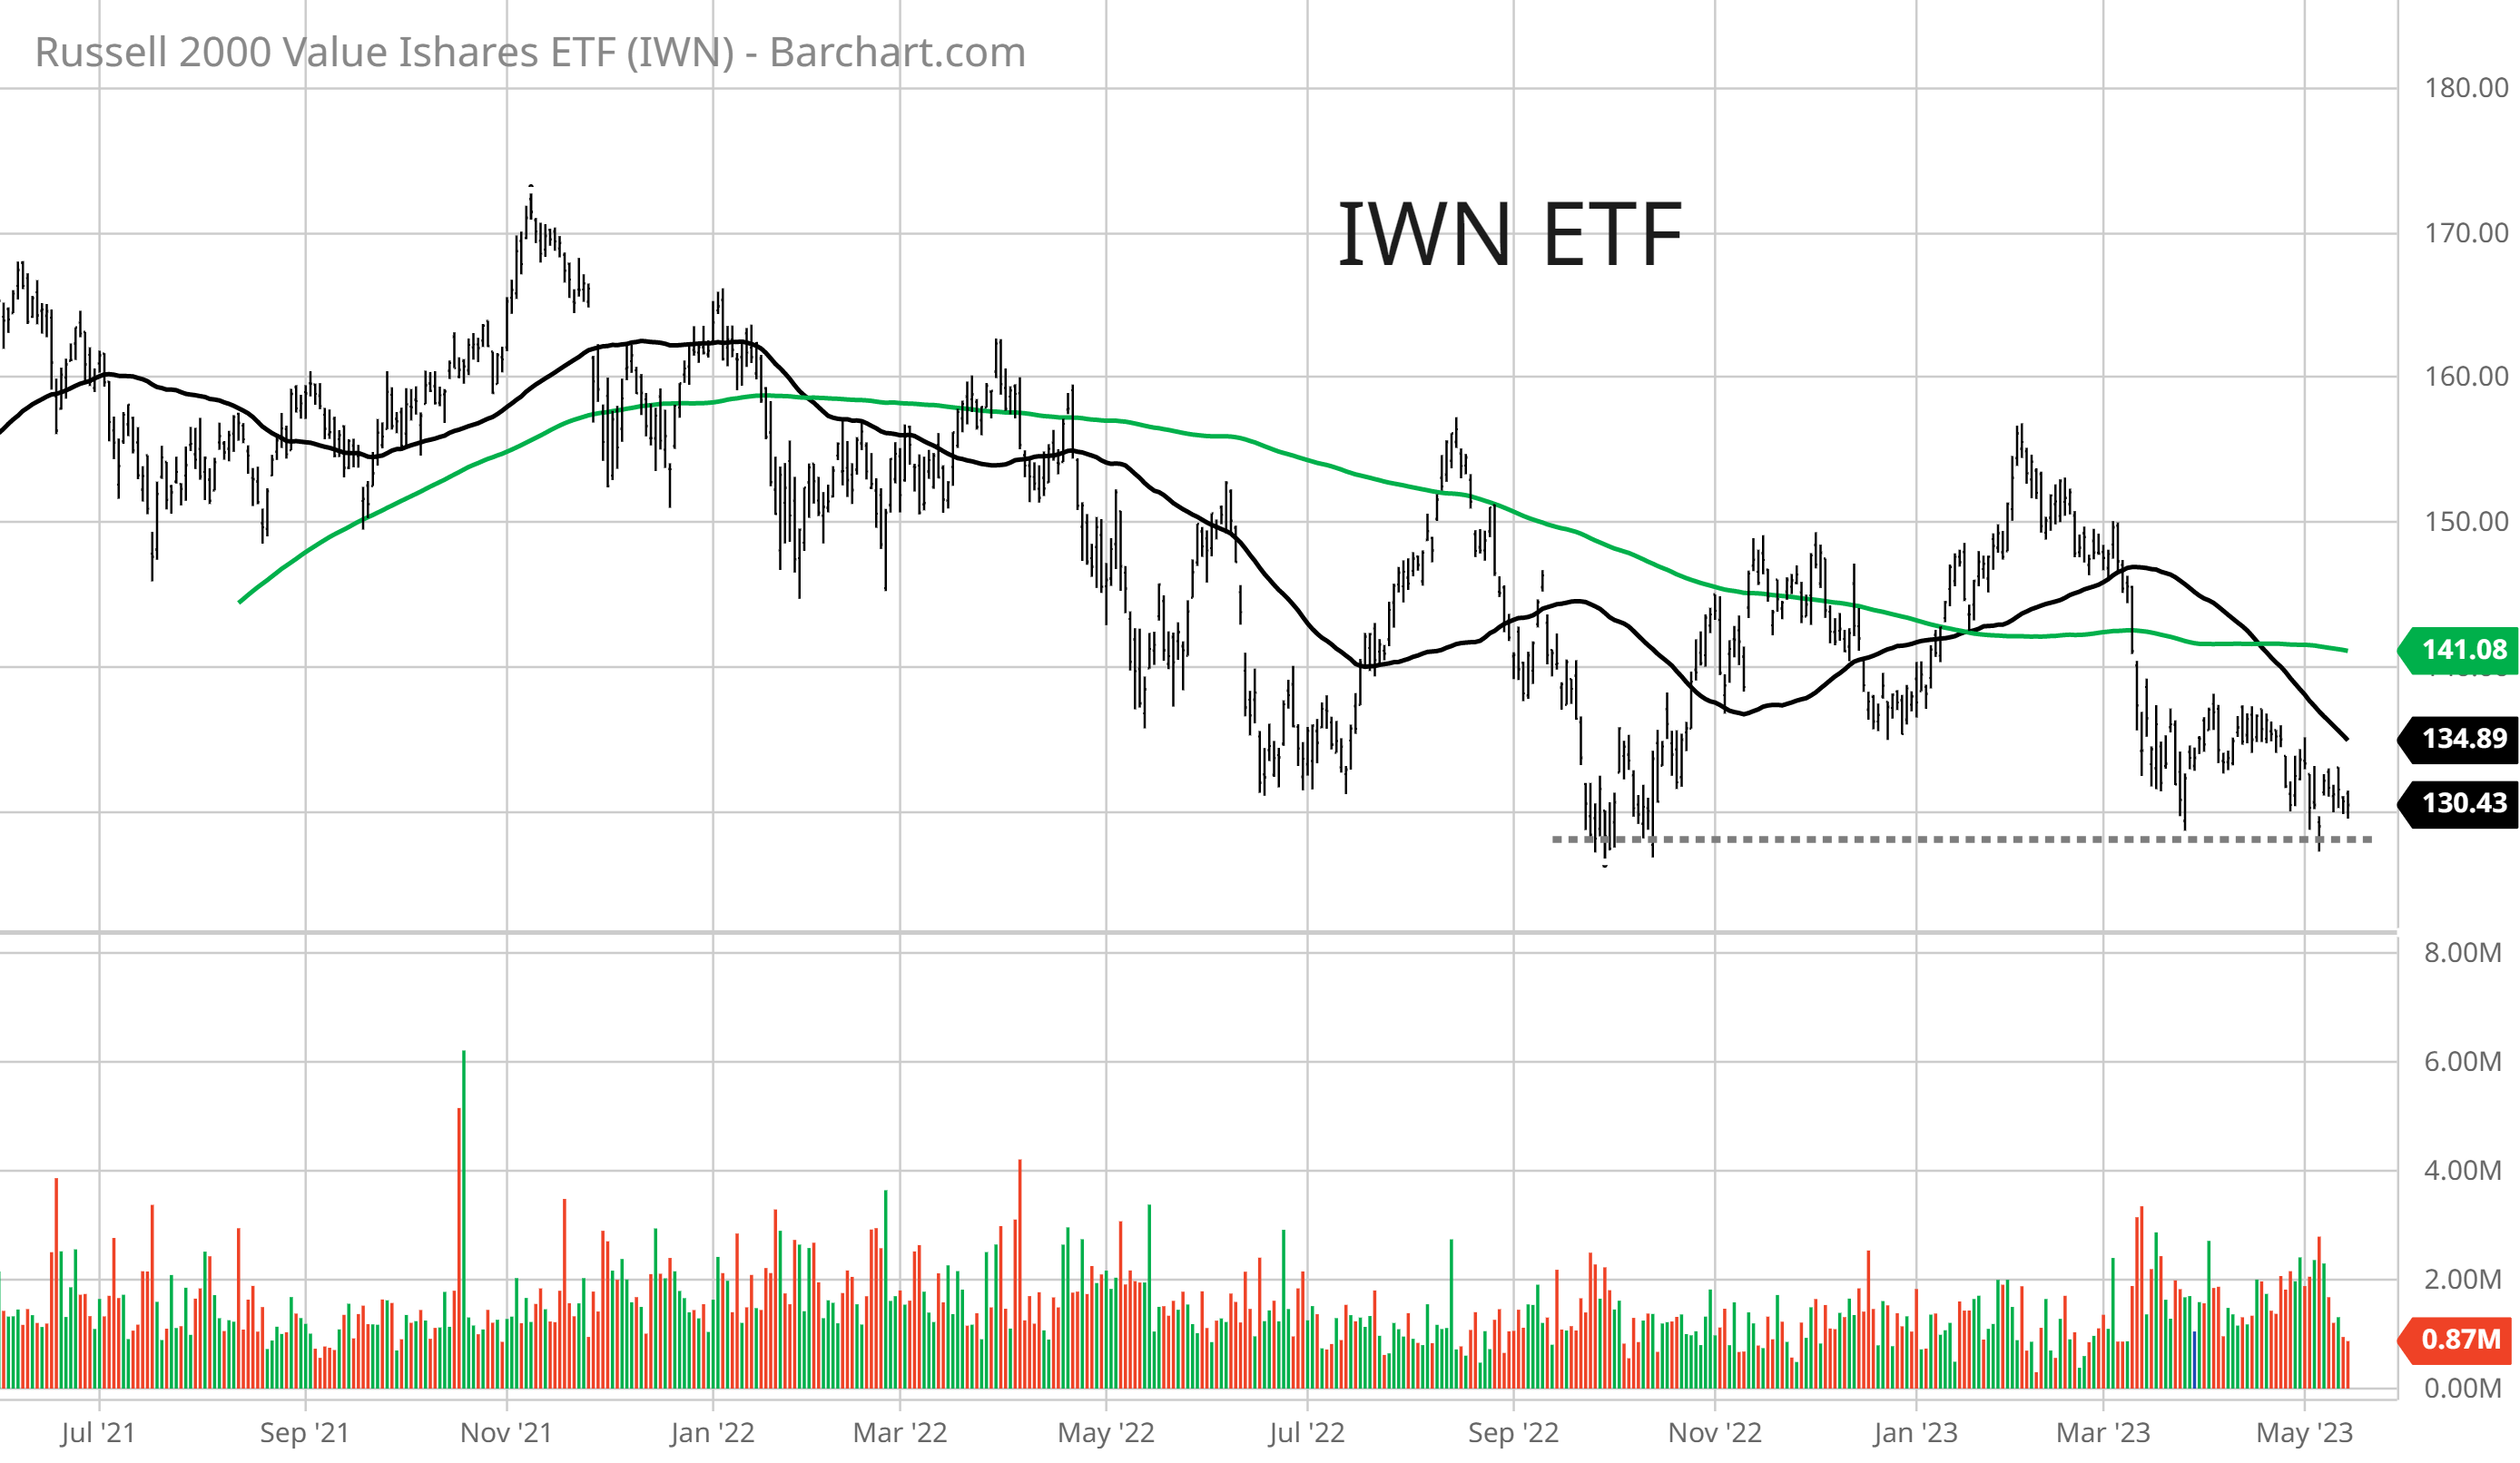
The first is with small-cap value stocks and the IWN exchange traded fund (ETF). Small-caps are already more sensitive to developments with the economy, while focusing on the value style box incorporates more small-cap bank and real estate exposure. In fact, those two sectors combined make up about 35% of the ETF.
That combination of business cycle sensitivity and exposure to the problem areas of the economy makes IWN a great vehicle to track at the moment. And IWN is trading at a precarious support level that you can see below. If credit conditions worsen and issues facing the bank and real estate sector are taking a toll, it will be signaled by a breakdown below that $127 level which would mean new bear market lows.
Base metals are another economically sensitive area to track, like with aluminum and copper prices. These metals are utilized in a variety of construction and manufacturing end markets, making them price sensitive to developments with the economy. And there are securities we can utilize to track their movement, like with the DBB base metals ETF.
After shooting higher in 2022, base metals gave back their gains and are right back near the lows seen late last year. A sustained breakdown below the $17 level would be a major red flag from base metals that the economy is in worsening shape.

Finally, I want to come back to high yield spreads. I’ve written about spreads frequently in the past several reports, highlighting their importance and signaling about investor attitudes to the outlook.
Given the sensitivity of high yield investors to a deteriorating economic outlook or a pullback in funding, a jump in high yield spreads reflects greater default concerns. In the chart below, you can see that spreads have widened since the start of the year but remain under the highs from last year.

While there are other areas of the capital markets sensitive to economic developments, these are the ones that will quickly tip off a worsening credit crunch in my opinion.
Now What…
The S&P 500 continues to struggle with a breakout over the 4200 resistance level, which has remained in play for over three months now as you can see below with the chart of S&P 500 futures.

While I’m also paying close attention to the charts discussed above for signs that a credit crunch is coming for the economy, perhaps emerging weakness in those sectors is tied to lagging breadth since the bank crisis emerged back in March.
Not only is participation in the S&P 500’s rally lagging badly, it worsened over the past week as well. That also includes longer-term measures of breadth.
I frequently talk about the percent of stocks trading above their 20-day moving average (MA) as a way to track participation in the short-term trend of the market. But just look at the percent trading above the 100-day MA as a measure of longer-term trends. Only 37% of stocks are above their 100-day MA compared to nearly 80% when the S&P traded at similar levels back in February.

It pains me to keep repeating the same message each week, but for right now I’m still playing it cautiously until there are signs that these breadth divergences are clearing up.
While I’m position sizing conservatively, you can still find pockets of strength out there like with SFM that is turning higher after testing support at the breakaway gap off earnings.

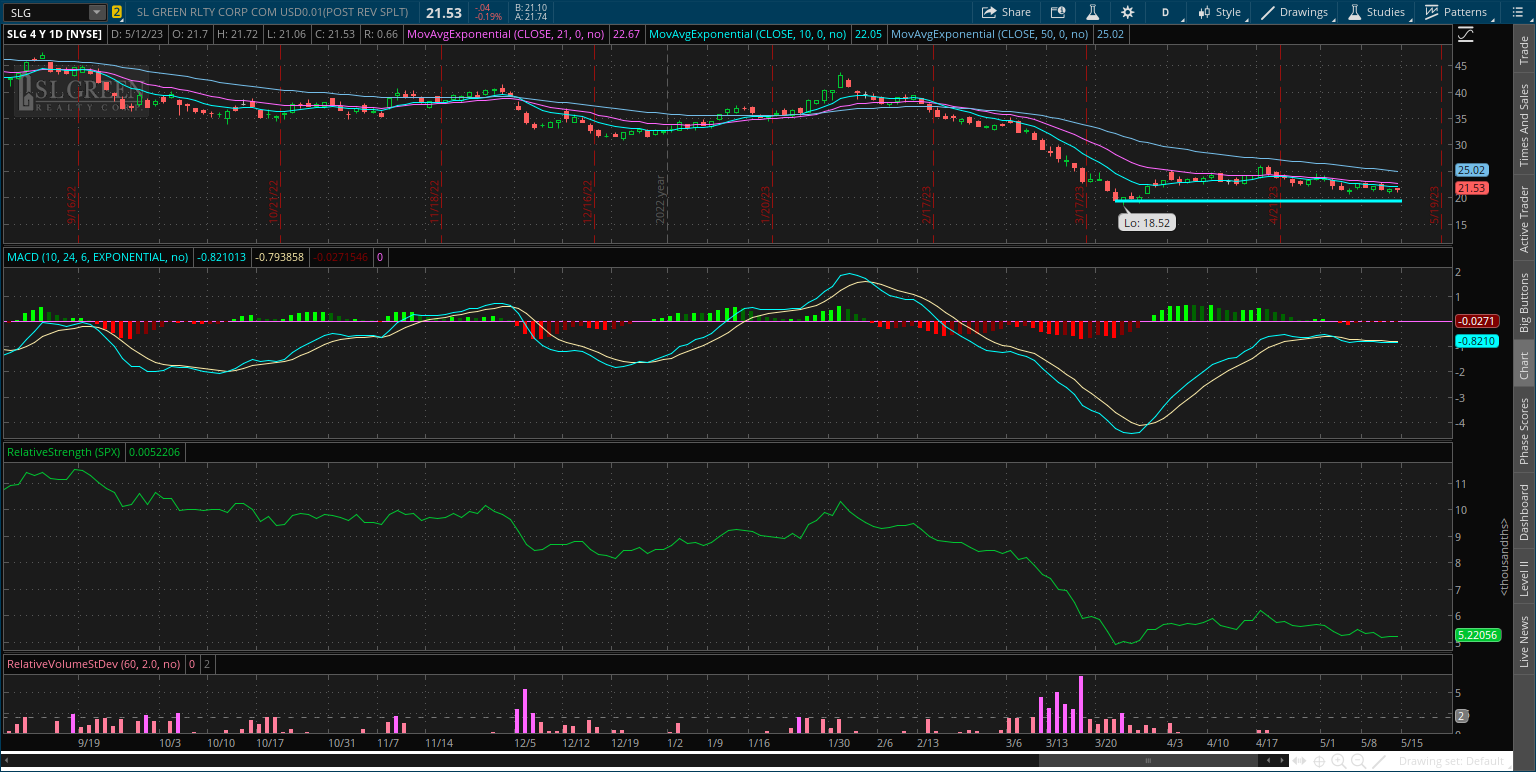
On the downside, it’s worth paying attention to breakdowns in the bank and real estate sector. On the latter, I’m watching the $19 level with SLG that was tested in March (chart below) and has served as support going back to 2020.
That’s all for this week. With inflation reports and the bulk of earnings season now behind us, I expect intense focus on developments with the bank crisis and debt ceiling. I was active in the market during the 2011 debt ceiling episode, which featured a waterfall decline in the S&P 500 of 17% in just a few weeks. So stay prepared for plenty of headline-induced volatility as we start the second half of May.
I hope you’ve enjoyed The Market Mosaic, and please share this report with your family and friends…or anyone that would benefit from an objective look at the stock market.
And make sure you never miss an edition by subscribing here:
For updated charts, market analysis, and other trade ideas, give me a follow on Twitter: @mosaicassetco
And if you have any questions or feedback, feel free to shoot me an email at mosaicassetco@gmail.com
Disclaimer: these are not recommendations and just my thoughts and opinions…do your own due diligence! I may hold a position in the securities mentioned in this report.