The Market Mosaic 5.1.22
S&P 500 Catching Down...Sharper Decline Ahead?
Welcome back to The Market Mosaic, where I gauge the stock market’s next move by looking at trends, market’s internals, and the mood of the crowd. I also look for information contained in sector movements and other areas of the capital markets. Finally, I’ll highlight one or two trade ideas I’m tracking using this information.
And if you find this content helpful, please like…please share…and please subscribe!
Now onto this week’s issue…
“This is where you sit and watch, and remember that cash is a position.”
That was my concluding thought in last week’s newsletter, and I see little reason to change that stance. In this issue, I’ll talk about one condition that could lead to a cascading decline (as if last week didn’t feel bad enough) and I’ll revisit the signals that I’m watching for a bottom. Finally, I have another trade idea for playing the downside in the stock market.
Looking back, November 2021 will be remembered as a pivotal moment for the stock market. That’s when the Federal Reserve quickly changed their tune and recognized that inflation wasn’t transitory, and the central bank was lagging badly to catch up.
Since then, the Fed has done its best to quickly ratchet up expectations for a dramatic pace of tightening without shocking the market. Early on, many areas of the stock market took it in stride, while speculative growth stocks took a major hit to valuations.
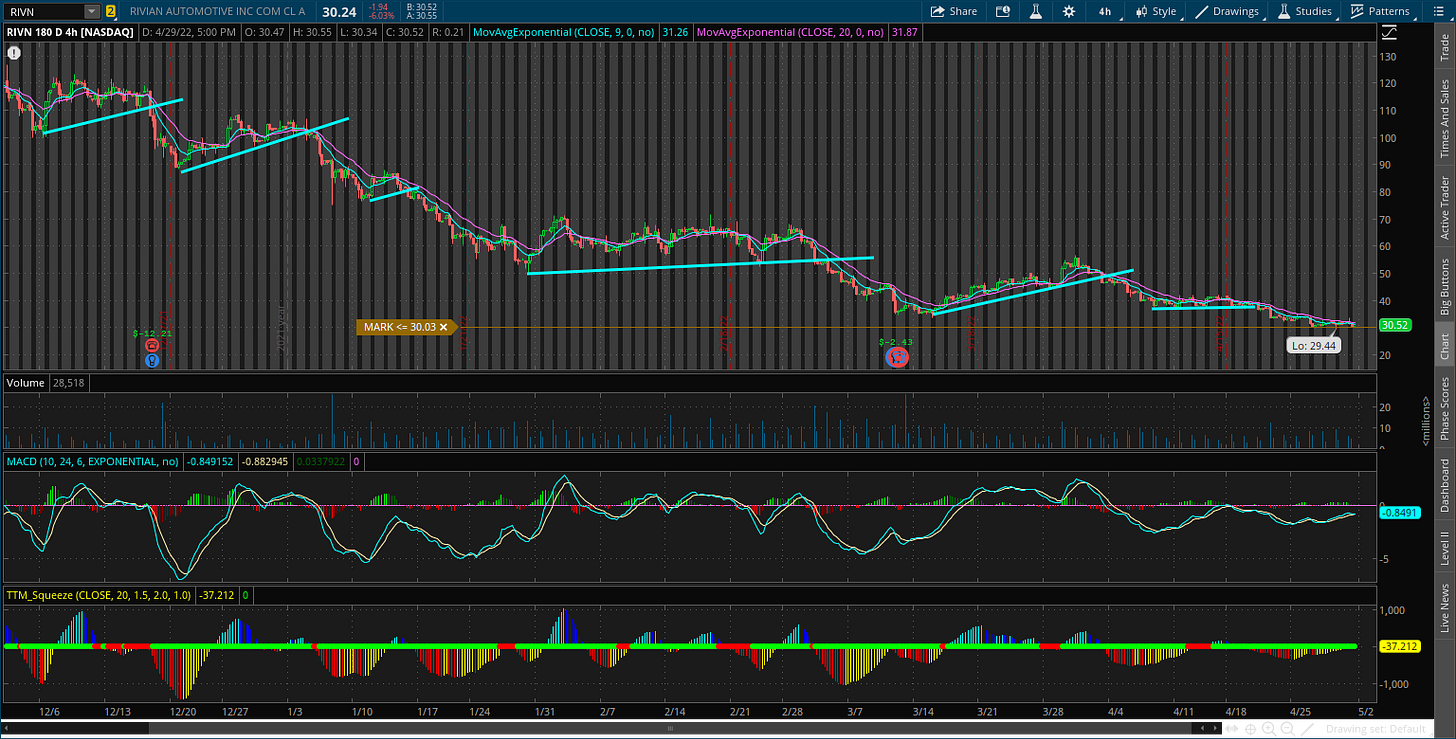
Growth stocks have broken down from bear flag after bear flag…and it keeps going. There’s too many stocks to list here, but look at charts of names like SQ, ROKU, HOOD, and RIVN (four hour chart shown below). The RIVN chart perfectly captures a bear market trend, and repeat bear flag breakdowns.
Spreading pain
But here’s the bad news. Economically sensitive stock sectors are starting to price a major hit to GDP. For instance, check out small-caps (IWM) which took out a very key level last week. Or a similar story with banks (KBE) in the chart below. That could be the early stages of big breakdown from a rounded topping pattern if the trendline doesn’t hold.
Meanwhile, the notion that mega-cap tech stocks are bullet proof is being cast aside. Look at what happened to Amazon (AMZN) last week. And Google (GOOG) with lower highs and lower lows. That’s the definition of a downtrend, which GOOG hasn’t seen for a long time!
These breakdowns present a major issue for index investors. You could hide from the carnage in small-cap growth stocks last year in ETFs like SPY and QQQ. That’s because they’re dominated by those mega-cap stocks that, for the most part, did well in 2021. Now if they’re breaking down, that means SPY and QQQ are catching down.
Last week, I zoomed in on the daily chart of the S&P 500 Index and showed the triangle pattern playing out. I noted that 4,000 is the level to watch, and now we’re only 30 points or so away.
How about those bottoming signals discussed last week?
Two out of three conditions I highlighted last week favor at least a near-term bottom. That includes oversold breadth and VIX futures backwardation.
But here’s where the VIX picture could complicate matters…and where that cascading decline comes into play.
Lots of institutional investors use volatility to manage their stock exposure. Like risk parity funds, or other asset managers with a “risk budget”. As risk (i.e. volatility) in the stock market picks up, these institutions must reduce equity exposure to stay within their risk budget guidelines. So a spike higher in the VIX fuels stock selling…driving higher VIX levels…and more selling…you get the point.
That’s why the VIX chart below is critical to the next leg in stock prices. The VIX is back near the highest levels seen since mid-2020, where a break above this range could drive a new wave of selling. Over 35 followed by 40 is a huge warning sign that a cascading decline is underway.
What now?
Last week’s conclusion remains valid: watch from the sidelines and remember that cash is a position! I still don’t see many high quality setups…stocks that are breaking out from sound basing patterns. Meanwhile, there are stocks in downtrends breaking down from bear flags, or other bearish patterns.
Oracle (ORCL) fit the description last week (remember to use a 10-day moving average as a stop), and this week I’m following another bearish setup. Home Depot (HD) is another stock that I’m monitoring for a breakdown. HD has been consolidating under the 50-day moving average, and is creating a support level at $300 with the MACD resetting as well. A close below $300 on rising volume could be a trigger point for a short or put option position.
That’s all for this week. I hope you’ve enjoyed this edition of The Market Mosaic, and please share this newsletter with anyone you feel could benefit from an objective look at the stock market.
Make sure you never miss an edition by subscribing here:
And for updated charts, market analysis, and other trade ideas, give me a follow on twitter: @mosaicassetco
Disclaimer: these are not recommendations and just my thoughts and opinions…do your own due diligence!


