
The Market Mosaic 5.11.26
A Major Central Bank Pivot is Underway.

👋Welcome back to The Market Mosaic, where I gauge the stock market’s next move by looking at macro, technicals, and market internals. I’ll also highlight trade ideas using this analysis.
If you find this report helpful please hit that “like” button, share this post, and become a subscriber if you haven’t already done so!
🚨And be sure to check out Mosaic Traders Hub. It’s a members-only platform to alert trade ideas, track a model portfolio of open positions, and further analyze the message coming from the capital markets.
Now for this week’s issue…
The S&P 500 notched it’s sixth consecutive week of gains following hopes for an end to the war in the Middle East coupled with economic optimism following the latest jobs report.
Investor hope grew as the U.S. and Iran appeared to be making progress toward a lasting peace deal that would also open the Strait of Hormuz and restore the flow of energy products.
While a peace deal has yet to materialize, investors received good news regarding economic data. The April payrolls report showed the economy added 115,000 jobs last month while the unemployment rate held steady at 4.3%.
Along with the upwardly revised jobs report of 185,000 in March, payrolls showed the strongest two-month growth total since 2024 (chart below) and is helping to alleviate concerns over a stalling labor market.
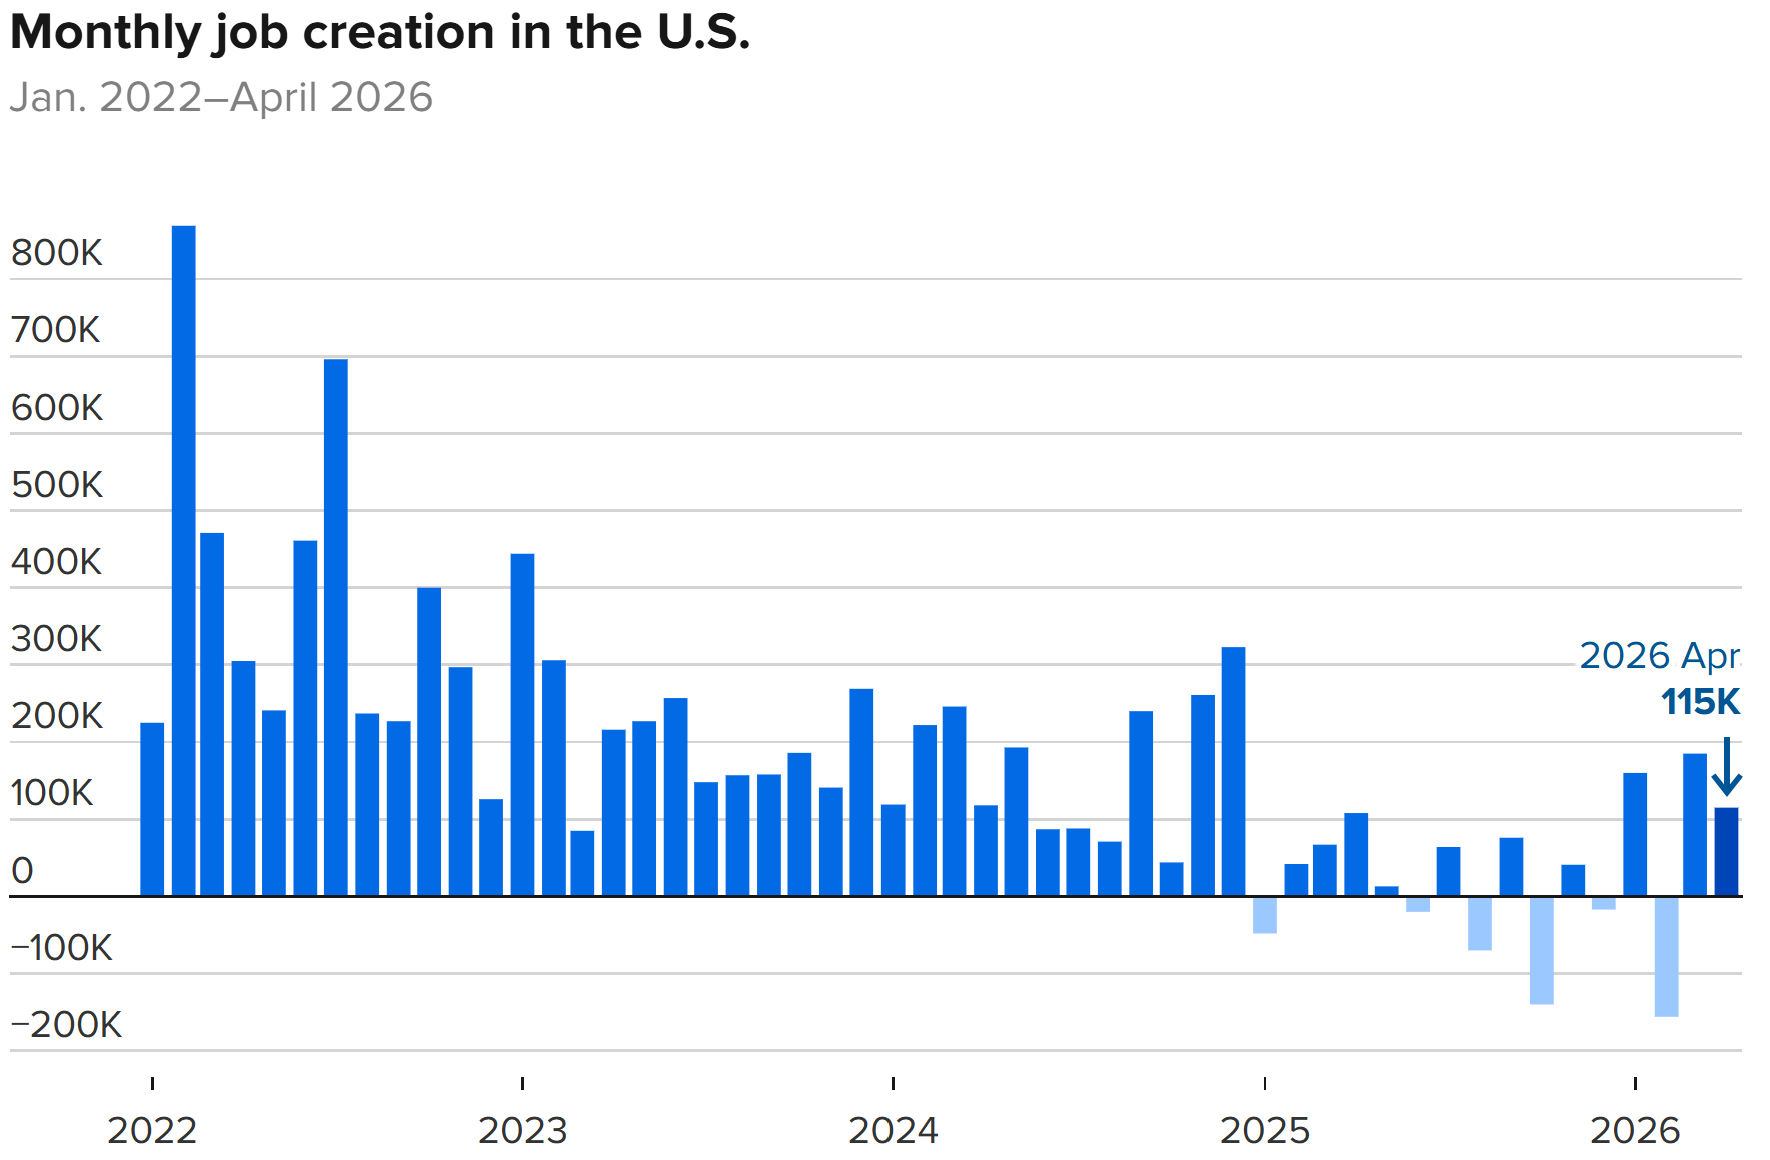
The report should also further dash hopes for rate cuts any time soon, as recent acceleration in the labor market happens at the same time that inflation is creeping higher.
The narrative driving recent market action is centered around strong corporate earnings and positive forward revisions especially with companies leveraged to AI infrastructure capex.
But centrals banks around the world are slowly starting to pivot to tighter monetary policy, which could eventually weigh on equity prices. Rising interest rates on longer-dated yields are also calling valuations into question.
This week, let’s look at the bullish combination of positive earnings data and signs the economy is holding up. We’ll also look at how oil prices remain a key driver of market action, and a key threshold that could come back to bite the economy. Finally, there’s a subtle shift in central bank policy underway that could impact investors.
The Chart Report
Signs of economic growth holding up against high oil prices is adding more fuel to the earnings outlook. Corporate earnings revisions have been a key driver of the rally since the lows in late March. The earnings growth rate for the S&P 500 is expected to top 20% every quarter in 2026 compared to the same period a year ago. While there’s some concern that revisions are being driven only by stocks leverage to the AI capex spend, earning breadth is turning higher. The chart below shows the percent of S&P 500 industries with earnings estimates higher compared to 12 months ago and is at the highest level of this bull market cycle.

While earnings revisions are driving the price action in the major indexes in the background, developments on the war with Iran are dominating the headlines. The impact on energy markets is also having a heavy influence on the stock market due to the implications for inflation, interest rates, and cost inputs for various businesses. The movement in the S&P 500 over a shorter-term time frame has remained extremely negatively correlated to the movement in oil prices. The chart below shows the rolling 10-day correlation between the S&P 500 and oil, and is pushing near a perfect negative correlation. That shows developments in the Middle East and impact on oil prices should remain a key driver of the S&P 500 over the near-term.

Oil prices were trading just below $60 per barrel entering 2026, and jumped as high as $120 on an intraday basis following the war with Iran and impact on the Strait of Hormuz. The spike in oil prices is triggering thresholds historically associated with recessions. Higher oil can impact the economy through multiple avenues, including consumer spending, business profits, and the impact of inflation on monetary policy. In the past, a 50% upward deviation from oil’s price trend has triggered a recession that you can see in the chart below using data back to the 1970s.

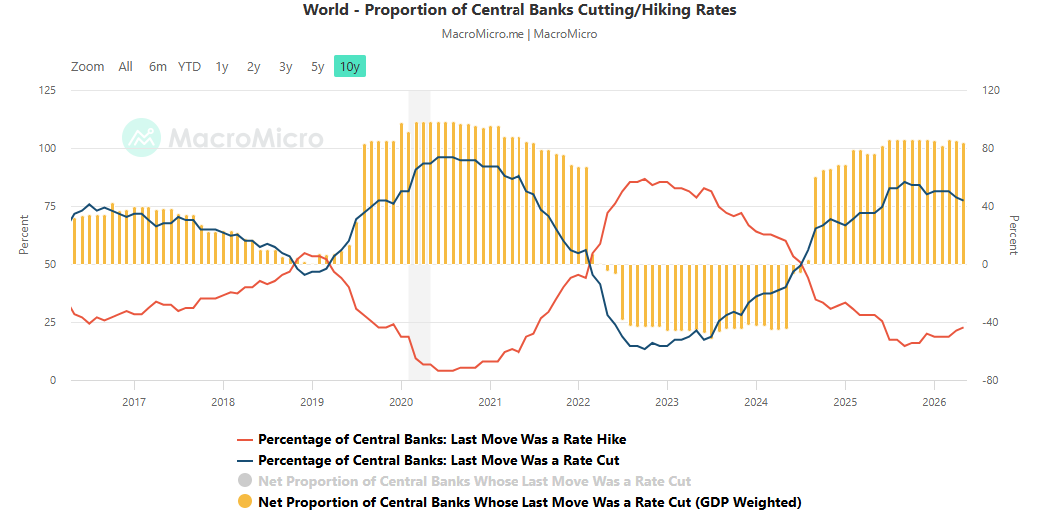
The jump in oil prices is becoming more apparent in recent headline inflation reports while leading inflation indicators like the prices paid component of various business surveys warn of higher levels ahead. That comes at a time when central banks around the world are slowly shifting toward a tightening bias. The chart below plots the percentage of central banks around the world that are cutting rates (blue line) versus hiking rates (red line). A growing percentage of banks easing policy coincided with the cyclical bull market that started in late 2022. That trend is slowly being reversed and could quicken given the inflation outlook.
The prospect of rising interest rates on the short- and long-end of the yield curve could pose a challenge to stock market valuations. The easing bias in central banks around the world is shifting to a more hawkish stance. At the same time, the steady climb in longer-dated yields back toward the highs of the past several years is putting Treasury yields above the earnings yield for the S&P 500. The chart below plots the spread between the earnings yield and 10-year Treasury, which is pushing further into negative territory. The earnings yield gap is usually positive, with current levels last seen coming out of the early 2000s dot-com bust.

Heard in the Hub
The Traders Hub features live trade alerts, market update videos, and other educational content for members.
Here’s a quick recap of recent alerts, market updates, and educational posts:
The tug of war driving stock prices.
More signs the next inflation wave is underway.
A SpaceX IPO could deliver a boost to this stock.
Why investors are taking comfort in the earnings outlook.
How it’s our job to trade with the trend and ignore the noise.
You can follow everything we’re trading and tracking by becoming a member of the Traders Hub.
By becoming a member, you will unlock all market updates and trade alerts reserved exclusively for members.
Trade Idea
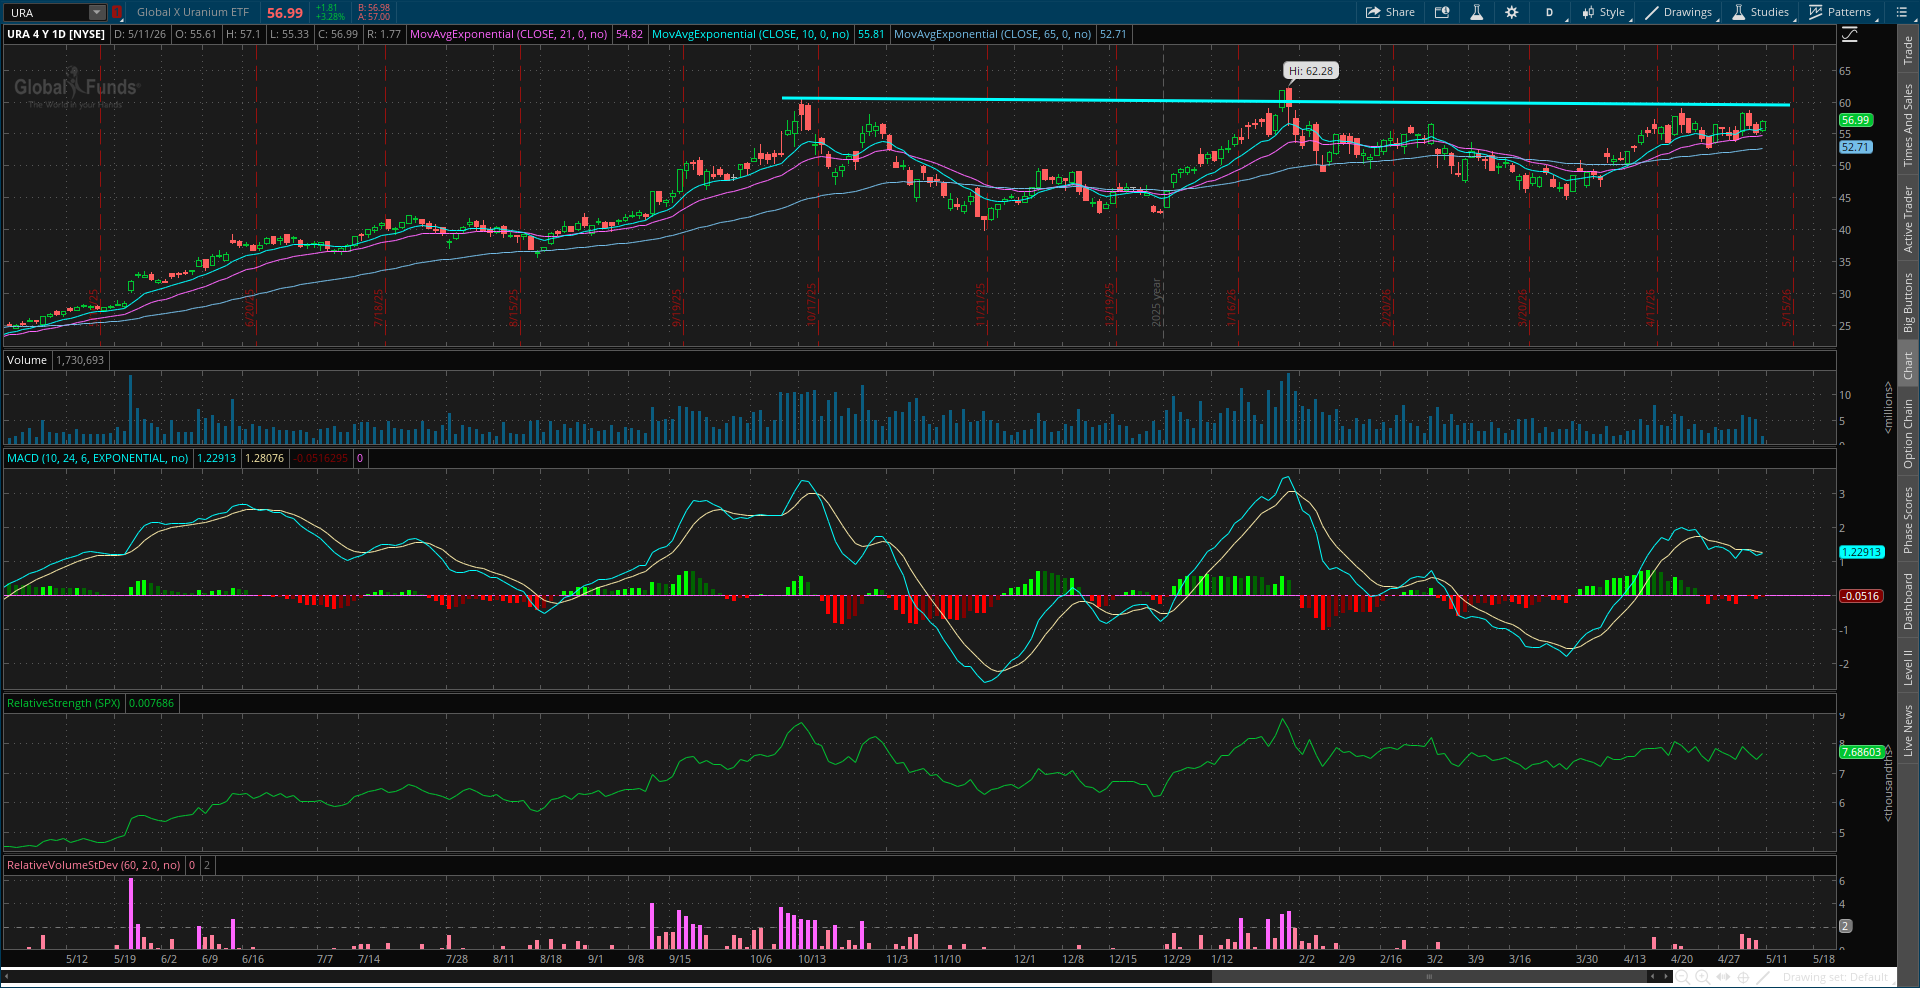
Global X Uranium ETF (URA)
Uranium ETF that topped near $60 back in October and is now tightening in its basing pattern. A smaller pullback off the $60 level is resetting the MACD above the zero line. I’m watching for a breakout over $60.
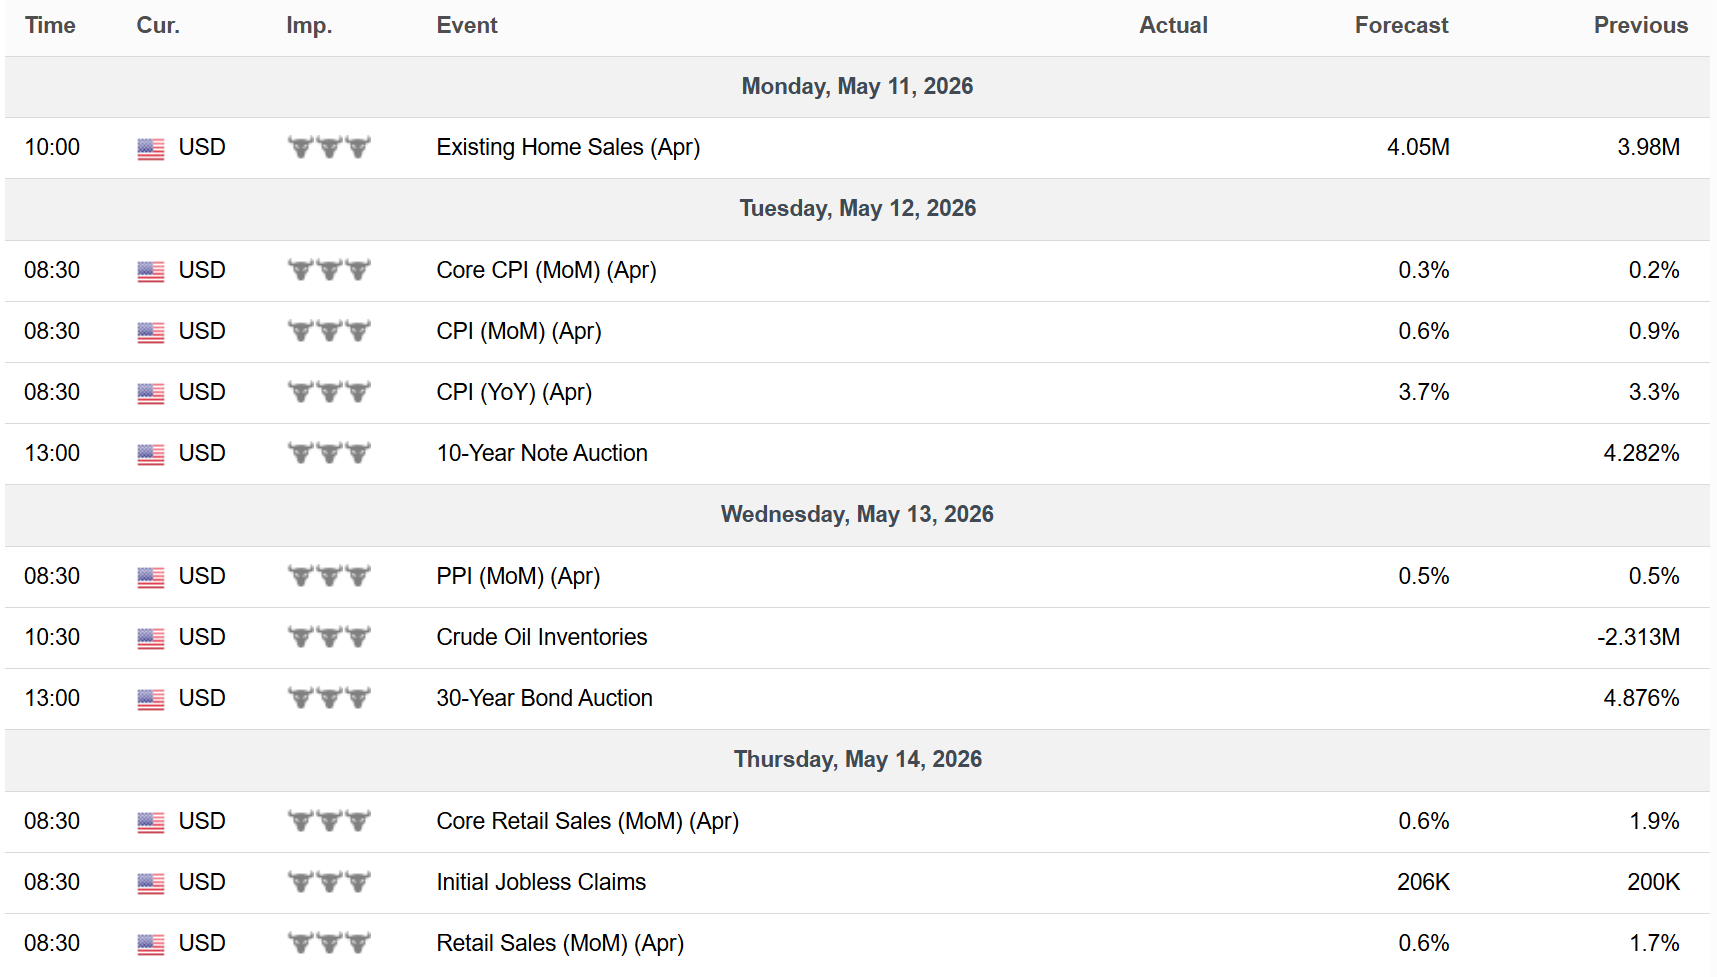
Key Upcoming Data
Economic Reports
Earnings Reports

I hope you’ve enjoyed The Market Mosaic, and please share this report with your family, friends, coworkers…or anyone that would benefit from an objective look at the stock market.
Become a member of the Traders Hub to unlock access to:
✅Model Portfolio
✅Members Only Chat
✅Trade Ideas & Live Alerts
✅Mosaic Vision Market Updates + More
Our model portfolio is built using a “core and explore” approach, including a Stock Trading Portfolio and ETF Investment Portfolio.
Come join us over at the Hub as we seek to capitalize on stocks and ETFs that are breaking out!
And if you have any questions or feedback, feel free to shoot me an email at mosaicassetco@gmail.com
Disclaimer: these are not recommendations and just my thoughts and opinions…do your own due diligence! I may hold a position in the securities mentioned in this report.