
The Market Mosaic 5.11.25
S&P 500: The rally is approaching key hurdles.

👋Welcome back to The Market Mosaic, where I gauge the stock market’s next move by looking at macro, technicals, and market internals. I’ll also highlight trade ideas using this analysis.
If you find this report helpful please hit that “like” button, share this post, and become a subscriber if you haven’t already done so!
🚨And be sure to check out Mosaic Traders Hub. It’s a members-only platform to alert trade ideas, track a model portfolio of open positions, and further analyze the message coming from the capital markets.
Now for this week’s issue…
After climbing 17% off the early April lows, the rally in the S&P 500 is starting to show signs of exhaustion.
There’s still plenty of headline risk for investors to contend with. The showdown between the U.S. and China over tariffs remains the dominant theme. The Trump administration is suggesting cuts to planned tariffs against China.
The two sides have also agreed to the first round of trade talks this weekend in Switzerland. Those are positive developments, but an end to the trade war is still far off.
While there is some easing of tensions on the trade front, the latest interest rate setting meeting by the Federal Reserve isn’t delivering any bullish catalysts. Despite capital market volatility this year, Fed Chair Powell reiterated his message that the Fed can take a “wait and see” approach to how tariffs are impacting the economy and inflation.
By leaving the fed funds rate unchanged at a level of 4.25%-4.50%, fed funds is the most restrictive relative to wage growth since 2008’s financial crisis as you can see in the chart below. The Fed is also continuing the balance sheet runoff. The Fed’s balance sheet assets now stands at $6.7 trillion compared to nearly $9 trillion at the peak.

Aside from headline risk and monetary policy headwinds, the S&P 500 is encountering several technical hurdles at a time when seasonality is becoming more bearish. But any setbacks could be temporary given the ongoing outperformance in the average stock.
This week, let’s look at key levels coming up for the S&P 500 and more evidence that the average stock is leading the indexes. We’ll also examine the collapse in the CBOE Volatility Index (VIX), and why silver could be ready to catch-up to gold’s breakout.
The Chart Report
The rally in the S&P 500 has retraced the entire post Liberation Day plunge, and is also retaking a key level by trading back above the 50-day moving average (MA - black line) for the first time since late February in the chart below. There are a few key technical hurdles coming up. The next price resistance level at 5790 also corresponds with the 200-day MA (green line). The RSI in the bottom panel is also at the 60 level, which can serve as an overbought zone if the index is in a downtrend. The RSI is also flashing a negative divergence (dashed line) by making a lower high point-to-point relative to price.

Although the S&P 500 is showing signs of exhaustion following a massive rally off the lows, measures of the average stock are pushing out to new highs. The S&P 500’s cumulative advance-decline line already moved out to new highs as I shared last week. You’re also seeing similar action in the Nasdaq 100 and the QQQ exchange-traded fund tracking the index. While QQQ remains in a 10% drawdown, the cumulative sum of advancing stocks relative to declining issues is making new highs as you can see below. That’s a way of tracking the average stock, and points to strength under the hood.

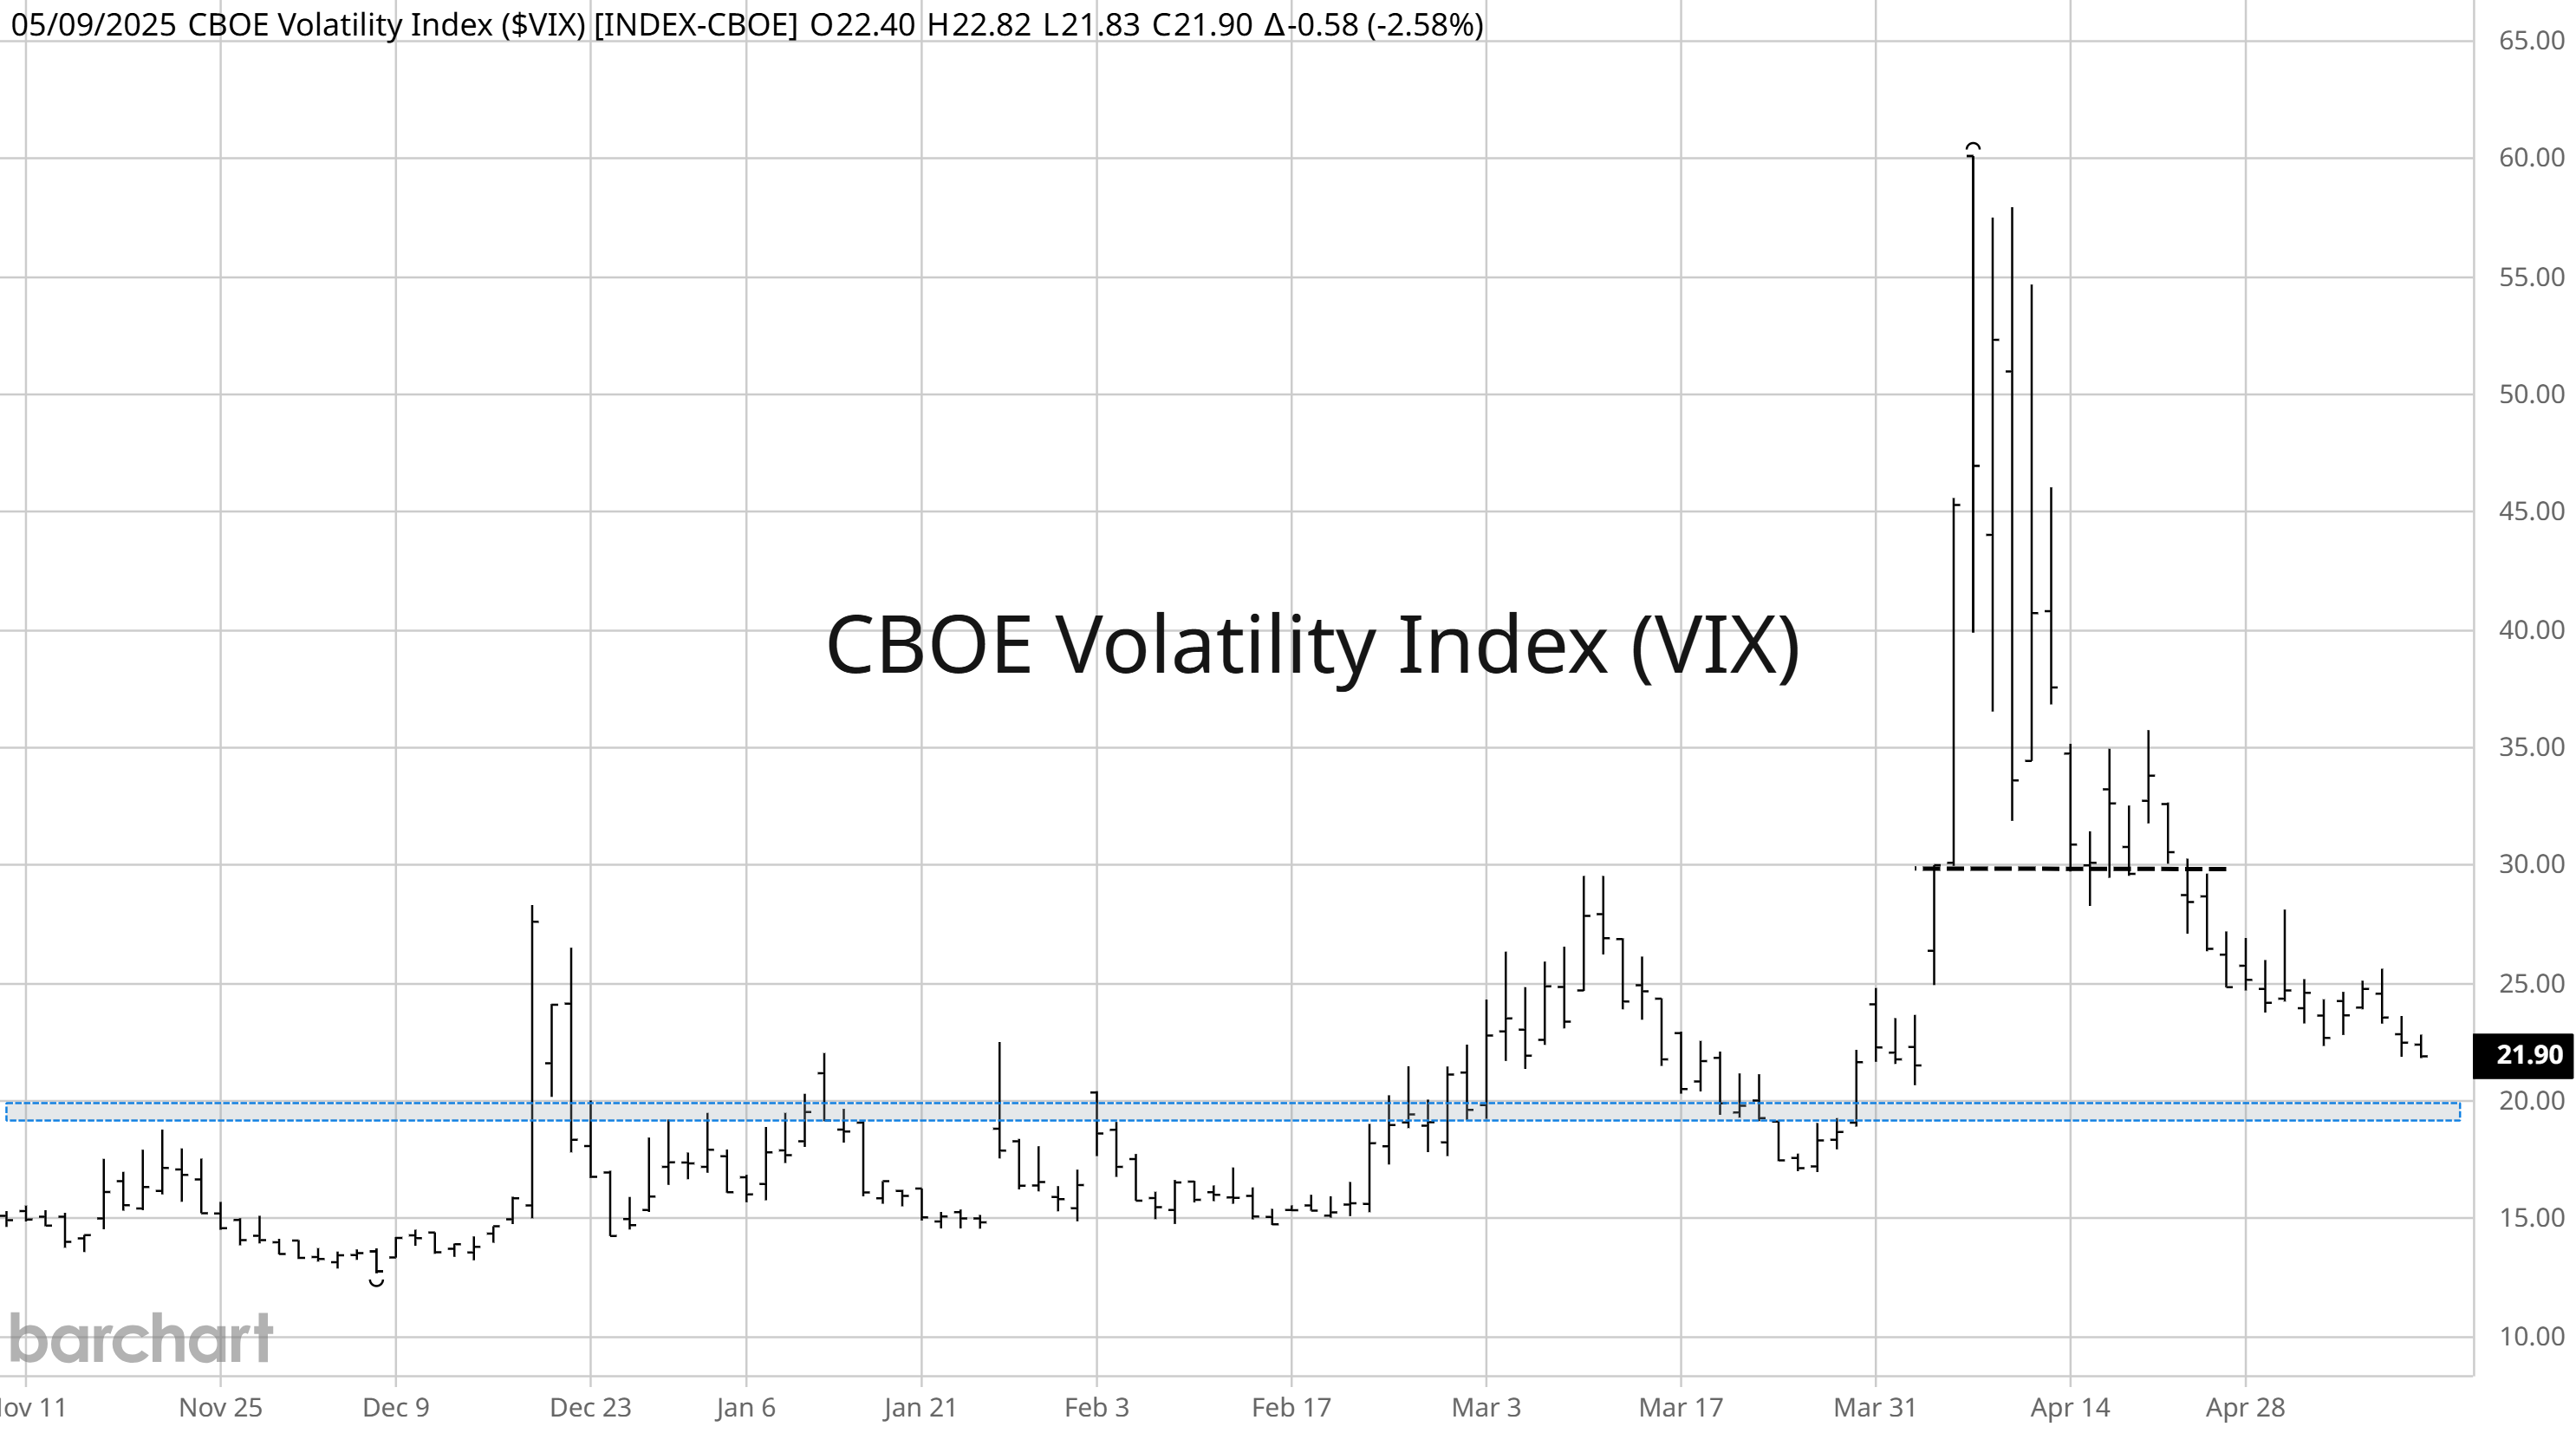
A collapse in volatility levels is drawing institutional fund flows back into the market, which has helped boost the average stock and trigger breadth thrusts in recent weeks. The VIX jumped to its highest closing level since the pandemic in early April. At the same time, positioning among risk parity and other volatility-targeting strategies turned extremely bearish. I previously noted how the drop below 30 (dashed line in the chart below) on the VIX would draw fund flows back to the market. Stabilizing markets led to the second-largest four week decline in VIX ever. Looking back, the 20 largest four-week drops in the VIX saw the S&P 500 gain 16.8% on average over the next year with an 89% win rate. The long-term average at 20 (shaded area) is the next key level to watch.
Following last week’s Fed meeting, Powell characterized inflation as “moving sideways at a fairly low level.” Despite the perceived lack of concern on the inflation front, it’s worth noting that several Fed district manufacturing surveys are a showing large acceleration in the prices paid component. The chart below plots the prices paid component of several Fed surveys with a six month lead on PCE consumer inflation. You can see those surveys are correlated with directional changes in PCE and shows inflation could be about to inflect higher.

Gold staged a historic breakout to new record highs back in late 2023 and has gained over 60% since then. But so far silver prices remain well below previous record highs and has lagged the relative gains seen in gold prices. You can see that with the ratio of gold to silver prices in the chart below. The ratio has risen to one of the highest levels since the dollar left the gold standard. While gold looks expensive relative to silver, there’s potential for both metals to keep rallying since an acceleration in inflation could be a positive catalyst. But watch for silver prices to stage their own breakout, with $35 per ounce the first key overhead resistance level.

Heard in the Hub
The Traders Hub features live trade alerts, market update videos, and other educational content for members.
Here’s a quick recap of recent alerts, market updates, and educational posts:
Where to find trading opportunities in a valuation bubble.
A historic valuation discount brewing in small-cap stocks.
Why strategic “buy and hold” investors are facing tough times ahead.
The bullish chart setup developing in Palantir (PLTR) and other leaders.
A new position in a biotech stock seeing a massive breakout to new highs.
You can follow everything we’re trading and tracking by becoming a member of the Traders Hub.
By becoming a member, you will unlock all market updates and trade alerts reserved exclusively for members.
👉You can click here to join now👈
Trade Idea
Newmont Corp (NEM)
Several gold miners are creating new breakout patterns including NEM. After peaking near the $60 level in October, the stock is forming the right side of a base. NEM recently tested resistance in late April, and is now making a smaller pullback. I’m watching for a move over $57.

Key Upcoming Data
Economic Reports

Earnings Releases

I hope you’ve enjoyed The Market Mosaic, and please share this report with your family, friends, coworkers…or anyone that would benefit from an objective look at the stock market.
Become a member of the Traders Hub to unlock access to:
✅Model Portfolio
✅Members Only Chat
✅Trade Ideas & Live Alerts
✅Mosaic Vision Market Updates + More
Our model portfolio is built using a “core and explore” approach, including a Stock Trading Portfolio and ETF Investment Portfolio.
Come join us over at the Hub as we seek to capitalize on stocks and ETFs that are breaking out!
And if you have any questions or feedback, feel free to shoot me an email at mosaicassetco@gmail.com
Disclaimer: these are not recommendations and just my thoughts and opinions…do your own due diligence! I may hold a position in the securities mentioned in this report.