
The Market Mosaic 4.9.23
Rate hikes are catching up to the real economy.

Welcome back to The Market Mosaic, where I gauge the stock market’s next move by looking at macro, technicals, and market internals. I’ll also highlight trade ideas using this analysis.
If you find this content helpful please hit that “like” button, share this post, and become a subscriber to this always free newsletter if you haven’t already done so!
And be sure to check out Mosaic Chart Alerts. It’s a midweek update covering my best chart setups among long and short ideas in the stock market, along with levels that could trigger a trade.
Now for this week’s issue…
When the March payrolls report came out on Friday, it showed that 236,000 jobs were created last month. That’s a drop from February’s pace, but was still roughly in line with economist expectations. The unemployment rate also dipped to 3.5%...holding near the lowest levels of the past 60 years.
Things may seem mostly okay on the jobs front, thus stirring little concern over the economic outlook. But the action in capital markets over the past week would argue otherwise.
Safe haven assets are rallying through key levels, indicating an increase in investor demand. That includes gold, which jumped through the $2,000 per ounce level and is on the verge of making a new all-time high.

In addition, the 10-year Treasury yield fell through a key near-term support level at 3.35%. That’s leading to an even sharper inversion of the 3-month/10-year yield curve, with only one other instance in history when the curve was more inverted.

In the stock market, cyclical sectors like small-caps and transportation stocks are struggling to hold onto key support levels like the 200-day moving average.
So despite an all-around decent jobs report, something has the capital markets all worked up.
I believe that’s because other recent indicators are revealing the Federal Reserve’s rapid pace of rate hikes are finally catching up to the real economy.
Lagging Indicators Catching Up
As the name implies, lagging economic indicators are among the last variables to reflect underlying changes in the economy. That also spotlights a key issue with monetary policy.
While the Fed is quickly ratcheting up rates to slow the economy and tame inflation, those hikes can take anywhere from 6 to 12 months to be felt in the economy. That means we might only just be feeling the economic impact from higher rates since the Fed started hiking at a historic pace (see below) just over a year ago.

Leading indicators have been warning of incoming weakness. That message was reinforced last week with the ISM reports on manufacturing and service sector activity. Not only did both reports miss expectations, the leading new orders component registered a sharp drop in both reports.
And while employment data is among the last variables to respond, cracks in the labor market are becoming more prominent despite Friday’s jobs report. That was evidenced in three other labor market reports this past week.
First, job openings registered a drop below 10 million. That may not sound very significant, but it’s the first time vacancies fell below that level in two years. The chart below shows openings in the top panel rolling over from an elevated level.

Next, announced layoffs totaled over 270,000 so far in 2023. That’s an increase of nearly 400% from the same period last year, with technology and financial job cuts seeing large increases.
Then came my preferred measure of tracking the labor market in real time with jobless claims. Reported on a weekly basis, jobless claims came in at 228,000 last week. While that’s still a low level in the historical context, the trend has been higher since claims bottomed out last September. You can see claims and layoff data in the chart below.

Even amidst signs that the labor market is showing cracks, we have yet to feel the full brunt of the Fed’s rate hikes. I believe this is the key driver behind the capital market’s growth scare messaging this past week.
With emerging deterioration in different labor market indicators, here’s what I expect will happen with the Fed and what it means for the stock market.
Now What…
Following the most recent jobs report and drop in the unemployment rate, market-implied odds for another rate hike at the next Fed meeting stands at 71% as you can see in the chart below. But in the grand scheme of things, the Fed will likely soon pause its campaign to assess the lag impact of actions taken thus far.

There’s debate among investors over what a pause would mean for stocks. Historically, pauses happen once the Fed realizes that cracks are emerging in the economy or things are starting to break in the capital markets…like what you’ve seen with the bank crisis.
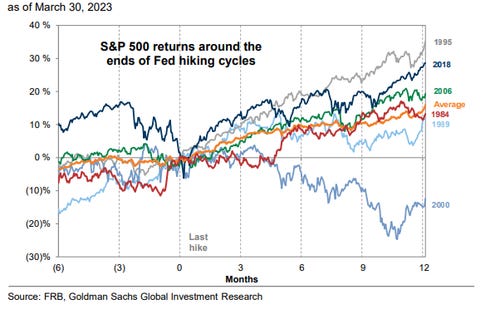
But the historical context of market performance following a pause is actually skewed positively. Since 1980, pauses in the tightening cycle have seen the S&P 500 gain an average of 12% over the next 12 months. More recent episodes and the subsequent path in the S&P 500 is shown below.
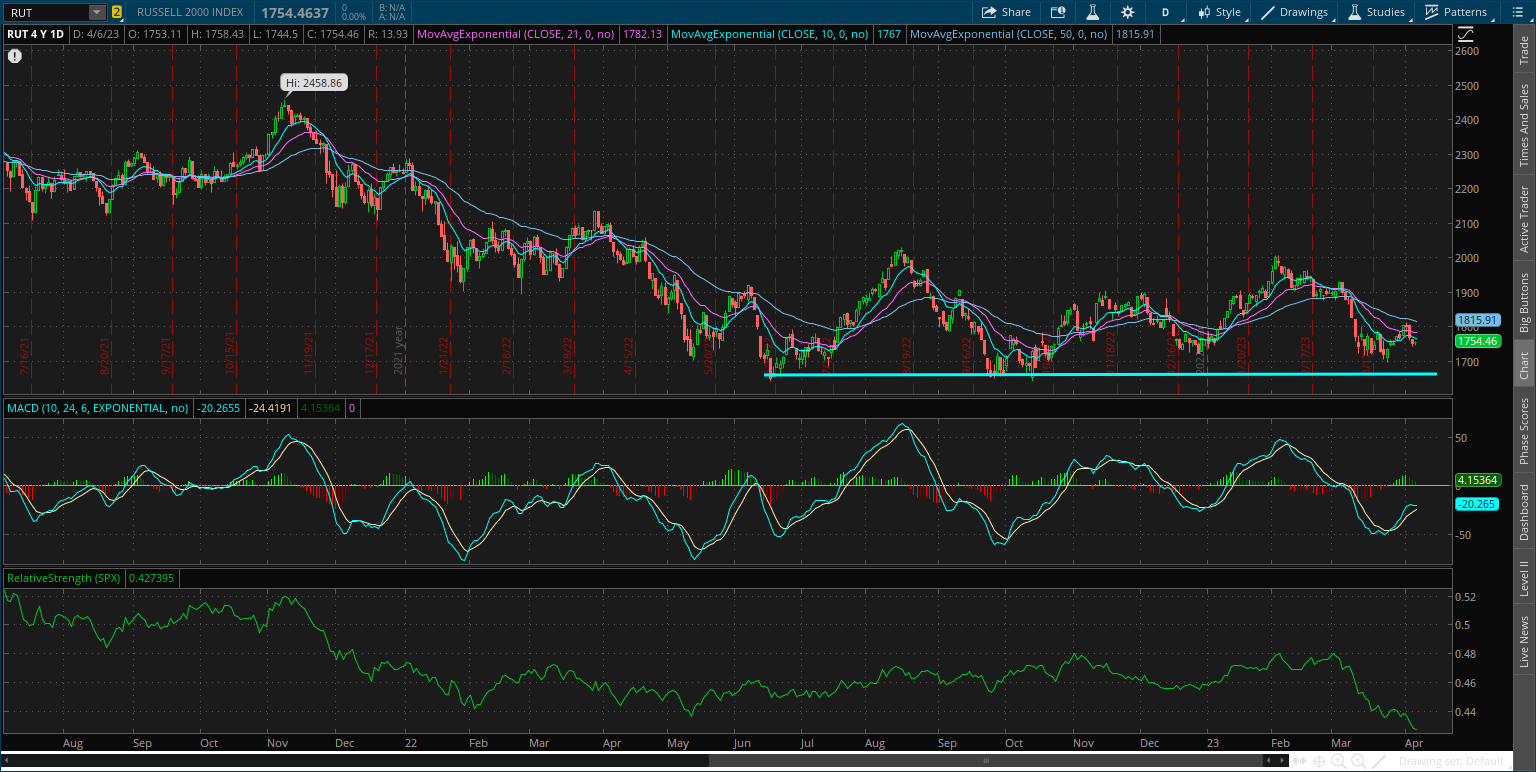
I will continue relying on the message coming from the stock market, particularly the performance of economically-sensitive cyclical sectors. The action over the past week is cause for concern, like with small-cap stocks that are trading near key support levels as you can see below.
Another area sensitive to developments in the economy is with high yield bonds. That’s why I’m also watching this pattern in the JNK high yield bond ETF. A break above or below the prevailing trendlines will provide a big clue about the economic outlook and mood of investors.

With the stock market reflecting growth concerns, I’m focusing on stocks bucking that trend and are generating significant earnings increases. That includes NSP, where earnings growth has accelerated for the past four quarters and most recently topped 256% year-over-year. I’m now watching for a breakout over the $125 level in the chart below to confirm positive financial trends.

That’s all for this week. There are emerging cracks in the labor market and clear signs of growth concerns reflected in the market’s price action. And with 1Q earnings season getting underway this week, I will be paying close attention to updated corporate outlooks to infer additional insights on the outlook and impact of the Fed’s unprecedented tightening campaign.
I hope you’ve enjoyed this edition of The Market Mosaic, and please share this newsletter with your family and friends…or anyone that would benefit from an objective look at the stock market.
And make sure you never miss an edition by subscribing here:
For updated charts, market analysis, and other trade ideas, give me a follow on Twitter: @mosaicassetco
And if you have any questions or feedback, feel free to shoot me an email at mosaicassetco@gmail.com
Disclaimer: these are not recommendations and just my thoughts and opinions…do your own due diligence! I may hold a position in the securities mentioned in this newsletter.