The Market Mosaic 4.28.24
Will stagflation take down the stock market?
Welcome back to The Market Mosaic, where I gauge the stock market’s next move by looking at macro, technicals, and market internals. I’ll also highlight trade ideas using this analysis.
If you find this content helpful please hit that “like” button, share this post, and become a subscriber to this always free report if you haven’t already done so!
And be sure to check out Mosaic Chart Alerts. It’s a midweek update covering chart setups among long and short trade ideas in the stock market, along with levels I’m watching.
Now for this week’s issue…
Bad news on the inflation front keeps rolling in, this time with the Federal Reserve’s preferred inflation gauge.
The disinflation trend since mid-2022 briefly brought the Personal Consumption Expenditures (PCE) price index back toward the Fed’s 2% inflation target. But the core figure, which strips out food and energy prices, stayed elevated at 2.8% in March compared to last year.
That’s unchanged from February and was slightly higher than economist estimates. But it’s the annualized trend in more recent months that bears careful monitoring. As you can see in the chart below, the annualized rate over the past three- and six-months is rising quickly.

At the same time, the initial look at 1Q gross domestic product (GDP) for the U.S. took a sharp turn lower. 1Q GDP was reported at 1.6% annualized growth compared to expectations for 2.5%. It was the first time GDP growth fell below 2% since the second quarter in 2022 as you can see below.
The reports on inflation and economic activity is stoking a combination of fears that investors don’t want to see. First, the GDP report suggests that the Fed’s prolonged restrictive monetary policy is finally biting into the economy.
But at the same time, recent inflation trends gives the Fed little wiggle room to ease policy even if economic activity is slowing. That’s showing up in odds for interest rate cuts, with markets now pricing just one cut for this year (table below). That compares to expectations for as many as seven cuts at the end of 2023.
A combination of slowing growth and stubborn inflation is conjuring up fears of “stagflation”, characterized by the 1970s era of persistently high inflation and uneven economic growth.
But before you succumb to the stagflation narrative, it’s worth looking under the hood at recent reports and what the weight of other evidence means for the economic outlook.
Inflation…But With Strong Growth
Stagflation headlines are out in full force following last week’s economic data. But one data point suggesting a weakening economy doesn’t mark a trend, especially when you look under the hood and consider the weight of other evidence.
The most recent GDP report was slowed by a jump in imports, which took off nearly one percent from the headline figure since imports are subtracted from GDP. But higher imports could actually be another sign of strong consumer spending.
On that front, consumer spending grew by 2.5% last quarter according to the GDP report, and the early evidence suggests this could accelerate further in the second quarter and drive GDP back higher as well.
That’s based on the initial forecast for second quarter GDP growth from the Fed’s Atlanta district, which maintains a real time estimate for current quarter GDP growth.
Their initial GDPNow figure came in at 3.9% annualized growth for the second quarter as you can see in the chart below. Consumer spending is driving 69% of the increase.
While its still early for the GDPNow figure in terms of collecting more data points (meaning it can be revised higher or lower from here), weekly jobless claims also provides a high frequency real-time look at the health of the labor market.
Jobless claims in the chart below were recently reported at 207,000. You can see that’s staying at low levels following the pandemic-driven jump in claims, and is near historic lows for the series as well going back over 50 years.
Other leading indicators are showing accelerating activity that I’ve reviewed recently. And that should come as no surprise with massive amounts of stimulus from federal spending bills now washing over the economy.
There’s $2 trillion in federal spending packages supporting things like traditional infrastructure and energy projects. The chart below compares current programs to past infrastructure stimulus programs in today’s dollars. That doesn’t even include things like the CHIPS Act supporting onshoring of the semiconductor supply chain.

While we might be facing a higher inflation environment, the “stagnating” part stagflation is missing. Consumer spending is strong, the labor market remains in good shape, and there’s more federal infrastructure spending on the way. While inflation and the rate outlook might pressure some areas of the stock market sensitive to valuations, it’s a tailwind for others.
Now What…
With a 2.7% gain, the S&P 500 delivered its best weekly return since November. Despite the strength, last week’s price action was an “inside candle” for the index as you can see in the weekly chart below (blue shaded box). That tends to represent a period of consolidation, with a move above or below the prior candle’s close likely hinting at the next short-term move.
In last week’s Market Mosaic, I discussed how oversold breadth and bearish sentiment were creating conditions for a stock market rally. Breadth is still working higher from oversold conditions, while bearishness among investors kept growing this past week.
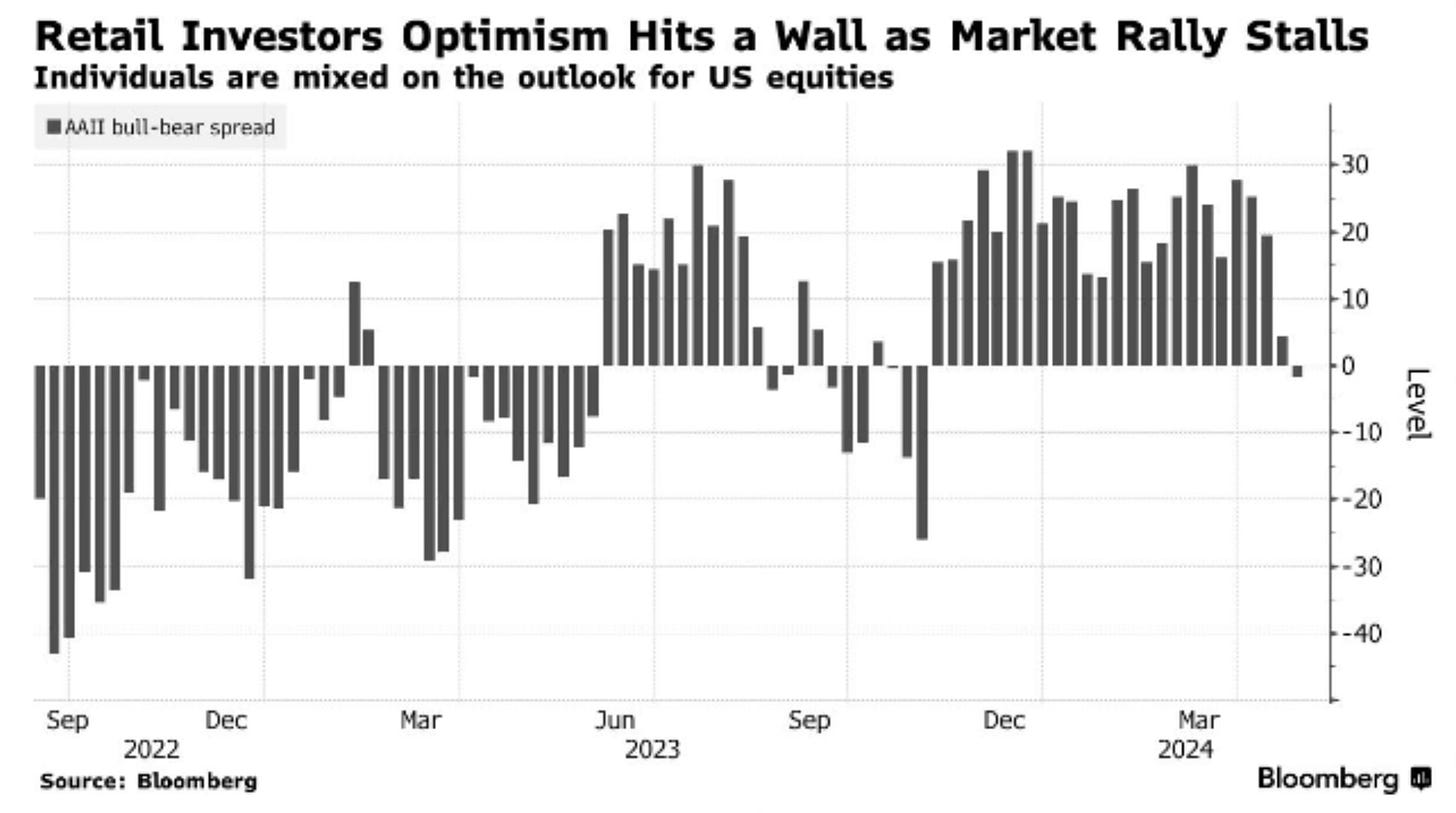
The AAII survey of retail investors showed more bearish outlooks than bullish in the most recent update. That’s the first time bears outnumbered bulls in six months as you can see in the chart below, and shows that sentiment is still a tailwind over the near-term.
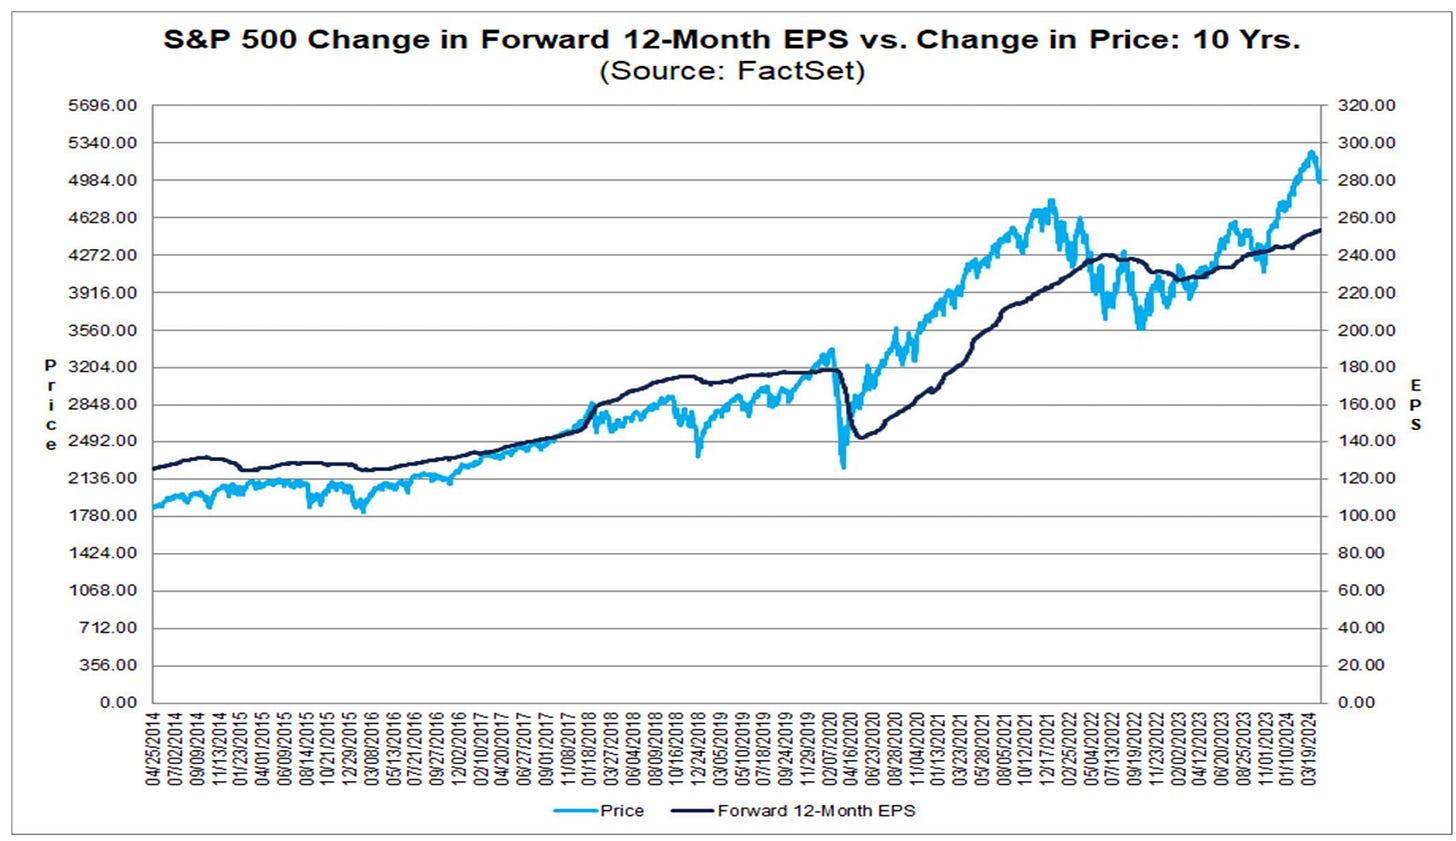
But for any rally attempt to be more than just a dead cat bounce, then earnings growth needs to be the driver. Earnings for the S&P will keep rolling in, and the good news is that forward earnings estimates keep working their way higher even as the S&P 500 has pulled back off its high (chart below).
The positive economic picture discussed above certainly helps the earnings outlook. But if economic growth stays strong and even starts accelerating, that should keep inflationary pressures high.
And historically, inflationary environments present obstacles for stock returns. That’s evident from numerous studies of asset class returns during inflationary regimes, including the chart below. It shows how various asset classes have performed during inflationary periods going back to 1965. And while stocks struggle, commodities are a clear standout which makes recent price action interesting.
When it comes to trading, I don’t add new positions based on an outlook, opinion, or forecast. I ultimately follow the price action in stocks breaking out from sound basing patterns. And commodity sectors continue to be an area where breakouts are working and new setups are proliferating.
Going back to November, I’ve highlighted breakouts in commodities like gold, silver, and copper as well as related producers like Freeport-McMoRan (FCX). Yet there are more areas setting up, like uranium stocks that I highlighted in last week’s Mosaic Chart Alerts.
I also touched on oil exploration and production companies in my video update with the XOP exchange-traded fund. I’m also following a fund holding a broader basket of commodities with the Invesco DB Commodity Index Fund (DBC).
The chart below shows the monthly candle stick chart for DBC going back to 2010 along with the MACD indicator. The peak in price in 2022 tested resistance from 2012 while the MACD became extended. The pullback since 2022 reset the MACD at the zero line, while price could be making a new uptrend with higher lows since May 2023. I’m watching if price can clear the $24.50 level, which can setup a test of 2022’s highs. Also note that DBC has a heavy allocation to oil and gas, so that will have a big impact on returns.
That’s all for this week. The coming week is packed with important events to drive stock market volatility. That includes the Fed rate-setting meeting that concludes on Wednesday, while the April jobs report will be released on Friday. On top of that, 175 companies in the S&P 500 are due to report earnings. I’ll be watching how breadth and sentiment conditions evolve, and if the next round of commodity breakouts are underway.
I hope you’ve enjoyed The Market Mosaic, and please share this report with your family, friends, coworkers…or anyone that would benefit from an objective look at the stock market.
And make sure you never miss an edition by subscribing here:
For updated charts, market analysis, and other trade ideas, give me a follow on X: @mosaicassetco
And if you have any questions or feedback, feel free to shoot me an email at mosaicassetco@gmail.com
Disclaimer: these are not recommendations and just my thoughts and opinions…do your own due diligence! I may hold a position in the securities mentioned in this report.


I noticed that your MACD is set to 10, 24, 6. Is this because price action is more volatile for this market?