The Market Mosaic 4.27.25
S&P 500: Are breadth thrusts signaling the end of market turmoil?
👋Welcome back to The Market Mosaic, where I gauge the stock market’s next move by looking at macro, technicals, and market internals. I’ll also highlight trade ideas using this analysis.
If you find this report helpful please hit that “like” button, share this post, and become a subscriber if you haven’t already done so!
And be sure to check out Mosaic Traders Hub. It’s a members-only platform to alert trade ideas, track a model portfolio of open positions, and further analyze the message coming from the capital markets.
🚨You can start a 7-day free trial to the Hub by clicking here. By starting a trial, you will unlock all market updates and trade alerts reserved exclusively for members.
Now for this week’s issue…
Stocks posted a sharp drop to start last week as President Trump intensified a war on another front…this time against the Federal Reserve.
Trump continued his attacks on Fed Chair Jerome Powell, and referred to him as a “major loser” for not cutting interest rates further. That followed reports that Trump was seeking avenues to remove Powell from his position.
But by mid-week, signs emerged that the administration was seeking to de-escalate tensions with the central bank and key trading partners. Treasury Secretary Bessent delivered the initial spark, commenting that the trade war with China is unsustainable.
Trump followed by stating the current China tariff rate of 145% will “come down substantially.” He also eased tensions with the central bank, commenting that he has “no intention of firing” Powell.
The market reaction shows the binary nature of issues facing investors. Following Monday’s weakness, the stock market staged a massive rally through the rest of the week. The S&P 500 ultimately finished the week with an 4.6% gain.
It also sent the CBOE Volatility Index (VIX) below key levels. You can see in the chart below that the VIX moved below recent support at the 30 level. I believe that served as a major catalyst for drawing systematic fund flows from volatility-targeting and risk-parity strategies. Falling VIX levels creates room for equity purchases from systematic investors operating within a risk budget.
Positioning among institutional investors and active fund managers had become excessively bearish. That means any positive catalyst could help drive institutional investors back into the market. And there’s plenty of evidence over the past week of their activity.
This week, let’s look at signs of breadth thrusts and more evidence that the economy is holding up (so far) against trade war driven uncertainty. We’ll also examine one missing ingredient behind a V-bottom in the S&P 500, and why a retest of April’s lows could be in store.
The Chart Report
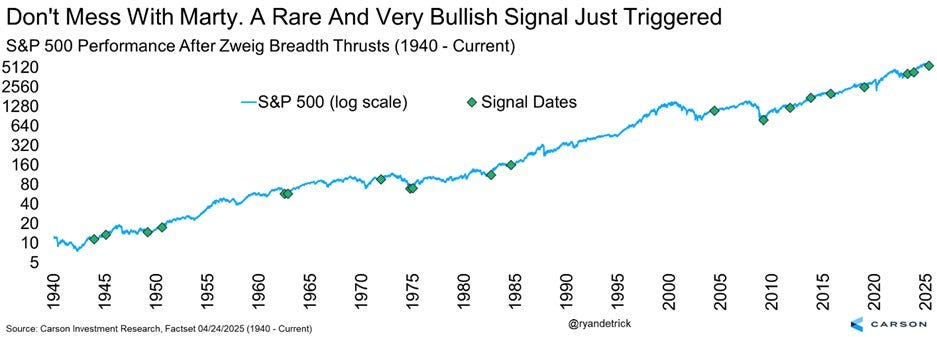
A cluster of trading sessions seeing strong advance/decline metrics is triggering breadth thrusts. I would argue that the original thrust triggered back on April 9 when the NYSE advance/decline ratio registered 37/1. That was the strongest ratio in over 15 years, and was subsequently followed by another session on April 22 that saw a 12/1 reading. Surging performance in the average stock was enough to trigger a rare Zweig Breadth Thrust (ZBT). A ZBT essentially looks for the number of stocks participating in a rally to rapidly increase. The chart below shows previous signal dates overlaid with the S&P 500. Following past ZBT’s, the S&P 500 has been higher 6- and 12-months out during every instance.

A string of large daily gains in the S&P 500 is also triggering a performance-based thrust indicator. The chart below plots when the S&P 500 experiences a consecutive three day period where the index gains at least 1.5% on day one, 1.15% on day two, and another jump of 1.5% on day three. You can see past instances overlaid with the S&P 500, which have tended to cluster around past significant bear market lows going back 40 years.
Reciprocal tariffs and trade war headlines are taking a toll on consumer and business sentiment. But so far, deteriorating sentiment isn’t showing up in the hard data in any major way. Initial jobless claims offer a high frequency real-time look at the labor market, and are running near historically low levels. At the same time, the Fed’s New York district maintains an updated estimate for quarterly GDP. Their annualized first quarter figure currently stands at 2.6%, and has trended near that level since the start of the year (chart below).
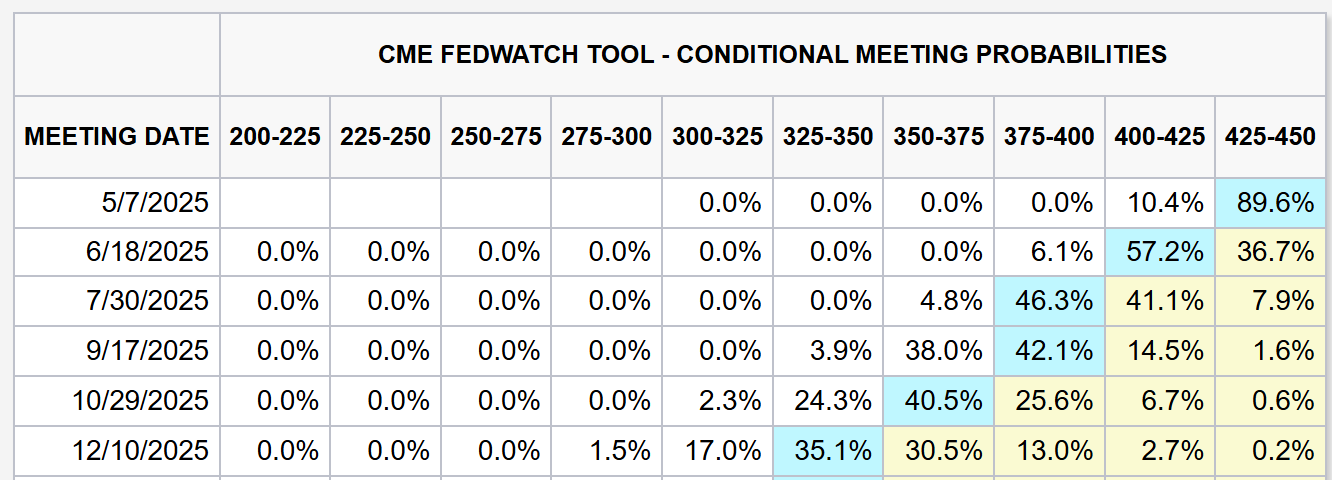
Evidence of a strong labor market and concerns over how tariffs could impact the inflation outlook is keeping the Fed on hold when it comes to interest rates. Powell recently commented that “we are well positioned to wait for greater clarity before considering any adjustments to our policy stance.” But market-implied odds are starting to shift in favor of more rate cuts through year-end. The chart below shows that odds are favoring four cuts of 0.25% happening this year starting with the Fed’s June meeting.
Examining previous market selloffs can provide context of how the S&P 500 could play out looking ahead. The big question for investors is if a retest of April’s lows could happen, or if a V-bottom takes shape. That’s a scenario where the S&P continues to rally without experiencing much of a retracement. Recent selloffs that saw a V-bottom include the pandemic bear market in 2020 and selloff at the end of 2018. Both V-bottoms were supported by dovish Fed pivots on policy stance or outright massive stimulus in the case of the pandemic. With the Fed holding tight for now, I do think a retest of the April lows is a likely event once we hit another patch of seasonal weakness. The 1998 analog retest makes an interesting comparison (chart below). Other recent periods to study back tests of the low include the selloffs in 2011, 2015, and 2016.

Heard in the Hub
The Traders Hub features live trade alerts, market update videos, and other educational content for members.
Here’s a quick recap of recent alerts, market updates, and educational posts:
Why the smart money running scared is a good thing.
Adding new long positions and tracking new trade setups.
My favorite indicator for tracking the phases of stock price trends.
How to track the potential for breadth thrusts before they happen.
The best chart for tracking the real-time performance of the economy.
You can follow everything we’re trading and tracking by becoming a member of the Traders Hub.
By becoming a member, you will unlock all market updates and trade alerts reserved exclusively for members.
👉You can click here to join now👈
Trade Idea
Halozyme Therapeutics (HALO)
Peaked near the $65 area back in August and started a new consolidation pattern. HALO is recently testing resistance again in March and now making a smaller pullback. Would like to see one more pullback off another test of $65 to reset the MACD above zero, followed by a breakout over $65 to new highs.
Key Upcoming Data
Economic Reports
Earnings Releases
I hope you’ve enjoyed The Market Mosaic, and please share this report with your family, friends, coworkers…or anyone that would benefit from an objective look at the stock market.
Become a member of the Traders Hub to unlock access to:
✅Model Portfolio
✅Members Only Chat
✅Trade Ideas & Live Alerts
✅Mosaic Vision Market Updates + More
Our model portfolio is built using a “core and explore” approach, including a Stock Trading Portfolio and ETF Investment Portfolio.
Come join us over at the Hub as we seek to capitalize on stocks and ETFs that are breaking out!
And if you have any questions or feedback, feel free to shoot me an email at mosaicassetco@gmail.com
Disclaimer: these are not recommendations and just my thoughts and opinions…do your own due diligence! I may hold a position in the securities mentioned in this report.


https://fred.stlouisfed.org/series/USEPUINDXD Thanks for all the tools you share. I hope you don't mind one more chart. I only learned about this one today. I notice an increased volatility since November.