The Market Mosaic 4.21.24
Conditions emerging for a rally in stocks.
Welcome back to The Market Mosaic, where I gauge the stock market’s next move by looking at macro, technicals, and market internals. I’ll also highlight trade ideas using this analysis.
If you find this content helpful please hit that “like” button, share this post, and become a subscriber to this always free report if you haven’t already done so!
And be sure to check out Mosaic Chart Alerts. It’s a midweek update covering chart setups among long and short trade ideas in the stock market, along with levels I’m watching.
Now for this week’s issue…
Monetary policy, interest rates, and geopolitical tensions keep pressuring stocks and led the S&P 500 to its worst weekly decline in over a year.
In comments following a hotter than expected consumer inflation report for March, Federal Reserve Chair Jerome Powell acknowledged that pricing pressures are not moving in the right direction.
Rather than discussing the outlook for rate cuts, Powell stated that the Fed can maintain the current level of restrictive rates for as long as needed if high inflation persists.
The chart below shows how the market-implied level for the fed funds rate has evolved since the start of the year for the Fed’s June and December meeting. As hopes for rate cuts keep getting dashed, market-implied odds are moving toward the current fed funds level at a range of 5.25-5.50%. Rates across the Treasury yield curve are shifting higher as well.
Geopolitical tensions in the Middle East are also unnerving investors, which is driving strength in the U.S. Dollar Index. The dollar has rallied 5.1% since touching support near 100 in late December, and is now back to the high-end of its trading range that stretches back to the start of 2023.
This is notable since sector returns during a stronger dollar environment historically takes on a defensive tone as you can see in the chart below. During a stronger dollar regime, consumer staples, health care, and utilities lead the way.
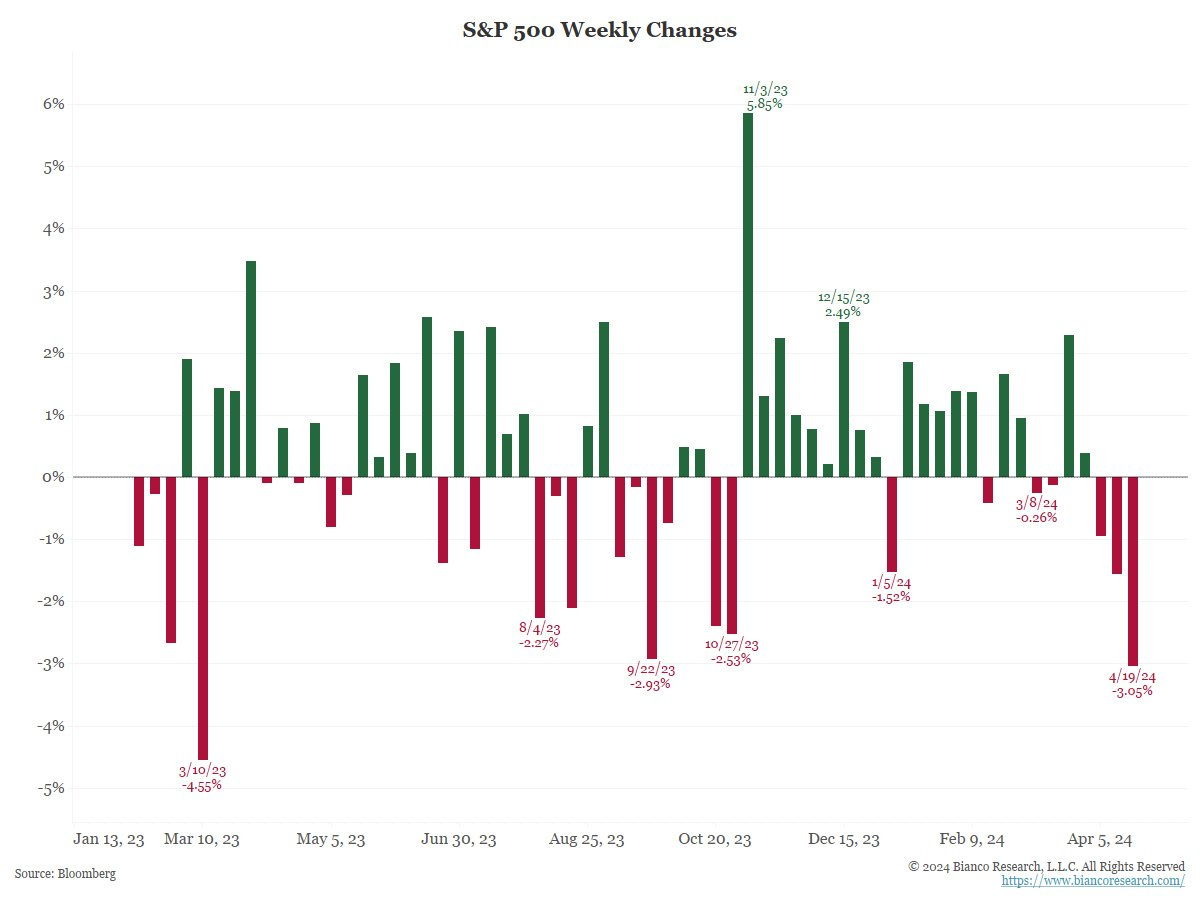
A stronger dollar, higher interest rates, and an uncertain Fed outlook are stacking headwinds against stock prices. Not only did the S&P 500 finish its third consecutive week lower, but last week’s 3.1% decline was the worst week since March 2023 (chart below) when the bank crisis was in full swing.

That’s left the S&P more than 5% off the high from the end of March. But several signs are emerging across breadth and sentiment indicators showing that the pullback may have run its course. Here are several key metrics reaching extremes that could mark a turning point in the stock market.
Conditions Can Support A Rally
Regardless of the narrative driving stock prices, I always come back to my process focusing on the intersection of investor sentiment, the stock market’s trend, and participation in that trend (breadth) to form my near-term outlook.
Combining breadth and sentiment works particularly well at extremes, and can tip key turning points in the stock market. And that’s why I’m focusing on several metrics showing heightened investor fear and oversold conditions.
I’ve been sharing several breadth indicators over the past week that are reaching extremely oversold levels. That includes the McClellan Oscillator that I highlighted here along with the percent of stocks trading above their 20-day moving average (MA) across the market that you can see below.
While oversold conditions alone can precede a rally, the really powerful signals come from positive divergences. That’s when breadth metrics show that the average stock is holding up better than the indexes, and you saw that with Friday’s price action.
Despite the S&P dropping 0.88% and the Nasdaq’s 2.05% decline on Friday, small-caps finished the day slightly positive. Look back at the chart above, and you can see that the percent of stocks trading above short-term uptrends improved on Friday. That’s the type of positive divergence needed to see the stock market stabilize.
Sentiment indicators are also becoming more constructive for a rally, with the pullback wiping out excessive bullish sentiment. If anything, fear is becoming the prevailing emotion in the stock market.
CNN’s Fear & Greed Index is firmly into “fear” territory with the lowest reading since late October, while the AAII’s retail investor survey showed bearish views jump from 24% to 34% over the past week and is now above the long-term average bearish reading. Traders are also scooping up more put options relative to calls, showing a spike in bearish bets that you can see below. Last week, the equity put/call ratio jumped to one of the higher readings over the past two years, while the 10-period moving average is elevated as well.
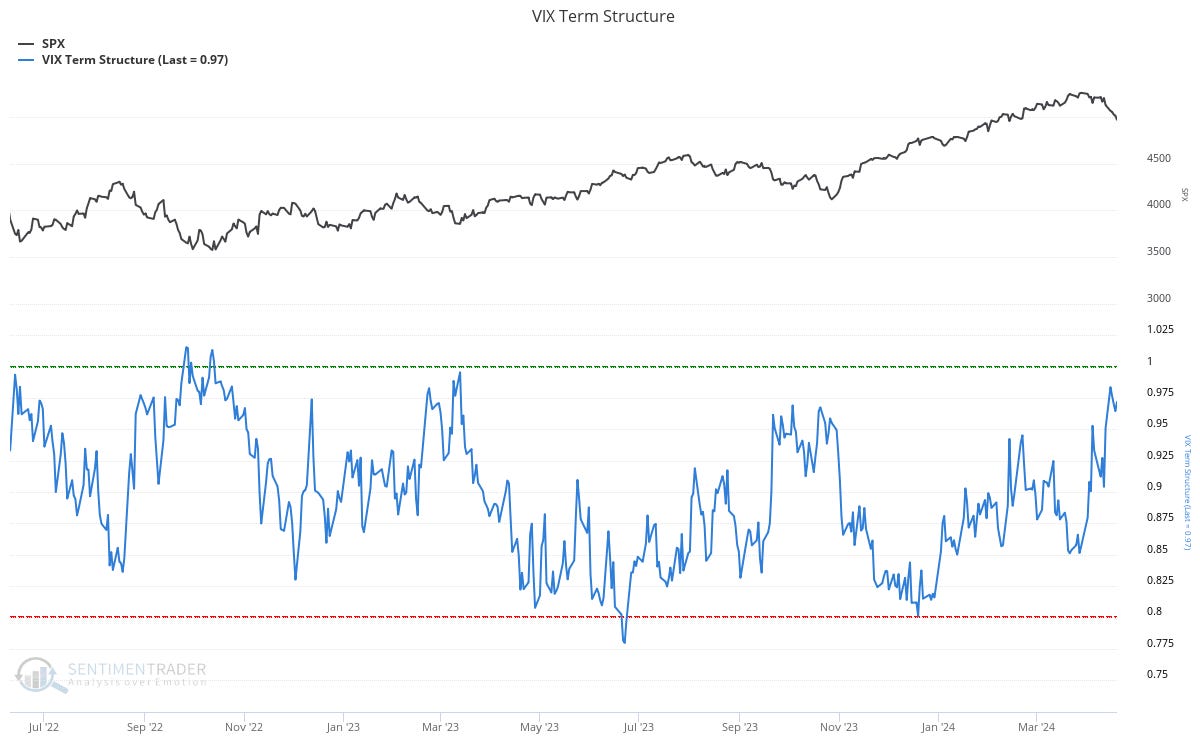
Another lesser-followed sentiment indicator is nearing a level showing too much fear, and that’s with futures contracts linked to the Volatility Index (VIX). VIX measures implied volatility for the S&P 500, and the term structure of VIX futures can be used as a fear gauge.
The term structure compares the level of front month VIX futures to futures that expire further out (three months out for the chart below). When front month futures push toward the further out month, that’s a good sign of too much fear in the market. Note that the current ratio is higher than what was seen at last October’s bottom in the S&P 500.
These are conditions which are producing a favorable backdrop to see at least a short-term bottom in the stock market. The signal ultimately comes from price action, and the drivers behind that price action needs to shift gears from multiple expansion to earnings growth for the rally to continue.
Now What…
The level of stock prices ultimately comes down to earnings, and what investors are willing to pay for those earnings through measures like the price-to-earnings (P/E) ratio.
Since the bull market started in October 2022, multiple expansion has been the primary driver of returns and has left the S&P 500’s forward P/E ratio at nearly 21x versus the 30-year average of 16.6x (chart below). This is where the concern over inflation and the impact on interest rates comes into play, since it places downward pressure on valuation multiples.

So for the bull market to continue, an earnings recovery needs to offset the headwinds to valuations especially if inflation levels stay high. The good news is that the earnings contribution to the rally is growing stronger.
The chart below (h/t Daily Chartbook) looks at the year-over-year return in the S&P 500, and the portion of gains being driven by valuation multiples versus earnings gains. Valuation multiples did the heavy lifting at the start of this bull market as investors discounted an earnings recovery. That recovery looks to be underway, with earnings having a 53% contribution to the annual return in March.
And I believe that recovery can continue amidst signs of accelerating economic activity. Just last week, we also received an updated look at the Conference Board’s Leading Economic Index for March. The year-over-year rate of change (ROC) is continuing to turn higher off a low level. It’s also worth noting that an improving ROC from a depressed level is historically the most positive regime for stock returns.
If earnings are getting a boost from accelerating economic activity, then I would expect cyclical stocks to perform well. I’ve previously written about the breakouts in cyclicals and commodities, including copper prices and related mining stocks. The next group I’m watching is with oil exploration and production companies.
The chart below shows the XOP exchange-traded fund that holds oil and gas companies like ConocoPhillips (COP) and Exxon Mobil (XOM). Price recently tested resistance at the $160 level and is pulling back. That’s creating a bullish reset in the MACD above the zero line. If price can turn back higher and break above $160, then that could lead to an even bigger move over 2022’s high at the $170 level.
That’s all for this week. The coming two week stretch will see over 60% of the S&P 500 report earnings. If the outlook for earnings is intact, then updated outlooks from corporate management teams should show up in higher forward earnings estimates. Next week also see the March PCE inflation report, which is the Fed’s preferred inflation gauge. Regardless of the outcomes, I’ll be watching if breadth and sentiment can get the stock market rally back on track.
I hope you’ve enjoyed The Market Mosaic, and please share this report with your family, friends, coworkers…or anyone that would benefit from an objective look at the stock market.
And make sure you never miss an edition by subscribing here:
For updated charts, market analysis, and other trade ideas, give me a follow on X: @mosaicassetco
And if you have any questions or feedback, feel free to shoot me an email at mosaicassetco@gmail.com
Disclaimer: these are not recommendations and just my thoughts and opinions…do your own due diligence! I may hold a position in the securities mentioned in this report.


