
The Market Mosaic 4.20.25
The "hard" data is holding up for now.

👋Welcome back to The Market Mosaic, where I gauge the stock market’s next move by looking at macro, technicals, and market internals. I’ll also highlight trade ideas using this analysis.
If you find this report helpful please hit that “like” button, share this post, and become a subscriber if you haven’t already done so!
And be sure to check out Mosaic Traders Hub. It’s a members-only platform to alert trade ideas, track a model portfolio of open positions, and further analyze the message coming from the capital markets.
🚨You can start a 7-day free trial to the Hub by clicking here. By starting a trial, you will unlock all market updates and trade alerts reserved exclusively for members.
Now for this week’s issue…
More victims of the trade war and rising tensions between the White House and U.S. central bank is driving more stock market volatility.
The week started with optimism after a large portion of product imports from China would be exempt from reciprocal tariffs. That included smartphones and other consumer electronics.
But just days later, the Trump administration banned Nvidia from selling its H20 processor to China. The chip is utilized in artificial intelligence applications, while Nvidia said that it will record a $5.5 billion charge due to the ban.
While the trade war with China drags on, tensions are rising elsewhere following comments from Federal Reserve Chair Jerome Powell. In prepared remarks last week, Powell stated that “we are well positioned to wait for greater clarity before considering any adjustments to our policy stance.”
Powell’s comments reinforce the Fed’s current stance to hold interest rates steady over fears that tariffs will boost inflation. Trump disagrees, and is threatening to fire the central bank chairman if the Fed doesn’t start cutting interest rates.
The ongoing uncertainty helped push stocks lower last week, with the S&P 500 closing down 1.5% and the Nasdaq Composite losing 2.6%. The S&P also saw it’s first “death cross” since 2022’s bear market, where the 50-day moving average (MA) crosses below the 200-day MA (arrow on the chart).

But despite the negative headlines, there have been positive developments under the stock market’s hood along increasing evidence that investor positioning is reaching bearish extremes.
This week, let’s look at signs of improving market breadth and why the trade war isn’t showing up in the hard data just yet. We’ll also examine a recent move in VIX that could help spark buying pressure despite volatility staying elevated.
The Chart Report
The impact of economic uncertainty around tariffs is showing up in the “soft” data, but has yet to really make an appearance in the “hard” data. Soft data (orange line below) includes survey-based indicators of economic activity and the outlook. Consumer sentiment surveys as well as purchasing managers’ indexes have seen sharp deterioration in the wake of tariffs and retaliatory measures. But for the most part, actual economic data (blue line below) is still holding up. Most hard measures are trailing, so the impact of tariffs might not be showing up just yet. But it’s worth noting that coincident indicators like initial jobless claims are running at levels associated with a strong economy.

Similar to soft versus hard economic data, investor sentiment can be measured through surveys (soft) as well as actual positioning (hard) data. Survey-based indicators were among the first to show extreme bearishness among investors. The AAII survey asks retail investors about the outlook for stock prices. The percent of respondents with bearish views first jumped above 50% back on February 26. Bearish views have stayed above 50% for eight consecutive weeks now, which is the longest streak ever as you can see below.

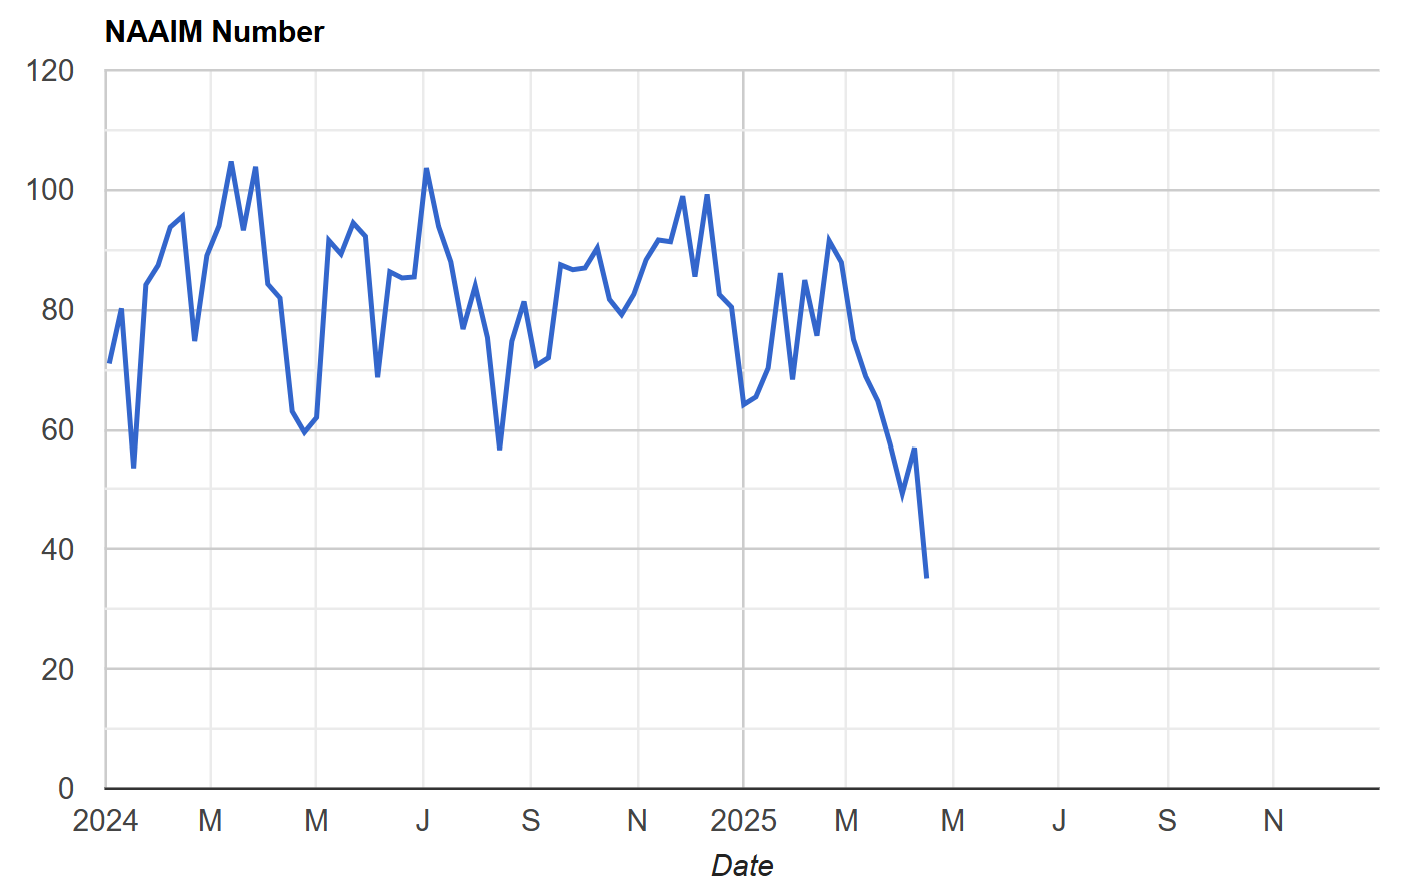
For the most part, actual investor positioning has been much slower to indicate extreme bearishness among investors. But more measures have been catching up, like positioning among systematic equity funds that I shared here. Active investment managers are finally dropping exposure to low levels as well. The National Association of Active Investment Managers releases a weekly index of average equity exposure. That figure dropped to 35 last week (chart below), which is a sharp drop from the prior reading of 57. That’s the lowest level of equity exposure since the last correction in late 2023.
Just as more positioning data is turning excessively bearish, there are signs of improving breadth from oversold levels. Despite the S&P 500 moving lower last week, the percent of stocks across the market trading above their 20-day moving average continued to move higher. The improvement in the average stock is showing up in the McClellan Summation Index as well, which sums an oscillator tracking advancing versus declining stocks on the NYSE. The Summation Index is inflecting higher in the chart below, and is close to trigging a bullish crossover above its 10-period MA.

Volatility levels coupled with equity positioning data could help fuel more upside. Volatility-targeting strategies are forced to reduce equity exposure when equity volatility levels pick up. Systematic selling forces more downside and higher VIX levels in a negative feedback loop. But it works the other way around as well where falling volatility levels allows for systematic buying. In the near-term, keep close watch on the 30 level with VIX (chart below) which has held over the past few trading sessions. A move below could unleash a wave of buying from volatility-targeting funds, who have dropped their equity exposure to the lowest levels since the pandemic.

Tracking commodity prices could hint at where the hard economic data could be heading. Copper prices in particular are sensitive to the economic outlook given their broad exposure to various construction and infrastructure end markets. Copper prices are holding up near the prior all-time highs, and are creating a bullish breakout pattern. The weekly chart below shows copper prices back to 2018. Since 2022’s pullback, copper prices are making a series of higher lows while testing resistance around $5 per pound on several occasions. A breakout could be a positive signal on the economic outlook.

Heard in the Hub
The Traders Hub features live trade alerts, market update videos, and other educational content for members.
Here’s a quick recap of recent alerts, market updates, and educational posts:
Lessons from another D.C.-driven market meltdown.
Tracking systematic investors and their next big move.
How the S&P 500 performs following a waterfall decline.
Industries that are the best candidates for new stock trades.
Breaking down past market action around breadth thrust indicators.
You can follow everything we’re trading and tracking by becoming a member of the Traders Hub.
By becoming a member, you will unlock all market updates and trade alerts reserved exclusively for members.
👉You can click here to join now👈
Trade Idea
Stantec (STN)
Infrastructure services company setting up a base under the $90 level. The stock is making a smaller pullback off resistance. I would prefer to see one more smaller pullback from here that resets the MACD at the zero line, followed by a breakout over $90.

Key Upcoming Data
Economic Reports

Earnings Releases

I hope you’ve enjoyed The Market Mosaic, and please share this report with your family, friends, coworkers…or anyone that would benefit from an objective look at the stock market.
Become a member of the Traders Hub to unlock access to:
✅Model Portfolio
✅Members Only Chat
✅Trade Ideas & Live Alerts
✅Mosaic Vision Market Updates + More
Our model portfolio is built using a “core and explore” approach, including a Stock Trading Portfolio and ETF Investment Portfolio.
Come join us over at the Hub as we seek to capitalize on stocks and ETFs that are breaking out!
And if you have any questions or feedback, feel free to shoot me an email at mosaicassetco@gmail.com
Disclaimer: these are not recommendations and just my thoughts and opinions…do your own due diligence! I may hold a position in the securities mentioned in this report.