
The Market Mosaic 4.19.26
S&P 500 Soars — Can the Bulls Hold the Line?

👋Welcome back to The Market Mosaic, where I gauge the stock market’s next move by looking at macro, technicals, and market internals. I’ll also highlight trade ideas using this analysis.
If you find this report helpful please hit that “like” button, share this post, and become a subscriber if you haven’t already done so!
🚨And be sure to check out Mosaic Traders Hub. It’s a members-only platform to alert trade ideas, track a model portfolio of open positions, and further analyze the message coming from the capital markets.
Now for this week’s issue…
Conflicting reports on the status of peace talks between the U.S. and Iran along with uncertainty over the flow of ship traffic through the Strait of Hormuz is setting up a volatile week ahead.
The S&P 500 surged to another record high to end last week, with a 12.3% overall gain in just the past 13 sessions. The strong finish to the week followed reports that peace talks between the U.S. and Iran were making solid progress while the Strait of Hormuz appeared to be open for tanker traffic.
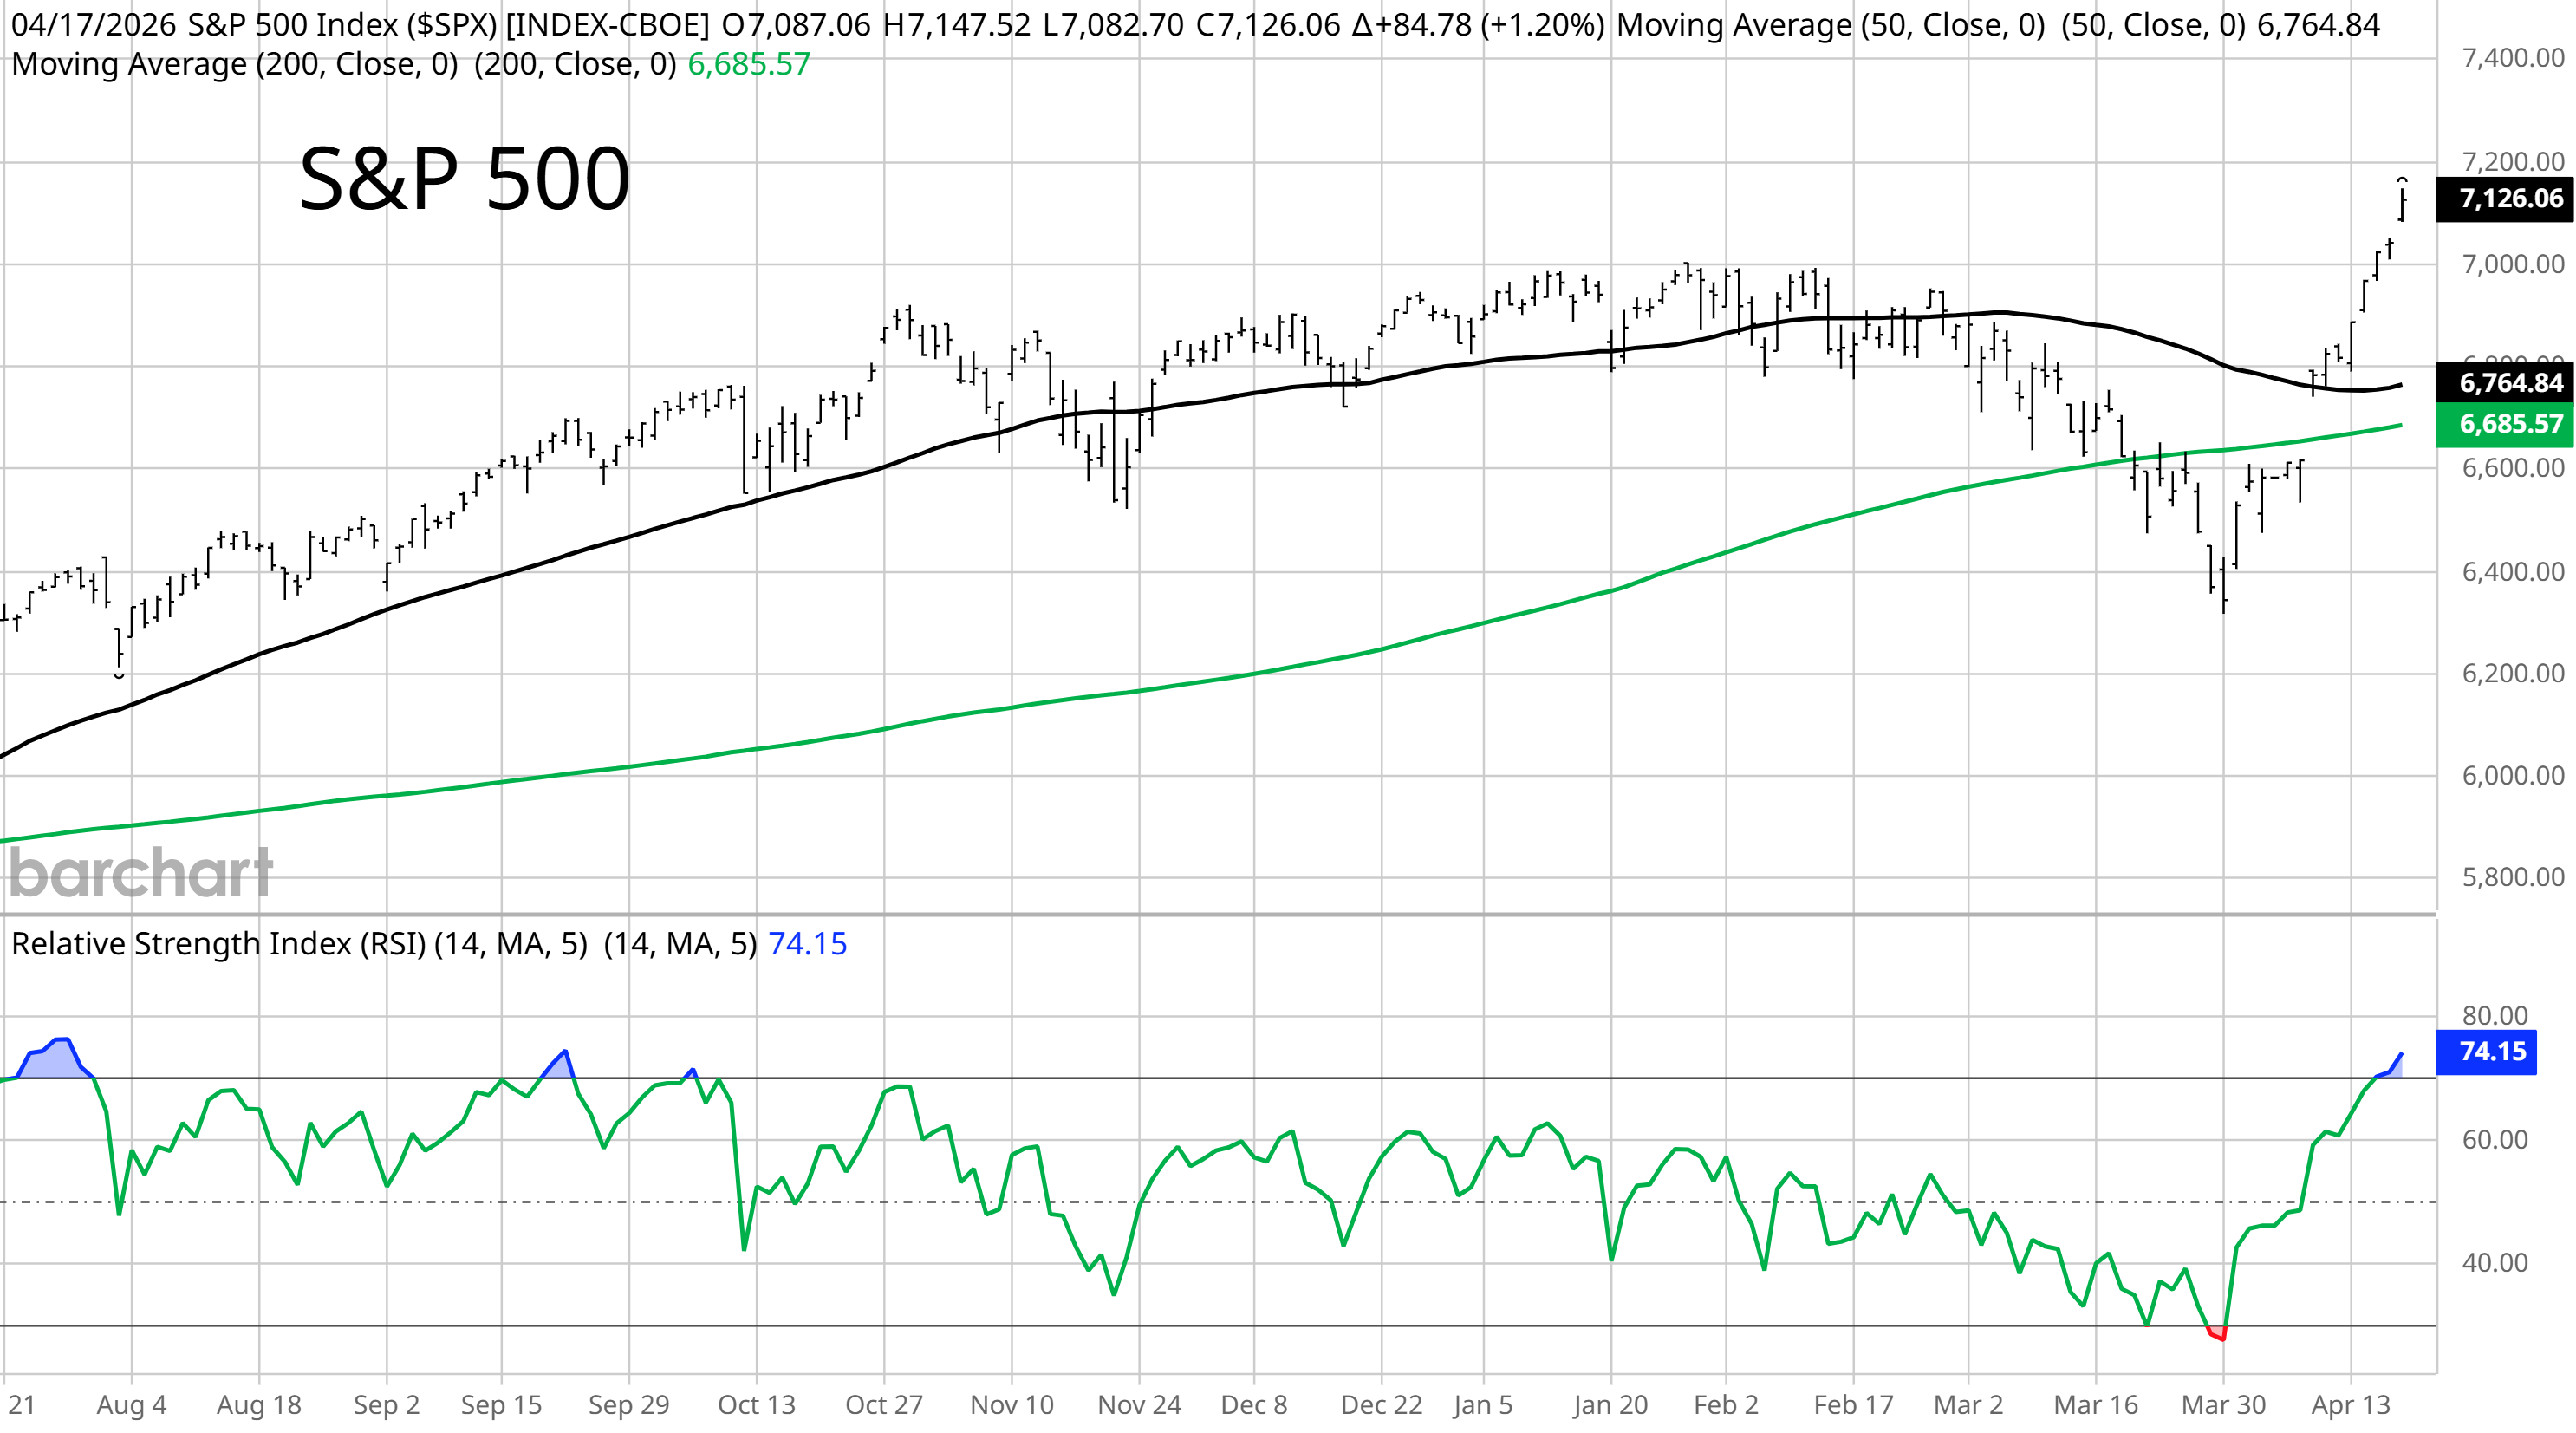
The gains in the S&P 500 over a short stretch pushed the index to historical records. The S&P swung from an oversold to overbought reading in just 11 days, making it the second fastest rally since 1950 (table below).

Oil prices also collapsed to close out the week on signs that energy markets could return to a more normalized state. But in a quick turn of events, headlines emerged over the weekend that Iran had once again closed the Strait with several ships coming under attack.
The sudden change in events has characterized the Middle East conflict since it started at the end of February. And it appears that intensifying hostilities could unwind the bullish action over the past few weeks.
Simply following breadth, sentiment, and positioning by institutional investors helped flag the recent rally. At the same time, warning signs were already emerging as the S&P 500 broke out to record highs.
The number of stocks breaking out to new highs is failing the confirm the move in the indexes, while buying pressure from a key group of institutional investors has largely run its course.
This week, let’s look at the historically strong gains for the S&P and a key driver behind the move. We’ll also look at one concerning development on the market’s move to record highs and tailwinds that could emerge in the month’s ahead.
The Chart Report
After finding a low on March 30, the S&P 500’s rally accelerated when a ceasefire was announced between the U.S. and Iran. That’s when the S&P gapped higher above both the 50- and 200-day moving average (MA) in a single session. As tensions have continued easing (until this weekend), the S&P has kept building on the gains and is up 12.3% in just 13 trading sessions. During that span, the S&P has swung from an oversold to an overbought condition based on the Relative Strength Index (RSI) as you can see in the chart below. That’s the second fastest move from an oversold to overbought condition since 1950.
The rally off the late March low was sparked by extremely bearish positioning built by institutional investors that use momentum and volatility as inputs to drive equity exposure. CTA’s and other risk-parity strategies established one of the largest short positions of the past decade, which created the conditions to see a massive short-covering rally. At one point last week, it was estimated that CTA’s bought more than $86 billion in equity exposure which is one of the largest purchases on record. CTA’s are modelled to continue adding exposure in the week ahead, but that could change if volatility levels pick up. At the same time, the CTA positioning catalyst has been significantly exhausted.

While indexes like the S&P 500 are jumping to new record highs over the past week, participation in the rally has been lacking. On the first day of record highs above the 7,000 level, only 12 stocks in the S&P were making new 52-week highs. That’s among the five lowest instances of participation when the S&P 500 is making a new high since 1999. The chart below plots the number of stocks within the S&P making a new high when the index closes at a record going back to the late 1980s. At the same time, a wide dispersion remains between the S&P’s record level and the median level of constituents remaining in a drawdown. That’s not to say the average stock can’t catch up to the indexes, but is a condition to monitor in the week ahead.

The rally in the S&P 500 is being supported by historical seasonality trends. The period from early March through the end of April has been a strong period for the S&P based on seasonal trends for the past 20 years. Strength this time around didn’t emerge until the end of March, with the recent jump aligning more closely with what’s seen during the four-year presidential election cycle. The chart below plots the S&P across the presidential election cycle using data going back nearly a century. Mid-term election years tend to see the first peak on April 17, which would line up with the S&P’s advance to another record high this past Friday. Based on historic trends, the S&P would pull back into late September before the rally resumes during the fourth quarter.

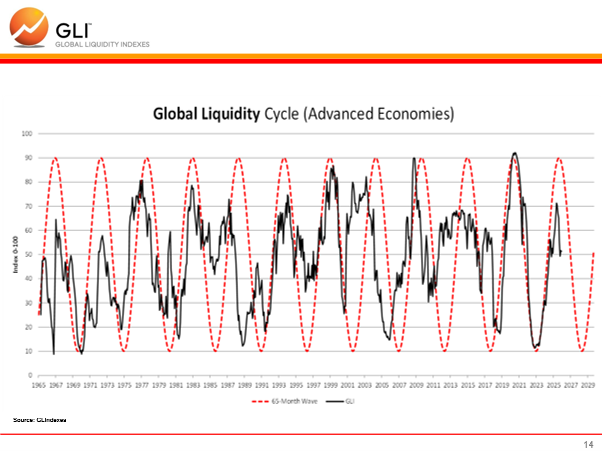
Against the backdrop of geopolitical uncertainty and stock market volatility, it’s worth tracking global liquidity trends and how that’s impacting asset prices. While the rate of change in M2 liquidity in the U.S. is still moving higher, we should be seeing the peak in global liquidity if the 65-month cycle continues tracking as shown in the chart below. Rising global liquidity has been a tailwind for risk assets, with the most recent upswing of the cycle happening alongside the lows seen in 2022’s bear market. With the peak in the cycle underway, it’s worth following assets most sensitive to liquidity trends to confirm the cycle including the highs in Bitcoin seen late last year.
Heard in the Hub
The Traders Hub features live trade alerts, market update videos, and other educational content for members.
Here’s a quick recap of recent alerts, market updates, and educational posts:
Is the next inflation wave underway?
Why the stock market rally has room to run.
A major difference in the S&P 500 versus the trade war.
One energy stock that’s forming a new breakout pattern.
Will this semiconductor stock finally catchup to the sector?
You can follow everything we’re trading and tracking by becoming a member of the Traders Hub.
By becoming a member, you will unlock all market updates and trade alerts reserved exclusively for members.
Trade Idea
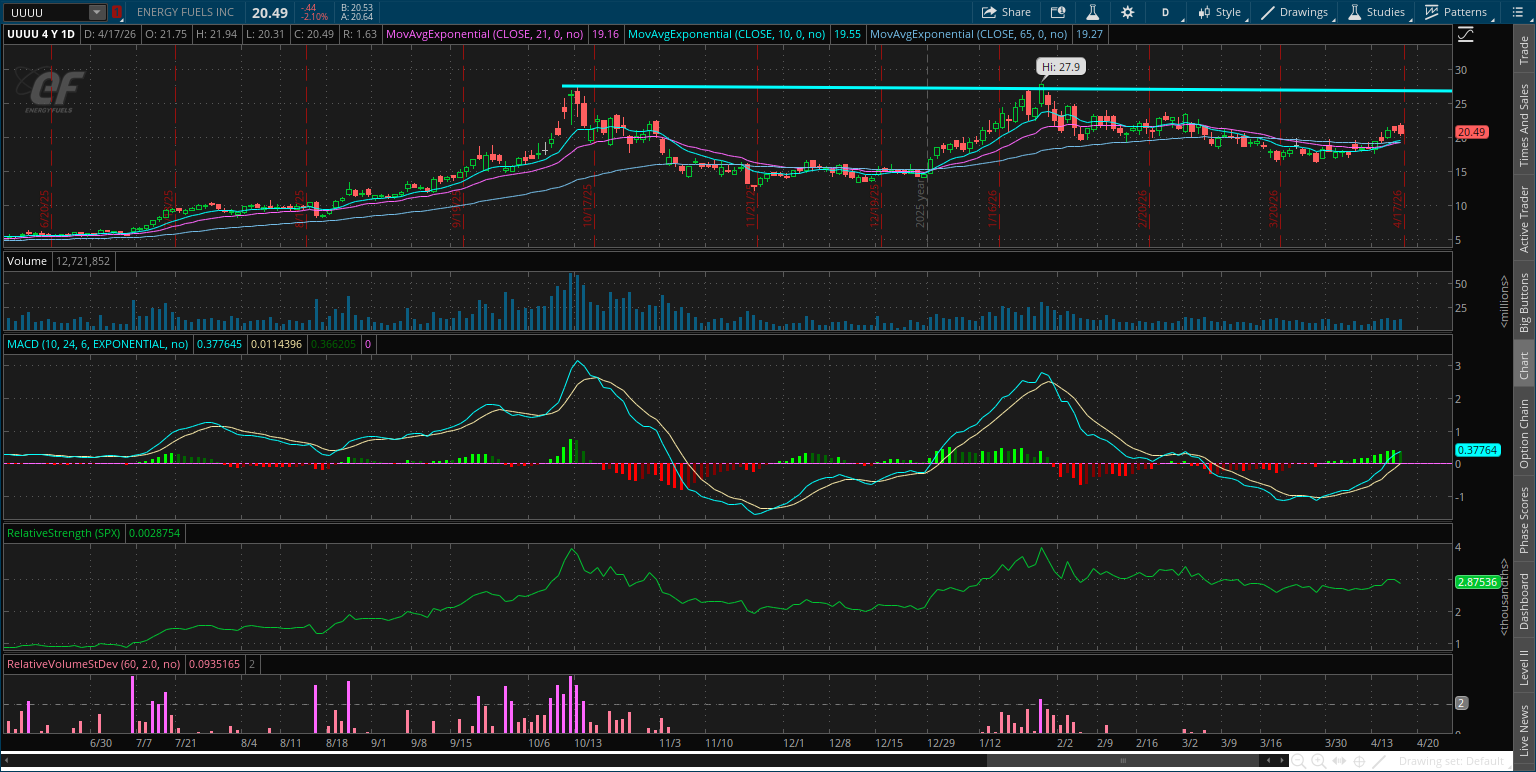
Energy Fuels (UUUU)
Uranium and rare earths stock that peaked near $25 in October and is forming a new pattern. The stock is making a smaller pullback since late January after a test of resistance. The MACD needs to recover back above zero while I’m watching for a move over $25.
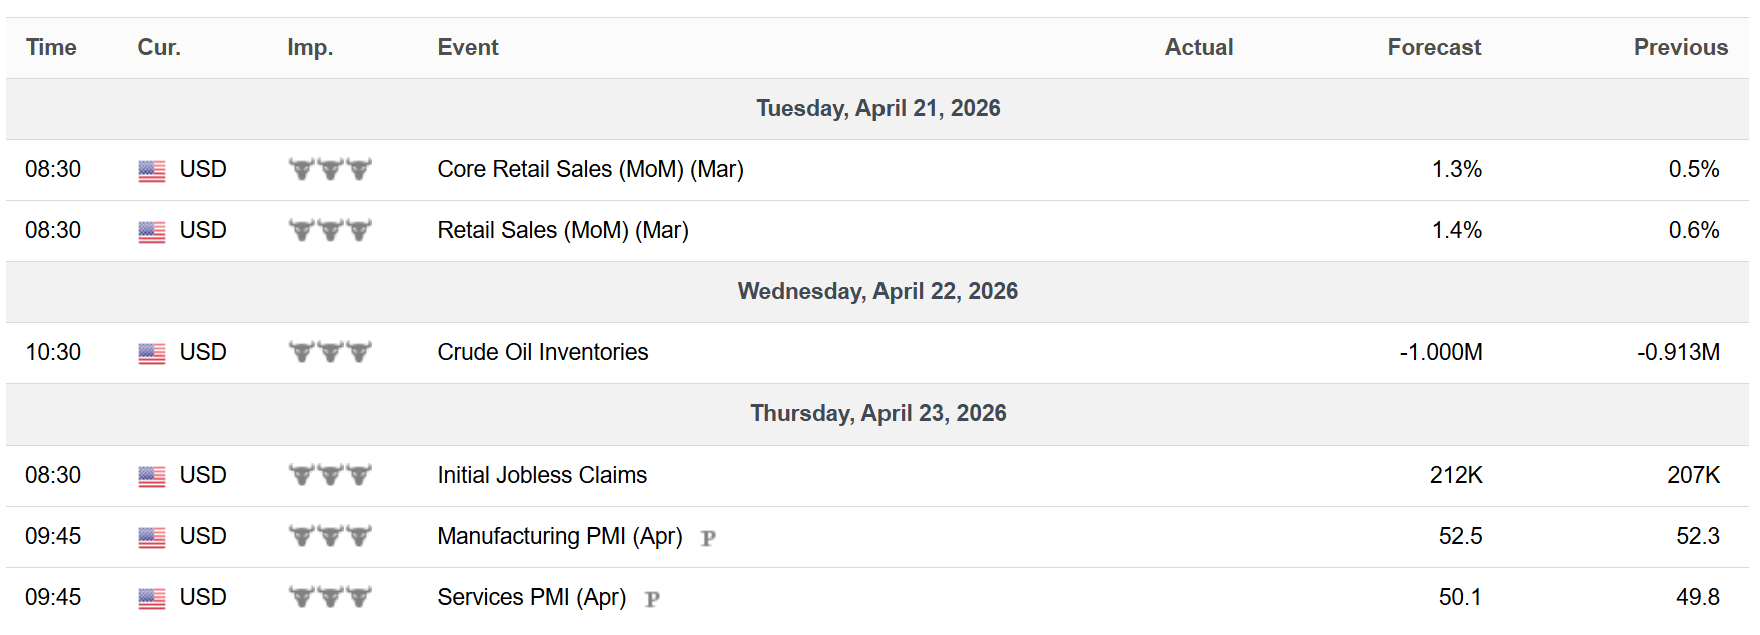
Key Upcoming Data
Economic Reports
Earnings Reports

I hope you’ve enjoyed The Market Mosaic, and please share this report with your family, friends, coworkers…or anyone that would benefit from an objective look at the stock market.
Become a member of the Traders Hub to unlock access to:
✅Model Portfolio
✅Members Only Chat
✅Trade Ideas & Live Alerts
✅Mosaic Vision Market Updates + More
Our model portfolio is built using a “core and explore” approach, including a Stock Trading Portfolio and ETF Investment Portfolio.
Come join us over at the Hub as we seek to capitalize on stocks and ETFs that are breaking out!
And if you have any questions or feedback, feel free to shoot me an email at mosaicassetco@gmail.com
Disclaimer: these are not recommendations and just my thoughts and opinions…do your own due diligence! I may hold a position in the securities mentioned in this report.