The Market Mosaic 4.16.23
Will the S&P 500 finally breakout?
Welcome back to The Market Mosaic, where I gauge the stock market’s next move by looking at macro, technicals, and market internals. I’ll also highlight trade ideas using this analysis.
If you find this content helpful please hit that “like” button, share this post, and become a subscriber to this always free report if you haven’t already done so!
And be sure to check out Mosaic Chart Alerts. It’s a midweek update covering my best chart setups among long and short ideas in the stock market, along with levels that could trigger a trade.
Now for this week’s issue…
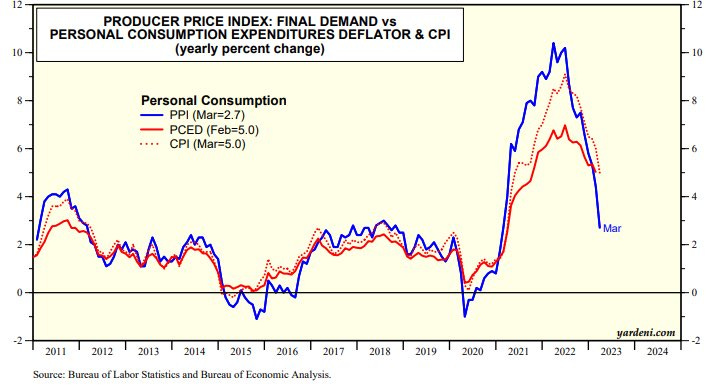
In what’s become the most anticipated monthly economic reports, updated inflation data is showing a moderating pace of price increases. That was evident this past week when both the Consumer and Producer Price Indexes came in less than expected, while continuing to fall off their peak as you can see in the chart below.
And after the experience of the past year, that’s welcome news for investors. The highest rate of inflation in 40 years led to a historic pace of monetary tightening…slapping stocks lower along the way.
But the most recent inflation metrics suggest that rate increases by the Federal Reserve are having an impact on aggregate demand, while normalizing supply chains are helping as well. That means we may be finally nearing a pause in rate hikes after the Fed’s next meeting.
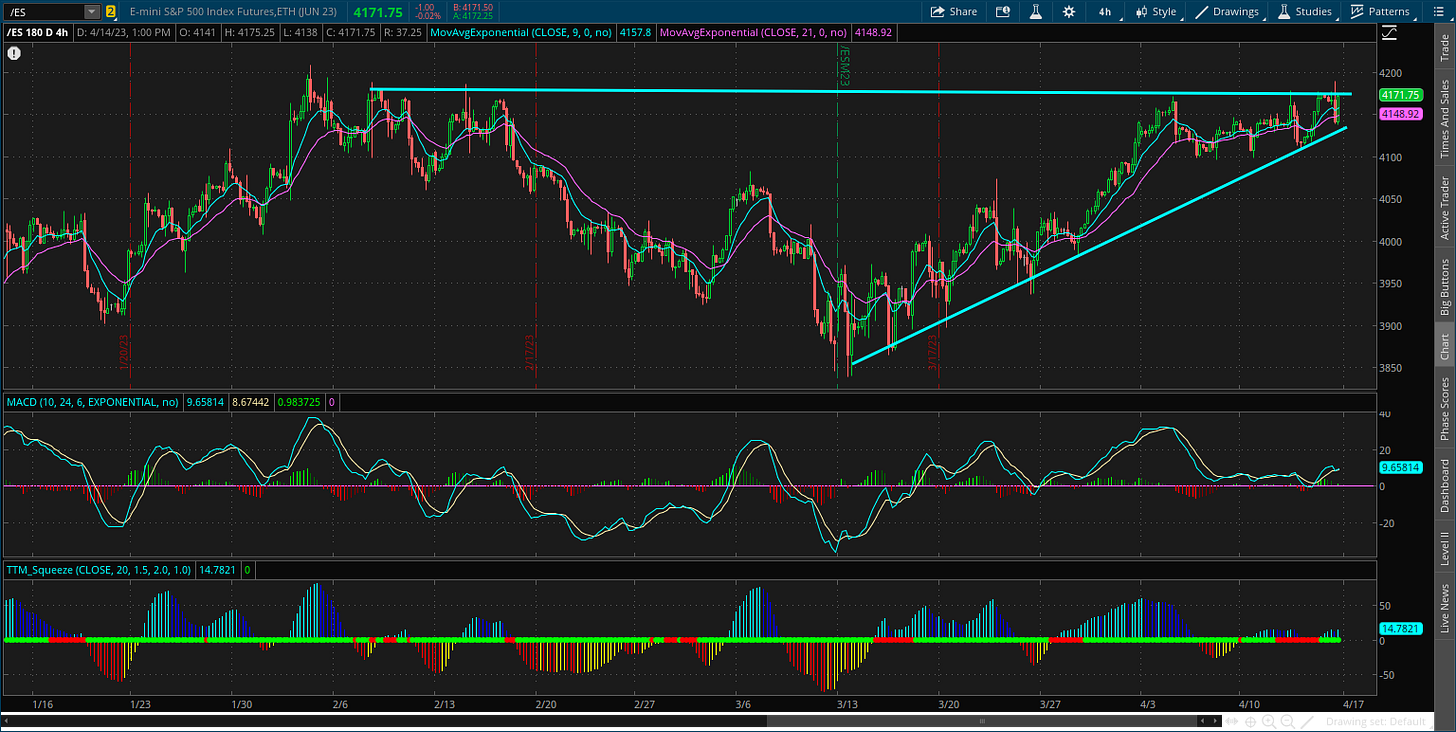
Now I’m watching if the good news will be enough to finally push the S&P 500 out of the pattern below (please note this is a four-hour chart of S&P 500 Index futures). That would set up a move back above 4200 on the Index…a level hasn’t been seen since last August.
But this most recent move to price resistance has been accompanied by a troubling development. Stock market breadth is not only lagging, but also starting to display bearish divergences. And if that condition is not cleared up soon, the rally since mid-March could be in jeopardy.
Breadth Not Supporting the Rally
Just before the mid-March rally got underway, I wrote about how oversold breadth and increasingly bearish sentiment could support a move higher in stocks.
And while the S&P 500 has gained 7% in that time, participation by the average stock has been lackluster over multiple time fractals.
For shorter-term movements, I closely follow the percent of stocks trading above their 20-day moving average (MA). And just as the S&P is testing range resistance noted above, this breadth metric is starting to flash a bearish divergence.
In the chart below, notice what’s happening recently in the circled area. While the S&P 500 is making a higher high on this most recent rally (the blue line), the percent of stocks above their 20-day MA did not confirm (black line). It’s a minor divergence at this point, but is still a development worth monitoring.
But there’s also a troubling trend on longer time frames. I also follow the percent of stocks above their 100-day moving average to take the temperature of trends on a larger degree time period.
Here’s what I find concerning about the chart below. Back at the start of February, the S&P 500 (blue line) was trading close to the levels being tested today. Back then, more than 75% of stocks across the market were trading above their 100-day MA (black line) as you can see with the arrows. But now look at the current level. Despite the S&P trading near similar levels, only 42% of stocks are in longer-term uptrends as shown with the circles.
Finally, the broader market is struggling to generate an expansion in net new 52-week highs. That would make sense, since the S&P 500 remains well below the levels seen one year ago. But you can also see an expansion in net lows with the arrows, when the S&P did not make a lower low over the same time frame.
The presence of negative breadth divergences across multiple time frames is something I’m watching closely. Coupled with the message from another market internal, I’m becoming more cautious on the near-term outlook for stocks.
Now What…
Just as stock market breadth is flashing a warning sign, investor sentiment is swinging back toward greed. You can see that with CNN’s Fear and Greed Index below. It’s not an extreme reading just yet, but bullish sentiment and deteriorating breadth is not a great combination for sustaining a rally.
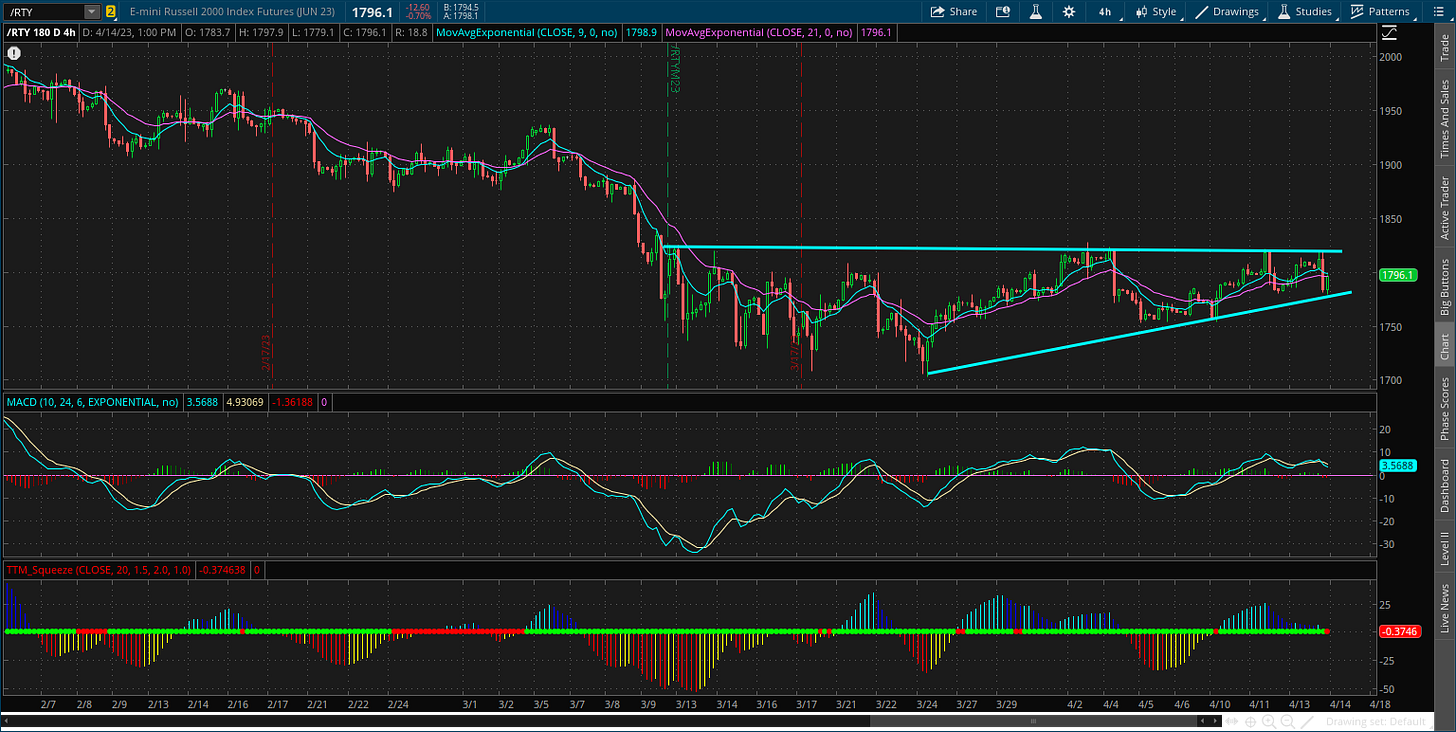
We’re still in a favorable seasonal period as I wrote about here. But I would feel much better about the durability of the rally if participation by the average stock was better. One key area I’m monitoring is with small-cap stocks. The chart below shows Russell 2000 Index futures, which is creating a similar pattern to the S&P 500. I will look to confirm any breakout or breakdown in the S&P with small-caps.
Here’s how I’m adjusting my own trading strategy in this environment. I will still take watchlist trades that meet my criteria as noted in Mosaic Chart Alerts. But I am position sizing much more conservatively and being more proactive on taking gains relative to letting positions run.
There are still stocks working on the long side, like with BBW that I added to my long setups last week. The stock is making a strong move over resistance on Friday:
On the short side, several watchlist stocks are trading close to support levels, like with UPWK that is again testing the $10 support area as the MACD recently reset below the zero line.
That’s all for this week. My best case scenario is that the S&P 500 takes out the 4200 level with broad participation that clears up the breadth concerns noted above. Also keep in mind that earnings season is kicking into full gear, so expect plenty of single-stock volatility either way (and be mindful of those earnings dates for new positions) over the coming weeks.
I hope you’ve enjoyed The Market Mosaic, and please share this report with your family and friends…or anyone that would benefit from an objective look at the stock market.
And make sure you never miss an edition by subscribing here:
For updated charts, market analysis, and other trade ideas, give me a follow on Twitter: @mosaicassetco
And if you have any questions or feedback, feel free to shoot me an email at mosaicassetco@gmail.com
Disclaimer: these are not recommendations and just my thoughts and opinions…do your own due diligence! I may hold a position in the securities mentioned in this report.


